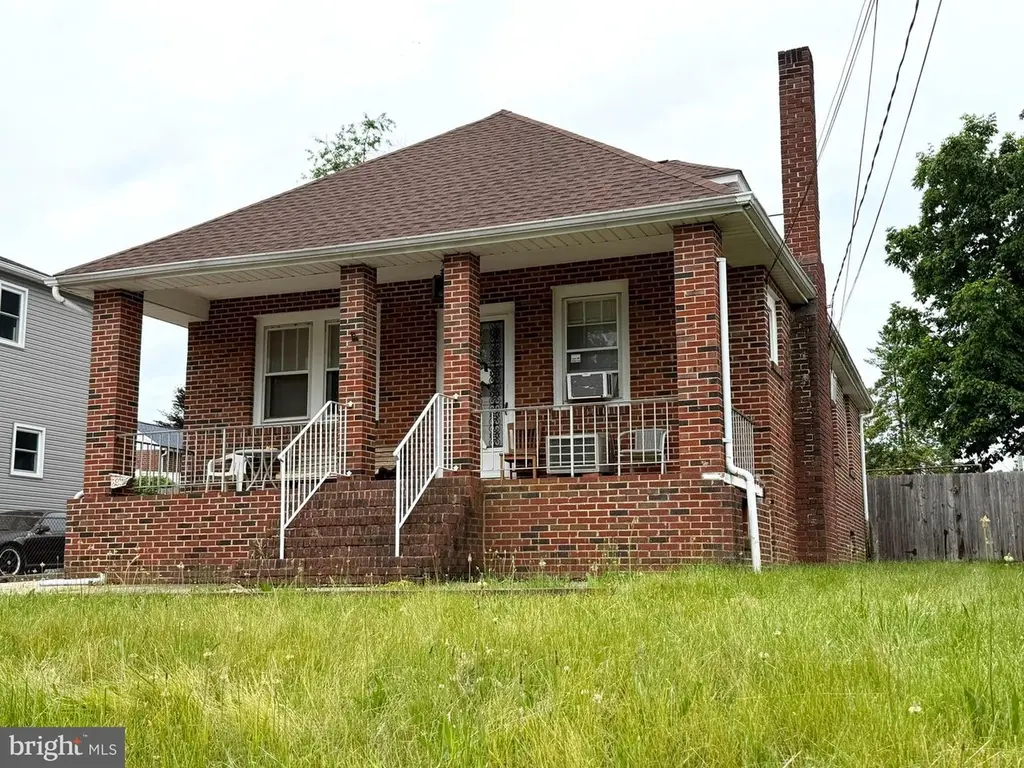
620 N Stuart St · Essex, MD
Flood risk 1/10 · Minimal
- FEMA flood zone
- X (unshaded)
- Chance of flooding over 30 yrs
- 0.0%
- Est. flood insurance / yr
- $473 – $860
Fire risk 1/10 · Minimal
- Est. fire insurance / yr
- $755 – $1,403
Heat risk 8/10 · Major
- Hot days now (above 104°F)
- 7 days/yr
- Hot days in 30 yrs
- 15 days/yr
Wind risk 6/10 · Moderate
- Chance of severe wind over 30 yrs
- 45.0%
Air-quality risk 5/10 · Moderate
- Unhealthy air days now
- 6 days/yr
- Unhealthy air days in 30 yrs
- 8 days/yr
Risk factors via First Street. Map © Google.
Why this score? — see what drove the B- grade
The composite is a weighted blend of 9 inputs, each scored 0–100. Each bar is that input's sub-score; the figure is the points it added to the 100-point composite (weight × sub-score).
- Cash flow +25.2/30.0
- ARV discount +15.0/15.0
- DSCR +8.3/10.0
- 1% rule +6.8/10.0
- Livability +4.0/5.0
- Rent growth +2.8/5.0
- Condition / age +2.5/5.0
- Schools +2.3/10.0
- Appreciation +0.0/10.0
$150,000
🖨 Deal sheet (PDF) 📄 Offer letter ✓ Due diligence
Listing remarks
REAL ESTATE AUCTION featuring ON SITE and SIMULCAST ONLINE BIDDING!! Online Bidding Opens - Monday, June 22, 2026. Live On Site Auction - Tuesday, June 23, 2026 at 2:00 PM. List price is opening bid only. 620 N. Stuart Street is located in the Essex area of eastern Baltimore County, north of Eastern Boulevard (MD-150), west of Marlyn Avenue, south of Myrth Avenue and east of Mace Avenue. The surrounding neighborhood is comprised of well-maintained single family homes. Shopping, dining, public transportation and community services are within walking distance. Waterfront recreational activities are nearby on Back River.
Key facts
- 5,350 sq ft lot
- Garage
- Built 1936
Property features AI
Finance
- Other: Fee simple ownership; Full, improved, partially finished basement
Exterior
- Parking: Detached front-entry garage (1 car); Concrete driveway with about 4 driveway spaces; Total of about 5 parking spaces
- Utilities: Public water; Public sewer; 200+ amp electric service; Natural gas hot water
- Home design: Detached property; Double-hung windows; Architectural shingle roof; Block foundation
- Construction: Brick construction; Block foundation; Architectural shingle roof
- Exterior features: Porch(es); Fully fenced yard with chain link fencing
Interior
- Kitchen: Refrigerator; Electric oven/range
- Bedrooms: Two bedrooms on the main level; One bedroom on the upper level
- Flooring: Hardwood; Vinyl; Ceramic tile
- Bathrooms: Two full bathrooms; One half bathroom
- Heating & cooling: Hot water heating (oil-fired); Window A/C units (electric)
- Interior features: Dining area; Entry-level bedroom; Master bath; Carpeted areas; Wood floors; Living room, dining room, office, recreation room
- Laundry & utility: Laundry in basement
Neighborhood map
What this means for you Summary
Snapshot
- This is a 3-bed/1.0-bath single-family listed at $150k.
Deal economics
- At list price, monthly cash flow is $338 ($4k/yr) — positive.
- The deal already cash-flows at list — no discount required.
- Meets the 1% rule at list price ($2k rent vs $150k).
- Recommended offer: $148k (1.5% below list) — sets the bar for market timing.
- Cap rate 9.0% vs local median 4.9% in Essex — top-decile yield for the area; either an underpriced asset or a hidden risk that comps aren't pricing in. Stress-test before assuming the spread holds.
Location & tenants
- Location reads 79/100 on livability (#60 in MD, #2,277 nationally) — a middle-class / working-renter tenant base. Strengths: commute A+, housing A+, health & safety A; Watch: amenities D+, crime F.
- Baltimore County Public Schools (suburban): math 15% / reading 34% proficiency, ranked #11 of 24 in MD (top 46%) — low school quality limits family demand, transient renter base, plan for 1-2y turnover.
- Zoned schools: Essex Elementary (math 8% / reading 15%, grade F, #580 of 860 statewide, top 67%, 459 students, 72% FRL); Stemmers Run Middle (math 5% / reading 28%, grade F, #174 of 225 statewide, top 81%, 838 students, 68% FRL); Kenwood High (math 10% / reading 43%, grade F, #161 of 222 statewide, top 72%, 1,908 students, 63% FRL) — zoned schools average 68% FRL vs 39% district-wide (29 pts higher); higher-poverty schools than district average — tighter screening recommended.
- Market conditions: Rents rising (+1.1%/yr); 142 active listings in the ZIP; 11 comparable units currently listed for rent nearby; rentals at typical pace (median 23d on market — plan ~3-4 weeks tenant-placement turnaround); 1,511 units permitted in Baltimore County in 2024 (643 in 5+ unit buildings).
- This rent runs 31% of the median local income ($67k/yr) — at the standard rent-burdened threshold; future hikes will face affordability resistance.
Forward outlook
- Local home prices are declining (-3.0%/yr); year-one equity from $1k of loan paydown is wiped out by about $4k of value loss. Plan a longer hold.
- Baltimore County population projected at +12% by 2050 — modest demand growth; plan on rents tracking national, not racing it.
Negotiation context
- It's been on market 20 days — a 2% lower offer ($148k) is reasonable based on typical stale-listing flexibility.
- Current owner paid $30k; list at $150k implies a 400% gain — meaningful room to come down on a strong offer.
Risks & watch-outs
- Watch-outs: built in 1936 — expect roof / HVAC / electrical / plumbing capex.
- Climate carrying-cost: major wind risk, 45% chance of damaging wind over 30y; extreme-heat days projected 7→15/yr by 2055 (HVAC capex compounding) — expect insurance premiums to compound above CPI over the hold.
Questions for the listing agent
- Built in 1936 — when were the roof, HVAC, electrical panel, plumbing, and water heater last replaced?
- Is there a deadline driving the sale (1031 exchange, divorce, estate, relocation)? That informs how much negotiation room exists.
- Schools are D-rated, which usually means shorter tenancies and higher turnover. Who's the typical renter profile here, and what's been the actual vacancy rate?
- Crime grade is F in this area — have there been break-ins, vandalism, or insurance claims at this property in the last 3 years? What carrier currently insures it and at what premium?
- What's the average days-on-market for RENTAL listings here right now (not sales)? A rising rental-DOM trend means longer vacancies and softer asking-rent achievability than the comps imply.
- What's the recent tenant-quality profile in this submarket — average credit score on applications, eviction rate, late-payment / NSF rate, and stable-employment percentage? A property-management company in the area should have these aggregated.
- How much new for-sale + rental construction is in the pipeline within 1–3 miles? Heavy new supply typically softens prices + rents 12–24 months out; constrained supply supports both.
Investment metrics
- 1% rule
- 1.18% ✓
- Cap rate
- 9.00%
- Cash-on-cash
- 9.67%
- DSCR
- 1.43
- GRM
- 7.1
CMA / ARV
- ARV (on-the-fly)
- $286,528
- Comps found
- 3
Show comp detail 3 sales within ~0.75 mi
| Address | Dist | Beds/Ba | Sqft | Sold | Price | $/sf | Match |
|---|---|---|---|---|---|---|---|
| 411 N Woodward Dr | 0.20mi | 3/1.0 | 920 (-5%) | 13mo | $270,000 | $293 | 71 |
| 355 Montrose Ave | 0.27mi | 3/2.0 | 1,044 (+8%) | 10mo | $310,000 | $297 | 62 |
| 314 Savannah Rd | 0.46mi | 3/2.0 | 1,099 (+14%) | 8mo | $325,000 | $296 | 45 |
Match score weights: distance 35% · size 25% · config 20% · recency 20%. Top-matched comps best support the ARV.
Projected returns pro-forma
-3.0% appreciation · 1.08% rent growth · sell at horizon
- IRR
- -3.9%
- Equity multiple
- 0.86×
- Total profit
- $-6,065
- Equity at exit
- $22,365
- IRR
- 3.4%
- Equity multiple
- 1.22×
- Total profit
- $9,416
- Equity at exit
- $12,969
Cash invested: $42,000 (down + closing). Projections, not guarantees.
Landlord ↔ Tenant lean methodology
- Overall (STATE)
- 27 Tenant-Leaning
- State Maryland
- 27 Tenant-Leaning · D+14
- County
- — inherits STATE
- City
- — inherits STATE
ZIP-level market 21221
- Rents YoY
- 1.1%
- Active inventory
- 142
- Price-to-rent
- 7.1×
Monthly cashflow live
- Estimated rent
- $1,764 high interval (Pro) →
- Mortgage (P&I)
- −$787
- Tax from tax record
- −$206 /mo · $2,476/yr
- Insurance
- −$62
- HOA
- −$0
- Vacancy / Maint / Mgmt
- −$370
- Net cashflow
- $338
Break-even live
Sensitivity live
| Price | -10% $423 | -5% $381 | +0% $338 | +5% $296 | +10% $253 |
|---|---|---|---|---|---|
| Rent | -10% $199 | -5% $269 | +0% $338 | +5% $408 | +10% $478 |
| Rate | -1.0pp $414 | -0.5pp $376 | base $338 | +0.5pp $299 | +1.0pp $260 |
UW: 25.0% down · 7.5% · 30yr · 1.5% tax · 5.0% vac · 8.0% maint · 8.0% mgmt
Financing live
Cash to close
- Down payment
- $37,500
- Closing costs
- $4,500
- Reserves months
- —
- Total cash needed
- —
Loan-product check · same deal, 3 products live
Conventional
25% down · 7.5% · 30yr
- Down + closing
- —
- Monthly P&I
- —
- Monthly cashflow
- —
- DSCR
- —
- Eligible?
- —
Personal DTI + credit; lowest rate.
DSCR
20% down · 8.5% · 30yr
- Down + closing
- —
- Monthly P&I
- —
- Monthly cashflow
- —
- DSCR
- —
- Eligible?
- —
No personal income docs; deal must DSCR.
Hard money
10% down · 12.0% · 12mo
- Down + closing
- —
- Monthly P&I
- —
- Monthly cashflow
- —
- DSCR
- —
- Eligible?
- —
Short-term bridge; refi at stabilization.
Rent comps 11 comps
| Address | Beds | Baths | Sqft | Rent | $/sqft | DOM | Units | Dist |
|---|---|---|---|---|---|---|---|---|
| 305 S Marlyn Ave Unit A Essex, MD | 2.0 | 1.0 | 676 | $1,300 | $1.92 | 45d | 1 | 0.67mi |
| 165 Hampshire Rd Essex, MD | 3.0 | 2.0 | 969 | $1,895 | $1.96 | 45d | 1 | 0.71mi |
| 846 Brunswick Rd Essex, MD | 2.0 | 1.0 | 500 | $1,272 | $2.54 | 45d | 42 | 0.74mi |
| 846 Brunswick Rd Essex, MD | 1.0–2.0 | 1.0–2.0 | 500 | $1,241 | $2.48 | 4d | 49 | 0.74mi |
| 4 Essex Ave Unit A Essex, MD | 2.0 | 1.0 | 800 | $1,250 | $1.56 | 25d | 1 | 0.85mi |
| 421 Torner Rd Essex, MD | 3.0 | 2.0 | 1024 | $2,050 | $2.00 | 23d | 1 | 1.03mi |
| 706 Seawall Rd Essex, MD | 3.0 | 1.0 | 1114 | $1,900 | $1.71 | 6d | 1 | 1.30mi |
| 4 Banyan Wood Ct #103 Essex, MD | 2.0 | 1.0 | 980 | $1,700 | $1.73 | 17d | 1 | 1.36mi |
| 710h Snowberry Ct Essex, MD | 2.0 | 1.0 | 544 | $1,382 | $2.54 | 6d | 1 | 1.40mi |
| 1409 Nicolay Way Essex, MD | 3.0 | 2.0 | 1008 | $1,950 | $1.93 | 6d | 1 | 1.46mi |
| 1302 Sugarwood Cir #102 Essex, MD | 3.0 | 1.0 | 922 | $1,800 | $1.95 | 45d | 1 | 1.50mi |
Listing history 16 events
-
2026-06-21days on market $150,000 Active 20 DOM
-
2026-06-18days on market $150,000 Active 17 DOM
-
2026-06-17days on market $150,000 Active 16 DOM
-
2026-06-16days on market $150,000 Active 15 DOM
-
2026-06-15days on market $150,000 Active 14 DOM
-
2026-06-13days on market $150,000 Active 12 DOM
-
2026-06-09days on market $150,000 Active 8 DOM
-
2026-06-08days on market $150,000 Active 7 DOM
-
2026-06-07days on market $150,000 Active 6 DOM
-
2026-06-04days on market $150,000 Active 3 DOM
-
2026-06-03days on market $150,000 Active 2 DOM
-
2026-06-02statusdays on market $150,000 Active 1 DOM
-
2026-06-01days on market $150,000 Coming Soon 5 DOM
-
2026-05-31days on market $150,000 Coming Soon 4 DOM
-
2026-05-27historical $150,000
-
1976-10-11soldstatus $30,000
ⓘ Source: listings_history table (triggers on properties + properties_extension) + one-shot
backfill from property_details.listing_events for pre-trigger history.
Tax reassessment forecast MD · Partial reset (capped growth)
- Current annual tax
- $2,476 · $206/mo
- Projected year-2 tax
- $2,476 · $206/mo
- Expected delta
- $0/yr ($0/mo · 0.0%)
ⓘ Screening estimate from a state-policy table — verify with the county assessor before closing.
Climate risk First Street
- Flood 1/10 Low FEMA zone X (unshaded) · 0% chance over 30 yrs
- Wildfire 1/10 Low
- Heat 8/10 Severe 7 d/yr ≥104°F today · 15 d/yr by 30 yrs out
- Wind 6/10 Major 45% chance of damaging wind over 30 yrs
- Air quality 5/10 Major 6 unhealthy d/yr today · 8 by 30 yrs out
Nearby sold comps map
Loading sold comps map…
Walkable amenities ~0.75 mi
Loading nearby amenities…
Taxation est. · year 1
- Rental income
- $21,171
- − Mortgage interest
- −$8,402
- − Property taxes
- −$2,476
- − Insurance
- −$750
- − Repairs & maintenance
- −$1,694
- − Management
- −$1,694
- − Depreciation
- −$4,364
- Taxable income
- $1,792
- Est. tax owed @ 24.0%
- −$430
- After-tax cash flow
- $3,630/yr
For passive investors: Depreciation is non-cash, so a rental often shows a tax loss while cash-flowing — sheltering income. Rental losses are passive: they offset passive income freely, and up to $25,000/yr can offset ordinary (W-2) income if you actively participate and your MAGI is under $100k (phasing out to $0 by $150k); unused losses carry forward. On sale, claimed depreciation is recaptured at up to 25%, and gains may owe capital-gains tax (a 1031 exchange can defer both). Figures are a year-1 estimate at your 24.0% rate — not tax advice; consult a CPA.
Schools (NCES district)
- District
- Baltimore County Public Schools
- NCES district ID
- 2400120
- Math proficiency
- 15% ▼ -16.00%
- Reading proficiency
- 34% ▼ -5.00%
- Median HH income
- $66,746
- Composite
- 23.17/100
- National rank
- #7948
- State rank
- #11 of 24 in MD
Livability — Essex
- Score
- 79/100
- State rank
- #60
- US rank
- #2277
Category grades
Schools grade is shown separately in the Schools card above.
Census & demographics
- Census place
- Essex, MD
- County
- Baltimore County · 769,527 people
- City population
- 43,487
- Metro
- Baltimore-Columbia-Towson, MD
- Population (ZIP)
- 43,487
- Household income
- $67,340
- Rent vs Own
- Severe rent burden
- 1757.0
Population outlook (Baltimore County) Hauer SSP2
- Today (2025)
- 885,518 people
- By 2030
- 909,272 · +2.7%
- By 2040
- 951,547 · +7.5%
- By 2050
- 990,955 · +11.9%
- By 2075
- 1,086,411 · +22.7%
- By 2100
- 1,135,078 · +28.2%
Race, ethnicity, and origin ACS 2023
- Neighborhood character
- Diverse neighborhood (Simpson 0.60)
- Race & ethnicity
- White 54% Black 32% Two or more races 7% Hispanic / Latino 7% Asian 1%
- Hispanic origin (detail)
- Mexican 2% Puerto Rican 1% Dominican 1%
- Common ancestry
- Romanian 5% Lithuanian 1% Slovak 1%
- Foreign-born
- 8% · Canada, China
- Languages at home
- 89% English-only · Spanish 6% French/Haitian/Cajun 1%
Political lean MEDSL · Baltimore
- 2024 margin
- Strong D (+24.5) · D 61.0% · R 36.5% · Other 2.5%
- 2008→2024 swing
- +9.9pp toward D · 2008: 14.6pp · 2024: 24.5pp
- All cycles
- 2024: D+24.5 2020: D+27.0 2016: D+17.4 2012: D+16.4 2008: D+14.6
Not yet ingested
- Civics
- —
Market trends
- HPI YoY
- ▼ -232.14%
- Current HPI
- 237.1069
- Rent YoY
- ▲ 1.08%
- Metro
- Baltimore-Columbia-Towson, MD
- State GDP YoY
- ▲ 2.97%
- F500 in state
- 12
Industry mix (Fortune 500 HQ in MD)
| Industry | F500 HQs | Revenue |
|---|---|---|
| Aerospace / Defense | 1 | $71B |
|
||
| Utilities | 1 | $25B |
|
||
| Hotels | 1 | $24B |
|
||
| Consumer Goods | 1 | $7B |
|
||
| Real Estate | 1 | $6B |
|
||
| Chemicals | 1 | $2B |
|
||
Price history
+400.0% since first listed2 events — show timeline
- 2026-05-27 Coming Soon $150,000 BRIGHT MLS
- 1976-10-11 Sold (Public Records) $30,000 Public Records
Property tax history
+1.6%/yrLatest (2025): $2,476 · +2.7% YoY. Source: county tax records.
Cash-flow waterfall
monthlySold comps — $/sqft
last 12 mo · ≤1 miLoading sold comps…