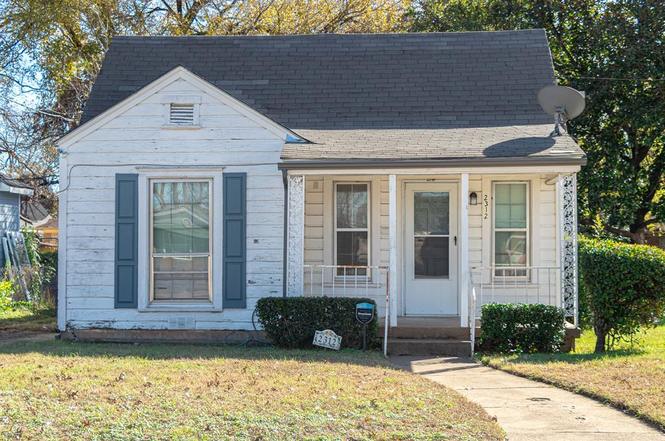
2312 Jordan St · Dallas, TX
Flood risk 1/10 · Minimal
- FEMA flood zone
- X (unshaded)
- Chance of flooding over 30 yrs
- 0.0%
- Est. flood insurance / yr
- $507 – $1,088
Fire risk 1/10 · Minimal
- Est. fire insurance / yr
- $1,222 – $2,270
Heat risk 7/10 · Major
- Hot days now (above 110°F)
- 7 days/yr
- Hot days in 30 yrs
- 24 days/yr
Wind risk 6/10 · Moderate
- Chance of severe wind over 30 yrs
- 27.0%
Air-quality risk 3/10 · Minor
- Unhealthy air days now
- 2 days/yr
- Unhealthy air days in 30 yrs
- 3 days/yr
Risk factors via First Street. Map © Google.
Why this score? — see what drove the B- grade
The composite is a weighted blend of 9 inputs, each scored 0–100. Each bar is that input's sub-score; the figure is the points it added to the 100-point composite (weight × sub-score).
- Cash flow +20.8/30.0
- ARV discount +13.3/15.0
- DSCR +6.6/10.0
- 1% rule +5.6/10.0
- Appreciation +5.4/10.0
- Rent growth +4.3/5.0
- Livability +4.0/5.0
- Schools +2.8/10.0
- Condition / age +2.5/5.0
$188,500
🖨 Deal sheet 📄 Offer letter ✓ Due diligence
Listing remarks MLS
Cash Offer onlly...This traditional home with Strong Bones is waiting for you. Located in the Historic Queen City area. With a little updating, this Tudor style house offers the true mid-30's charm. Inviting porch welcomes you into warm living room. Flow on through formal dining, kitchen with dual sink, window and utility room. Stove purchased in May 2019 will remain. All bedrooms are on the separate hallway for privacy. Not like normal floorplans in the neighborhood, there are 2 full bathrooms and bonus huge familyroom that is perfect for movie time. Your imagination is the only limitation. Pricing reflects being SOLD AS IS, NO REPAIRS. Close to major freeways, schools, parks and Downtown Dallas.
Key facts
- Original character
- Natural light
- Classic front porch
Tags
Property features AI
Finance
- Other: Property type: Residential (Single Family Residence); Subdivision: Pettons P T; County: Dallas
- Financial info: Listing accepts Cash, Conventional, FHA, and VA financing; Treat as clear loan status; No second mortgage reported
- HOA & community: No homeowners association
Exterior
- Parking: Carport for 1 vehicle; Driveway parking; On-property storage
- Utilities: City water; City sewer; Not in a municipal utility district
- Home design: Single family residence; One story
- Construction: Built in 1936
- Exterior features: Lot less than 0.5 acre; Lot approximately 0.105 acre
Interior
- Kitchen: Dishwasher; Gas cooktop; Gas range; Refrigerator
- Bedrooms: Three bedrooms (all on the main level)
- Bathrooms: Two full bathrooms (both on the main level)
- Heating & cooling: Central heating; Central air conditioning
- Interior features: Five total rooms; Two living areas; One dining area; Other interior features
Neighborhood map
What this means for you Summary
Snapshot
- This is a 3-bed/2.0-bath single-family listed at $188k.
Deal economics
- At list price, monthly cash flow is $257 ($3k/yr) — positive.
- The deal already cash-flows at list — no discount required.
- Meets the 1% rule at list price ($2k rent vs $188k).
- Recommended offer: $166k (12.0% below list) — sets the bar for market timing.
- Cap rate 7.9% vs local median 2.3% in Dallas — top-decile yield for the area; either an underpriced asset or a hidden risk that comps aren't pricing in. Stress-test before assuming the spread holds.
Location & tenants
- Location reads 81/100 on livability (#24 in TX, #1,380 nationally) — a professional / high-income tenant draw. Strengths: amenities A+, commute A+, housing A+; Watch: crime F.
- Dallas ISD (urban): math 31% / reading 36% proficiency, ranked #559 of 826 in TX (top 68%) — families likely to look elsewhere, expect single-tenant / working-renter base with shorter leases; 83% free/reduced lunch — lower-income household profile, screen leases tightly.
- Zoned schools: H S Thompson Learning Center (498 students, 99% FRL) — zoned schools average 99% FRL vs 83% district-wide (16 pts higher); higher-poverty schools than district average — tighter screening recommended.
- Market conditions: Rents rising fast (+7.2%/yr); 248 active listings in the ZIP; 40 comparable units currently listed for rent nearby; rentals at typical pace (median 21d on market — plan ~3-4 weeks tenant-placement turnaround); 12,577 units permitted in Dallas County in 2024 (6,829 in 5+ unit buildings).
Forward outlook
- In year one you build about $3k of equity ($1k loan paydown + $1k appreciation (0.8% local appreciation)).
- Dallas County population projected at +35% by 2050 — long-run rental-demand tailwind backs the buy-and-hold thesis.
- At projected returns (0.8% appreciation + 7.2% rent growth), your $53k cash investment doubles in ~6 years — after that, you're playing with house money.
- By year 10, paydown + projected appreciation supports a ~$30k cash-out refi (75% LTV) — recoverable capital for the next deal without selling this one.
Negotiation context
- It's been on market 144 days — a 12% lower offer ($166k) is reasonable based on typical stale-listing flexibility.
- 2 sale attempts since 7y ago; this cycle's ask has dropped $30k (14%) from the opening price — seller is motivated, your offer sets the floor, not the list.
Risks & watch-outs
- Watch-outs: built in 1936 — expect roof / HVAC / electrical / plumbing capex.
- Climate carrying-cost: major wind risk, 27% chance of damaging wind over 30y; extreme-heat days projected 7→24/yr by 2055 (HVAC capex compounding) — expect insurance premiums to compound above CPI over the hold.
Questions for the listing agent
- It's been on market 144 days. Have you received any prior offers? Is the seller open to a 12% concession, seller financing, or rate buy-down credit?
- Built in 1936 — when were the roof, HVAC, electrical panel, plumbing, and water heater last replaced?
- Why hasn't it sold? Are there any deal-killer items the seller is aware of (foundation, flood, title, zoning, code violations)?
- Is there a deadline driving the sale (1031 exchange, divorce, estate, relocation)? That informs how much negotiation room exists.
- Crime grade is F in this area — have there been break-ins, vandalism, or insurance claims at this property in the last 3 years? What carrier currently insures it and at what premium?
- What's the average days-on-market for RENTAL listings here right now (not sales)? A rising rental-DOM trend means longer vacancies and softer asking-rent achievability than the comps imply.
- What's the recent tenant-quality profile in this submarket — average credit score on applications, eviction rate, late-payment / NSF rate, and stable-employment percentage? A property-management company in the area should have these aggregated.
- How much new for-sale + rental construction is in the pipeline within 1–3 miles? Heavy new supply typically softens prices + rents 12–24 months out; constrained supply supports both.
Investment metrics
- 1% rule
- 1.06% ✓
- Cap rate
- 7.93%
- Cash-on-cash
- 5.85%
- DSCR
- 1.26
- GRM
- 7.9
CMA / ARV
- ARV (on-the-fly)
- $216,216
- Comps found
- 12
Show comp detail 12 sales within ~0.75 mi
| Address | Dist | Beds/Ba | Sqft | Sold | Price | $/sf | Match |
|---|---|---|---|---|---|---|---|
| 2312 Jordan St | 0.00mi | 3/2.0 | 1,386 (0%) | 1mo | $188,500 | $136 | 99 |
| 1817 Cooper St | 0.24mi | 3/2.5 | 1,405 (+1%) | 4mo | $220,000 | $157 | 81 |
| 1570 Panama Pl | 0.54mi | 3/2.5 | 1,376 (-1%) | 4mo | $205,000 | $149 | 68 |
| 4422 Crozier St | 0.50mi | 4/2.0 (+1) | 1,414 (+2%) | 2mo | $160,000 | $113 | 66 |
| 1609 Pine St | 0.53mi | 3/2.0 | 1,445 (+4%) | 3mo | $229,000 | $158 | 66 |
| 3925 Malcolm X Blvd | 0.43mi | 3/2.0 | 1,248 (-10%) | 0mo | $199,000 | $159 | 63 |
| 2923 Carpenter Ave | 0.71mi | 3/2.0 | 1,410 (+2%) | 5mo | $220,000 | $156 | 60 |
| 2232 Poplar St | 0.31mi | 3/1.0 | 1,231 (-11%) | 5mo | $90,000 | $73 | 59 |
| 3300 Holmes St | 0.56mi | 3/2.5 | 1,473 (+6%) | 4mo | $215,000 | $146 | 58 |
| 3712 Ruskin St | 0.26mi | 4/2.0 (+1) | 1,210 (-13%) | 4mo | $210,000 | $174 | 58 |
| 3424 Kimble St | 0.27mi | 3/1.0 | 1,178 (-15%) | 2mo | $150,000 | $127 | 57 |
| 3719 Meadow St | 0.69mi | 3/2.0 | 1,222 (-12%) | 2mo | $225,000 | $184 | 46 |
Match score weights: distance 35% · size 25% · config 20% · recency 20%. Top-matched comps best support the ARV.
Projected returns pro-forma
0.79% appreciation · 7.19% rent growth · sell at horizon
- IRR
- 9.8%
- Equity multiple
- 1.51×
- Total profit
- $26,750
- Equity at exit
- $62,291
- IRR
- 16.6%
- Equity multiple
- 3.21×
- Total profit
- $116,702
- Equity at exit
- $81,210
Cash invested: $52,780 (down + closing). Projections, not guarantees.
Landlord ↔ Tenant lean methodology
- Overall (STATE)
- 87 Strongly Landlord-Friendly
- State Texas
- 87 Strongly Landlord-Friendly · R+5
- County
- — inherits STATE
- City
- — inherits STATE
ZIP-level market 75215
- Home prices YoY
- 0.3%
- Rents YoY
- 7.2%
- Active inventory
- 248
- Price-to-rent
- 7.9×
Monthly cashflow live
- Estimated rent
- $1,991 high interval (Pro) →
- Mortgage (P&I)
- −$989
- Tax from tax record
- −$248 /mo · $2,980/yr
- Insurance
- −$79
- HOA
- −$0
- Vacancy / Maint / Mgmt
- −$418
- Net cashflow
- $257
Break-even live
UW: 25.0% down · 7.5% · 30yr · 1.5% tax · 5.0% vac · 8.0% maint · 8.0% mgmt
Financing live
Cash to close
- Down payment
- $47,125
- Closing costs
- $5,655
- Reserves months
- —
- Total cash needed
- —
Loan-product check · same deal, 3 products live
Conventional
25% down · 7.5% · 30yr
- Down + closing
- —
- Monthly P&I
- —
- Monthly cashflow
- —
- DSCR
- —
- Eligible?
- —
Personal DTI + credit; lowest rate.
DSCR
20% down · 8.5% · 30yr
- Down + closing
- —
- Monthly P&I
- —
- Monthly cashflow
- —
- DSCR
- —
- Eligible?
- —
No personal income docs; deal must DSCR.
Hard money
10% down · 12.0% · 12mo
- Down + closing
- —
- Monthly P&I
- —
- Monthly cashflow
- —
- DSCR
- —
- Eligible?
- —
Short-term bridge; refi at stabilization.
Rent comps 40 comps
| Address | Beds | Baths | Sqft | Rent | $/sqft | DOM | Units | Dist |
|---|---|---|---|---|---|---|---|---|
| 3502 Edgewood St Dallas, TX | 4.0 | 2.0 | 1866 | $2,523 | $1.35 | 2d | 1 | 0.23mi |
| 3501 Latimer St Dallas, TX | 2.0 | 1.0 | 1008 | $1,095 | $1.09 | 3d | 1 | 0.26mi |
| 3711 Guaranty St Dallas, TX | 3.0 | 1.0 | 984 | $1,800 | $1.83 | 15d | 1 | 0.27mi |
| 3521 S Harwood St Dallas, TX | 3.0 | 2.5 | 1750 | $2,700 | $1.54 | 3d | 1 | 0.27mi |
| 3413 Wendelkin St Dallas, TX | 3.0 | 2.5 | 1724 | $2,650 | $1.54 | 2d | 1 | 0.38mi |
| 4024 Colonial Ave Dallas, TX | 4.0 | 2.0 | 1560 | $2,400 | $1.54 | 24d | 1 | 0.39mi |
| 2507 Birmingham Ave Dallas, TX | 3.0 | 2.5 | 1516 | $2,500 | $1.65 | 24d | 1 | 0.42mi |
| 4024 Myrtle St Dallas, TX | 3.0 | 2.0 | 1106 | $1,595 | $1.44 | 5d | 1 | 0.44mi |
| 2822 McDermott Ave Dallas, TX | 3.0 | 2.0 | 1200 | $1,795 | $1.50 | 24d | 1 | 0.45mi |
| 1630 Poplar St Dallas, TX | 2.0 | 1.0 | 903 | $1,400 | $1.55 | 24d | 1 | 0.46mi |
| 1628 Poplar St Dallas, TX | 2.0 | 1.0 | 903 | $1,400 | $1.55 | 43d | 1 | 0.47mi |
| 2847 Metropolitan Ave Dallas, TX | 3.0 | 1.0 | 1344 | $2,050 | $1.53 | 22d | 1 | 0.52mi |
| 3609 Cleveland St Dallas, TX | 4.0 | 2.5 | 1500 | $2,700 | $1.80 | 7d | 1 | 0.56mi |
| 2513 Southland St Dallas, TX | 2.0 | 1.0 | 1010 | $1,399 | $1.39 | 20d | 1 | 0.60mi |
| 2513 Southland St Dallas, TX | 2.0 | 1.0 | 1010 | $1,299 | $1.29 | 3d | 1 | 0.60mi |
| 2561 Elsie Faye Heggins St Dallas, TX | 3.0 | 2.0 | 876 | $1,390 | $1.59 | 6d | 1 | 0.66mi |
| 2563 Elsie Faye Heggins St Dallas, TX | 3.0 | 2.0 | 876 | $1,240 | $1.42 | 15d | 1 | 0.66mi |
| 2603 Elsie Faye Heggins St Dallas, TX | 3.0 | 2.0 | 876 | $1,385 | $1.58 | 43d | 1 | 0.67mi |
| 2615 Elsie Faye Heggins St Dallas, TX | 3.0 | 2.0 | 876 | $1,280 | $1.46 | 15d | 1 | 0.67mi |
| 2627 Elsie Faye Heggins St Dallas, TX | 3.0 | 2.0 | 876 | $1,280 | $1.46 | 43d | 1 | 0.67mi |
| 3907 Roberts Ave Dallas, TX | 3.0 | 1.0 | 908 | $1,395 | $1.54 | 15d | 1 | 0.76mi |
| 3915 Coolidge St Dallas, TX | 4.0 | 2.0 | 1416 | $2,100 | $1.48 | 43d | 1 | 0.81mi |
| 3331 Spring Ave Dallas, TX | 3.0 | 2.0 | 1652 | $2,200 | $1.33 | 7d | 1 | 0.94mi |
| 3331 Spring Ave Dallas, TX | 3.0 | 2.0 | 1652 | $2,200 | $1.33 | 24d | 1 | 0.94mi |
| 3308 Birmingham Ave Unit 11 Dallas, TX | 2.0 | 2.5 | 1505 | $2,375 | $1.58 | 43d | 1 | 0.95mi |
| 3308 Birmingham Ave Unit 6 Dallas, TX | 2.0 | 2.5 | 1341 | $2,175 | $1.62 | 16d | 1 | 0.95mi |
| 3308 Birmingham Ave Unit 7 Dallas, TX | 2.0 | 2.5 | 1287 | $2,125 | $1.65 | 15d | 1 | 0.95mi |
| 3308 Birmingham Ave Unit 1 Dallas, TX | 2.0 | 2.5 | 1451 | $2,275 | $1.57 | 24d | 1 | 0.95mi |
| 3308 Birmingham Ave Unit 03 Dallas, TX | 2.0 | 2.5 | 1451 | $2,275 | $1.57 | 43d | 1 | 0.95mi |
| 5000 Linder Ave Dallas, TX | 3.0 | 2.0 | 1327 | $1,950 | $1.47 | 43d | 1 | 0.96mi |
| 4503 Bradshaw St Dallas, TX | 4.0 | 2.0 | 1263 | $1,600 | $1.27 | 7d | 1 | 0.98mi |
| 4611 Bradshaw St Dallas, TX | 3.0 | 2.0 | 1145 | $1,550 | $1.35 | 24d | 1 | 1.02mi |
| 4722 Meadow St Dallas, TX | 2.0–3.0 | 2.0 | 1107 | $1,475 | $1.33 | 11d | 4 | 1.04mi |
| 3523 Herrling St Dallas, TX | 3.0 | 2.0 | 1525 | $1,800 | $1.18 | 16d | 1 | 1.06mi |
| 2246 Hooper St Dallas, TX | 3.0 | 3.0 | 1870 | $2,400 | $1.28 | 43d | 1 | 1.06mi |
| 2829 Oakdale St Dallas, TX | 3.0 | 2.0 | 1028 | $1,840 | $1.79 | 7d | 1 | 1.06mi |
| 2840 Oakdale St Dallas, TX | 3.0 | 2.0 | 1379 | $1,900 | $1.38 | 43d | 1 | 1.09mi |
| 2207 Anderson St Dallas, TX | 3.0 | 2.5 | 1419 | $2,300 | $1.62 | 7d | 1 | 1.11mi |
| 2203 Anderson St Dallas, TX | 3.0 | 2.5 | 1219 | $2,200 | $1.80 | 43d | 1 | 1.11mi |
| 2714 Hector St Dallas, TX | 3.0 | 2.0 | 1233 | $2,100 | $1.70 | 24d | 1 | 1.15mi |
Listing history 9 events
-
2026-05-06status Pending
-
2026-04-28historical Active Option Contract
-
2026-03-14price $188,500
-
2026-02-18price $209,000
-
2025-12-12$219,000 Active
-
2019-07-25soldstatus Sold 707-char remark
Show marketing remark (707 chars)
Cash Offer onlly...This traditional home with Strong Bones is waiting for you. Located in the Historic Queen City area. With a little updating, this Tudor style house offers the true mid-30's charm. Inviting porch welcomes you into warm living room. Flow on through formal dining, kitchen with dual sink, window and utility room. Stove purchased in May 2019 will remain. All bedrooms are on the separate hallway for privacy. Not like normal floorplans in the neighborhood, there are 2 full bathrooms and bonus huge familyroom that is perfect for movie time. Your imagination is the only limitation. Pricing reflects being SOLD AS IS, NO REPAIRS. Close to major freeways, schools, parks and Downtown Dallas.
-
2019-07-09status Pending 707-char remark
Show marketing remark (707 chars)
Cash Offer onlly...This traditional home with Strong Bones is waiting for you. Located in the Historic Queen City area. With a little updating, this Tudor style house offers the true mid-30's charm. Inviting porch welcomes you into warm living room. Flow on through formal dining, kitchen with dual sink, window and utility room. Stove purchased in May 2019 will remain. All bedrooms are on the separate hallway for privacy. Not like normal floorplans in the neighborhood, there are 2 full bathrooms and bonus huge familyroom that is perfect for movie time. Your imagination is the only limitation. Pricing reflects being SOLD AS IS, NO REPAIRS. Close to major freeways, schools, parks and Downtown Dallas.
-
2019-07-08historical Active Option Contract 707-char remark
Show marketing remark (707 chars)
Cash Offer onlly...This traditional home with Strong Bones is waiting for you. Located in the Historic Queen City area. With a little updating, this Tudor style house offers the true mid-30's charm. Inviting porch welcomes you into warm living room. Flow on through formal dining, kitchen with dual sink, window and utility room. Stove purchased in May 2019 will remain. All bedrooms are on the separate hallway for privacy. Not like normal floorplans in the neighborhood, there are 2 full bathrooms and bonus huge familyroom that is perfect for movie time. Your imagination is the only limitation. Pricing reflects being SOLD AS IS, NO REPAIRS. Close to major freeways, schools, parks and Downtown Dallas.
-
2019-06-19$85,000 Active 707-char remark
Show marketing remark (707 chars)
Cash Offer onlly...This traditional home with Strong Bones is waiting for you. Located in the Historic Queen City area. With a little updating, this Tudor style house offers the true mid-30's charm. Inviting porch welcomes you into warm living room. Flow on through formal dining, kitchen with dual sink, window and utility room. Stove purchased in May 2019 will remain. All bedrooms are on the separate hallway for privacy. Not like normal floorplans in the neighborhood, there are 2 full bathrooms and bonus huge familyroom that is perfect for movie time. Your imagination is the only limitation. Pricing reflects being SOLD AS IS, NO REPAIRS. Close to major freeways, schools, parks and Downtown Dallas.
ⓘ Source: listings_history table (triggers on properties + properties_extension) + one-shot
backfill from property_details.listing_events for pre-trigger history.
Tax reassessment forecast TX · Resets to sale price
- Current annual tax
- $2,980 · $248/mo
- Projected year-2 tax
- $3,450 · $287/mo
- Expected delta
- +$469/yr (+$39/mo · 15.7%)
ⓘ Screening estimate from a state-policy table — verify with the county assessor before closing.
Climate risk First Street
- Flood 1/10 Low FEMA zone X (unshaded) · 0% chance over 30 yrs
- Wildfire 1/10 Low
- Heat 7/10 Severe 7 d/yr ≥110°F today · 24 d/yr by 30 yrs out
- Wind 6/10 Major 27% chance of damaging wind over 30 yrs
- Air quality 3/10 Moderate 2 unhealthy d/yr today · 3 by 30 yrs out
Nearby sold comps map
Loading sold comps map…
Walkable amenities ~0.75 mi
Loading nearby amenities…
Taxation est. · year 1
- Rental income
- $23,887
- − Mortgage interest
- −$10,559
- − Property taxes
- −$2,980
- − Insurance
- −$942
- − Repairs & maintenance
- −$1,911
- − Management
- −$1,911
- − Depreciation
- −$5,484
- Taxable income
- $100
- Est. tax owed @ 24.0%
- −$24
- After-tax cash flow
- $3,062/yr
For passive investors: Depreciation is non-cash, so a rental often shows a tax loss while cash-flowing — sheltering income. Rental losses are passive: they offset passive income freely, and up to $25,000/yr can offset ordinary (W-2) income if you actively participate and your MAGI is under $100k (phasing out to $0 by $150k); unused losses carry forward. On sale, claimed depreciation is recaptured at up to 25%, and gains may owe capital-gains tax (a 1031 exchange can defer both). Figures are a year-1 estimate at your 24.0% rate — not tax advice; consult a CPA.
Schools (NCES district)
- District
- Dallas ISD
- NCES district ID
- 4816230
- Math proficiency
- 31% ▼ -16.00%
- Reading proficiency
- 36% ▼ -4.00%
- Median HH income
- $42,881
- Composite
- 28.41/100
- National rank
- #6763
- State rank
- #559 of 826 in TX
Livability — Dallas
- Score
- 81/100
- State rank
- #24
- US rank
- #1380
Category grades
Schools grade is shown separately in the Schools card above.
Census & demographics
- Census place
- Dallas, TX
- County
- Dallas County · 2,612,404 people
- City population
- 1,168,437
- Metro
- Dallas-Fort Worth-Arlington, TX
- Population (ZIP)
- 18,895
- Household income
- $45,557
- Rent vs Own
- Severe rent burden
- 1464.0
Population outlook (Dallas County) Hauer SSP2
- Today (2025)
- 2,979,839 people
- By 2030
- 3,191,823 · +7.1%
- By 2040
- 3,619,611 · +21.5%
- By 2050
- 4,026,915 · +35.1%
- By 2075
- 4,957,073 · +66.4%
- By 2100
- 5,508,725 · +84.9%
Race, ethnicity, and origin ACS 2023
- Neighborhood character
- Diverse neighborhood (Simpson 0.58)
- Race & ethnicity
- Black 59% Hispanic / Latino 25% White 11% Two or more races 10%
- Hispanic origin (detail)
- Mexican 21%
- Common ancestry
- Italian 1% Hispanic 1%
- Foreign-born
- 16% · Canada
- Languages at home
- 74% English-only · Spanish 26%
Political lean MEDSL · Dallas
- 2024 margin
- Strong D (+22.2) · D 60.2% · R 38.0% · Other 1.8%
- 2008→2024 swing
- +6.9pp toward D · 2008: 15.3pp · 2024: 22.2pp
- All cycles
- 2024: D+22.2 2020: D+31.6 2016: D+26.2 2012: D+15.4 2008: D+15.3
Not yet ingested
- Civics
- —
Market trends
- HPI YoY
- ▲ 0.79%
- Current HPI
- 224.2955
- Rent YoY
- ▲ 7.19%
- Metro
- Dallas-Fort Worth-Arlington, TX
- State GDP YoY
- ▲ 3.95%
- F500 in state
- 110
Industry mix (Fortune 500 HQ in TX)
| Industry | F500 HQs | Revenue |
|---|---|---|
| Energy | 16 | $1,198B |
|
||
| Technology | 5 | $198B |
|
||
| Engineering / Construction | 4 | $72B |
|
||
| Energy Services | 3 | $60B |
|
||
| Utilities | 3 | $41B |
|
||
| Healthcare | 2 | $330B |
|
||
Price history
+121.8% since first listed9 events — show timeline
- 2026-05-06 Pending — NTREIS
- 2026-04-28 Contingent — NTREIS
- 2026-03-14 Price Changed $188,500 NTREIS
- 2026-02-18 Price Changed $209,000 NTREIS
- 2025-12-12 Listed $219,000 NTREIS
- 2019-07-25 Sold (MLS) — NTREIS
- 2019-07-09 Pending — NTREIS
- 2019-07-08 Contingent — NTREIS
- 2019-06-19 Listed $85,000 NTREIS
Property tax history
+4.5%/yrLatest (2025): $2,980 · -14.5% YoY. Source: county tax records.
Cash-flow waterfall
monthlySold comps — $/sqft
last 12 mo · ≤1 miLoading sold comps…