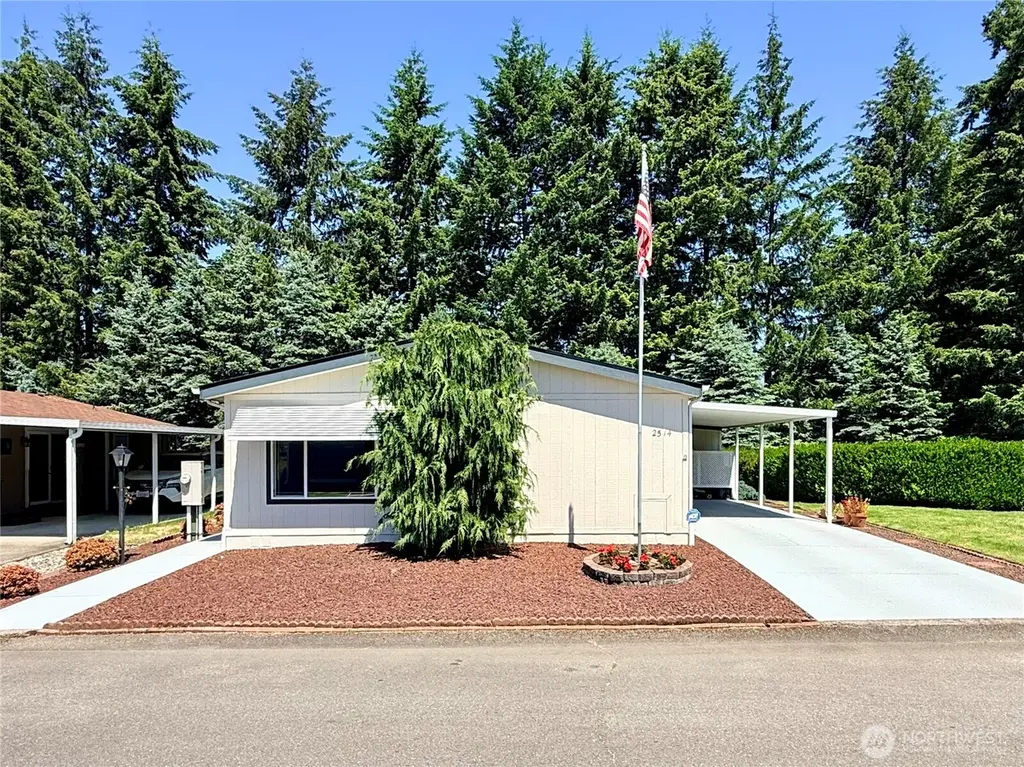
2514 Alonda Ln NE · Lacey, WA
Flood risk No data
- FEMA flood zone
- —
- Chance of flooding over 30 yrs
- —
- Est. flood insurance / yr
- —
Fire risk No data
- Est. fire insurance / yr
- —
Heat risk No data
- Hot days now (above threshold)
- —
- Hot days in 30 yrs
- —
Wind risk No data
- Chance of severe wind over 30 yrs
- —
Air-quality risk No data
- Unhealthy air days now
- —
- Unhealthy air days in 30 yrs
- —
Risk factors via First Street. Map © Google.
Why this score? — see what drove the B- grade
The composite is a weighted blend of 9 inputs, each scored 0–100. Each bar is that input's sub-score; the figure is the points it added to the 100-point composite (weight × sub-score).
- Cash flow +30.0/30.0
- DSCR +10.0/10.0
- 1% rule +9.8/10.0
- Schools +5.1/10.0
- Livability +4.2/5.0
- Rent growth +3.4/5.0
- Condition / age +2.5/5.0
- ARV discount +0.0/15.0
- Appreciation +0.0/10.0
$174,500
🖨 Deal sheet (PDF) 📄 Offer letter ✓ Due diligence
Listing remarks
Beautiful 3 Bedroom home in quiet 55+ Park! Features open concept, vaulted ceiling, new hardwood floors, & lots of windows for natural light. Galley kitchen shows great with custom cabinets, comfort height counters with plenty of counter space, nice eating area and pantry. All appliances included. Separate family room with new carpet, new paint, cellular blinds, and 3M window tint. Oversized primary bedroom with walk-in closet and 5-piece primary bathroom. New hot water tank. Heat pump/AC, sprinkler system, large storage building, and 2 patios for entertaining. Low maintenance yard, and backs up to beautiful trees. Home is light, bright & in immaculate condition! Close to shoppin
Key facts
- Pantry
- Custom cabinets
- Open concept
Tags
Property features AI
Finance
- Other: Public records list building area of 1,728; Double pane windows noted as energy efficient
- Financial info: Listing terms: Cash or Conventional
- HOA & community: Manufactured home park with clubhouse and common area; Alonda Villa park (approximately 129 homes); Senior community designation; Pets: see remarks; Land lease: $1,250
Exterior
- Parking: Carport; Uncovered parking
- Security: Security system
- Utilities: Electric energy source; Public water; Community septic; Electric water heater (located in primary bedroom walk-in closet); Puget Sound Energy for power; Xfinity cable and internet
- Home design: Manufactured double-wide home; One level; Entry and living/family/dining rooms included; Very good condition; Mobile home remains in place
- Construction: Wood construction; Wood skirt; Built-up and composition roofing; Pillar/post/pier foundation; Manufactured after 6/15/1976 (Baycrest)
- Exterior features: Wood exterior products; Paved lot; Storage at back of carport
Interior
- Kitchen: Dishwasher; Garbage disposal; Microwave; Refrigerator; Stove/Range
- Bedrooms: 3 bedrooms
- Flooring: Vinyl; Carpet
- Bathrooms: 1 full bath; 1 three-quarter bath; 1 bathtub; 2 showers
- Heating & cooling: Forced air heating; Heat pump; Central air
- Interior features: Water heater; Awnings; Bath off primary; Ceiling fans; Double-pane windows; Drapes; Landscaped; Patio/porch/deck; Security system; Skylights; Vaulted ceilings; Walk-in closet
- Laundry & utility: Washer; Dryer; Utility room
Neighborhood map
What this means for you Summary
Snapshot
- This is a 3-bed/2.0-bath manufactured listed at $174k.
Deal economics
- At list price, monthly cash flow is $921 ($11k/yr) — positive.
- The deal already cash-flows at list — no discount required.
- Meets the 1% rule at list price ($3k rent vs $174k).
- Recommended offer: $172k (1.5% below list) — sets the bar for market timing.
- Cap rate 12.6% vs local median 3.0% in Lacey — top-decile yield for the area; either an underpriced asset or a hidden risk that comps aren't pricing in. Stress-test before assuming the spread holds.
Location & tenants
- Location reads 85/100 on livability (#33 in WA, #581 nationally) — a professional / high-income tenant draw. Strengths: amenities A+, commute A+, housing A+; Watch: cost of living D+.
- North Thurston Public Schools (suburban): math 51% / reading 62% proficiency, ranked #80 of 291 in WA (top 28%) — acceptable for families but not a draw, mixed tenant base, ~2y average lease.
- Zoned schools: South Bay Elementary (588 students, 40% FRL); Chinook Middle School (788 students, 54% FRL); North Thurston High School (1,440 students, 47% FRL) — zoned schools average 47% FRL vs 31% district-wide (16 pts higher); higher-poverty schools than district average — tighter screening recommended.
- Market conditions: Rents rising (+3.8%/yr); 218 active listings in the ZIP; 10 comparable units currently listed for rent nearby; rentals at typical pace (median 23d on market — plan ~3-4 weeks tenant-placement turnaround); 40% of comp listings sitting > 30 days — soft ceiling on asking rent; solid renter incomes; 1,222 units permitted in Thurston County in 2024 (508 in 5+ unit buildings).
- This rent runs 31% of the median local income ($99k/yr) — at the standard rent-burdened threshold; future hikes will face affordability resistance.
Forward outlook
- Local home prices are declining (-3.0%/yr); year-one equity from $1k of loan paydown is wiped out by about $5k of value loss. Plan a longer hold.
- Thurston County population projected at +27% by 2050 — long-run rental-demand tailwind backs the buy-and-hold thesis.
- At projected returns (-3.0% appreciation + 3.8% rent growth), your $49k cash investment doubles in ~6 years — after that, you're playing with house money.
Negotiation context
- It's been on market 15 days — a 2% lower offer ($172k) is reasonable based on typical stale-listing flexibility.
- 5 sale attempts since 23y ago; this cycle's ask has dropped $10k (5%) from the opening price — seller is motivated, your offer sets the floor, not the list.
Questions for the listing agent
- Is there a deadline driving the sale (1031 exchange, divorce, estate, relocation)? That informs how much negotiation room exists.
- Schools are B-rated — typically a magnet for longer-tenancy family renters. What's the average tenant stay here, and is there a school-zone premium baked into asking?
- What's the average days-on-market for RENTAL listings here right now (not sales)? A rising rental-DOM trend means longer vacancies and softer asking-rent achievability than the comps imply.
- What's the recent tenant-quality profile in this submarket — average credit score on applications, eviction rate, late-payment / NSF rate, and stable-employment percentage? A property-management company in the area should have these aggregated.
- How much new for-sale + rental construction is in the pipeline within 1–3 miles? Heavy new supply typically softens prices + rents 12–24 months out; constrained supply supports both.
Investment metrics
- 1% rule
- 1.48% ✓
- Cap rate
- 12.62%
- Cash-on-cash
- 22.61%
- DSCR
- 2.01
- GRM
- 5.6
CMA / ARV
- ARV (on-the-fly)
- $139,968
- Comps found
- 4
Show comp detail 4 sales within ~0.75 mi
| Address | Dist | Beds/Ba | Sqft | Sold | Price | $/sf | Match |
|---|---|---|---|---|---|---|---|
| 2504 Alonda Ln NE | 0.05mi | 3/2.0 | 1,680 (-3%) | 2mo | $114,900 | $68 | 91 |
| 2516 Alonda Ln NE #2516 | 0.02mi | 3/2.0 | 1,568 (-9%) | 7mo | $135,250 | $86 | 78 |
| 2015 Alonda Ln NE | 0.08mi | 3/2.0 | 1,792 (+4%) | 17mo | $145,000 | $81 | 76 |
| 2203 Alonda Ln NE | 0.05mi | 2/2.0 (-1) | 1,536 (-11%) | 5mo | $95,000 | $62 | 70 |
Match score weights: distance 35% · size 25% · config 20% · recency 20%. Top-matched comps best support the ARV.
Projected returns pro-forma
-3.0% appreciation · 3.75% rent growth · sell at horizon
- IRR
- 16.3%
- Equity multiple
- 1.66×
- Total profit
- $32,311
- Equity at exit
- $26,019
- IRR
- 25.4%
- Equity multiple
- 3.29×
- Total profit
- $111,757
- Equity at exit
- $15,088
Cash invested: $48,860 (down + closing). Projections, not guarantees.
Landlord ↔ Tenant lean methodology
- Overall (STATE)
- 28 Tenant-Leaning
- State Washington
- 28 Tenant-Leaning · D+8
- County
- — inherits STATE
- City
- — inherits STATE
ZIP-level market 98516
- Rents YoY
- 3.8%
- Active inventory
- 218
- Price-to-rent
- 5.6×
Monthly cashflow live
- Estimated rent
- $2,580 high interval (Pro) →
- Mortgage (P&I)
- −$915
- Tax from tax record
- −$130 /mo · $1,558/yr
- Insurance
- −$73
- HOA
- −$0
- Vacancy / Maint / Mgmt
- −$542
- Net cashflow
- $921
Break-even live
Sensitivity live
| Price | -10% $1,020 | -5% $970 | +0% $921 | +5% $871 | +10% $822 |
|---|---|---|---|---|---|
| Rent | -10% $717 | -5% $819 | +0% $921 | +5% $1,023 | +10% $1,125 |
| Rate | -1.0pp $1,009 | -0.5pp $965 | base $921 | +0.5pp $876 | +1.0pp $830 |
UW: 25.0% down · 7.5% · 30yr · 1.5% tax · 5.0% vac · 8.0% maint · 8.0% mgmt
Financing live
Cash to close
- Down payment
- $43,625
- Closing costs
- $5,235
- Reserves months
- —
- Total cash needed
- —
Loan-product check · same deal, 3 products live
Conventional
25% down · 7.5% · 30yr
- Down + closing
- —
- Monthly P&I
- —
- Monthly cashflow
- —
- DSCR
- —
- Eligible?
- —
Personal DTI + credit; lowest rate.
DSCR
20% down · 8.5% · 30yr
- Down + closing
- —
- Monthly P&I
- —
- Monthly cashflow
- —
- DSCR
- —
- Eligible?
- —
No personal income docs; deal must DSCR.
Hard money
10% down · 12.0% · 12mo
- Down + closing
- —
- Monthly P&I
- —
- Monthly cashflow
- —
- DSCR
- —
- Eligible?
- —
Short-term bridge; refi at stabilization.
Rent comps 10 comps
| Address | Beds | Baths | Sqft | Rent | $/sqft | DOM | Units | Dist |
|---|---|---|---|---|---|---|---|---|
| 927 College Ln NE Unit A Lacey, WA | 3.0 | 2.5 | 1390 | $2,300 | $1.65 | 45d | 1 | 0.30mi |
| 925 Bradley St NE Olympia, WA | 3.0 | 2.0 | 1403 | $2,650 | $1.89 | 45d | 1 | 0.41mi |
| 5224 15th Ave NE Olympia, WA | 1.0–3.0 | 1.0–2.0 | 881 | $2,630 | $2.99 | 15d | 258 | 0.47mi |
| 808 Taylor Ln NE Lacey, WA | 2.0 | 2.5 | 1740 | $2,195 | $1.26 | 22d | 1 | 0.57mi |
| 5499 15th Ave NE Lacey, WA | 1.0–3.0 | 1.0–2.0 | 904 | $2,535 | $2.80 | 15d | 26 | 0.64mi |
| 1848 Mapleview Ct NE Olympia, WA | 3.0 | 2.0 | 1489 | $3,000 | $2.01 | 45d | 1 | 0.73mi |
| 3719 22nd Ave NE Olympia, WA | 4.0 | 2.5 | 2100 | $3,095 | $1.47 | 45d | 1 | 0.76mi |
| 606 Lilly Rd NE Olympia, WA | 1.0–2.0 | 1.0–2.0 | 966 | $2,725 | $2.82 | 15d | 7 | 0.88mi |
| 2400 Lilly Rd NE Olympia, WA | 3.0 | 2.5 | 1904 | $2,795 | $1.47 | 15d | 3 | 0.98mi |
| 4410 6th Ave SE Lacey, WA | 1.0–3.0 | 1.0–2.0 | 980 | $2,425 | $2.47 | 15d | 14 | 1.19mi |
Listing history 13 events
-
2026-06-21days on market $174,500 Active 15 DOM
-
2026-06-19status $174,500 Active 12 DOM
-
2026-06-13status $174,500 Pending 12 DOM
-
2026-06-10days on market $174,500 Active 12 DOM
-
2026-06-09days on market $174,500 Active 11 DOM
-
2026-06-08days on market $174,500 Active 10 DOM
-
2026-06-07days on market $174,500 Active 9 DOM
-
2026-06-03days on market $174,500 Active 5 DOM
-
2026-06-02days on market $174,500 Active 4 DOM
-
2026-06-01days on market $174,500 Active 3 DOM
-
2026-05-31pricedays on market $174,500 Active 2 DOM
-
2026-05-30remarks 691-char remark
-
2026-05-30$184,500 Active 1 DOM
ⓘ Source: listings_history table (triggers on properties + properties_extension) + one-shot
backfill from property_details.listing_events for pre-trigger history.
Tax reassessment forecast WA · Resets to sale price
- Current annual tax
- $1,558 · $130/mo
- Projected year-2 tax
- $1,710 · $143/mo
- Expected delta
- +$152/yr (+$13/mo · 9.8%)
ⓘ Screening estimate from a state-policy table — verify with the county assessor before closing.
Nearby sold comps map
Loading sold comps map…
Walkable amenities ~0.75 mi
Loading nearby amenities…
Taxation est. · year 1
- Rental income
- $30,963
- − Mortgage interest
- −$9,775
- − Property taxes
- −$1,558
- − Insurance
- −$872
- − Repairs & maintenance
- −$2,477
- − Management
- −$2,477
- − Depreciation
- −$5,076
- Taxable income
- $8,727
- Est. tax owed @ 24.0%
- −$2,094
- After-tax cash flow
- $8,954/yr
For passive investors: Depreciation is non-cash, so a rental often shows a tax loss while cash-flowing — sheltering income. Rental losses are passive: they offset passive income freely, and up to $25,000/yr can offset ordinary (W-2) income if you actively participate and your MAGI is under $100k (phasing out to $0 by $150k); unused losses carry forward. On sale, claimed depreciation is recaptured at up to 25%, and gains may owe capital-gains tax (a 1031 exchange can defer both). Figures are a year-1 estimate at your 24.0% rate — not tax advice; consult a CPA.
Schools (NCES district)
- District
- North Thurston Public Schools
- NCES district ID
- 5305850
- Math proficiency
- 51% ▬ 0.00%
- Reading proficiency
- 62% ▬ 0.00%
- Median HH income
- $62,338
- Composite
- 51.09/100
- National rank
- #3798
- State rank
- #80 of 291 in WA
Livability — Lacey
- Score
- 85/100
- State rank
- #33
- US rank
- #581
Category grades
Schools grade is shown separately in the Schools card above.
Census & demographics
- County
- Thurston County · 269,345 people
- City population
- 108,850
- Metro
- Olympia-Lacey-Tumwater, WA
- Population (ZIP)
- 29,177
- Household income
- $98,892
- Rent vs Own
- Severe rent burden
- 1202.0
Population outlook (Thurston County) Hauer SSP2
- Today (2025)
- 308,239 people
- By 2030
- 326,483 · +5.9%
- By 2040
- 359,890 · +16.8%
- By 2050
- 391,800 · +27.1%
- By 2075
- 468,024 · +51.8%
- By 2100
- 519,890 · +68.7%
Race, ethnicity, and origin ACS 2023
- Neighborhood character
- Diverse neighborhood (Simpson 0.58)
- Race & ethnicity
- White 62% Two or more races 14% Asian 11% Hispanic / Latino 10% Black 4% Pacific Islander 1%
- Hispanic origin (detail)
- Mexican 6%
- Common ancestry
- Portuguese 3% Lithuanian 2% Iranian 2%
- Foreign-born
- 14% · Canada, Vietnam, South Korea
- Languages at home
- 81% English-only · Spanish 7% Other Asian/Pacific 3% Tagalog/Filipino 2%
Political lean MEDSL · Thurston
- 2024 margin
- Strong D (+20.4) · D 58.5% · R 38.1% · Other 3.5%
- 2008→2024 swing
- -1.3pp toward R · 2008: 21.7pp · 2024: 20.4pp
- All cycles
- 2024: D+20.4 2020: D+18.6 2016: D+15.4 2012: D+19.0 2008: D+21.7
Not yet ingested
- Civics
- —
Market trends
- HPI YoY
- ▼ -203.16%
- Current HPI
- 323.7121
- Rent YoY
- ▲ 3.75%
- Metro
- Olympia-Lacey-Tumwater, WA
- State GDP YoY
- ▲ 4.65%
- F500 in state
- 22
Industry mix (Fortune 500 HQ in WA)
| Industry | F500 HQs | Revenue |
|---|---|---|
| Retail | 2 | $269B |
|
||
| Technology / Retail | 1 | $638B |
|
||
| Technology | 1 | $245B |
|
||
| Telecommunications | 1 | $38B |
|
||
| Food / Beverage | 1 | $36B |
|
||
| Automotive / Trucks | 1 | $34B |
|
||
Price history
+191.3% since first listed11 events — show timeline
- 2026-05-30 Price Changed $174,500 NWMLS as Distributed by MLS Grid
- 2026-05-29 Relisted — NWMLS as Distributed by MLS Grid
- 2026-05-28 Listed $184,500 NWMLS as Distributed by MLS Grid
- 2024-06-06 Sold (MLS) $175,000 NWMLS as Distributed by MLS Grid
- 2024-04-21 Pending — NWMLS as Distributed by MLS Grid
- 2024-04-19 Listed $174,500 NWMLS as Distributed by MLS Grid
- 2022-09-16 Sold (MLS) $149,500 NWMLS as Distributed by MLS Grid
- 2022-08-14 Pending — NWMLS as Distributed by MLS Grid
- 2022-08-04 Listed $149,500 NWMLS as Distributed by MLS Grid
- 2003-09-10 Sold (MLS) $55,000 NWMLS as Distributed by MLS Grid
- 2003-08-05 Listed $59,900 NWMLS as Distributed by MLS Grid
Property tax history
+6.3%/yrLatest (2026): $1,558 · +9.7% YoY. Source: county tax records.
Cash-flow waterfall
monthlySold comps — $/sqft
last 12 mo · ≤1 miLoading sold comps…