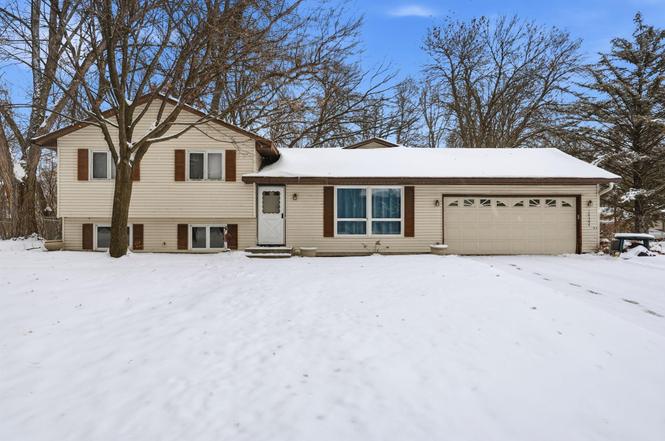
10304 107th Pl N · Maple Grove, MN
Flood risk 1/10 · Minimal
- FEMA flood zone
- X (unshaded)
- Chance of flooding over 30 yrs
- 0.0%
- Est. flood insurance / yr
- $473 – $860
Fire risk 1/10 · Minimal
- Est. fire insurance / yr
- $888 – $1,650
Heat risk 2/10 · Minimal
- Hot days now (above 100°F)
- 7 days/yr
- Hot days in 30 yrs
- 13 days/yr
Wind risk 2/10 · Minimal
- Chance of severe wind over 30 yrs
- —
Air-quality risk 2/10 · Minimal
- Unhealthy air days now
- 1 days/yr
- Unhealthy air days in 30 yrs
- 2 days/yr
Risk factors via First Street. Map © Google.
Why this score? — see what drove the C- grade
The composite is a weighted blend of 9 inputs, each scored 0–100. Each bar is that input's sub-score; the figure is the points it added to the 100-point composite (weight × sub-score).
- ARV discount +15.0/15.0
- Cash flow +13.6/30.0
- Schools +4.2/10.0
- DSCR +4.1/10.0
- 1% rule +4.0/10.0
- Livability +4.0/5.0
- Rent growth +3.1/5.0
- Condition / age +2.5/5.0
- Appreciation +0.0/10.0
$295,000
🖨 Deal sheet (PDF) 📄 Offer letter ✓ Due diligence
Listing remarks
Welcome to this well located three level split offering comfort, space, and opportunity. Situated in a prime area close to parks, shopping, dining, and convenient commuting routes, this home checks all the boxes for everyday living. The main level features a spacious living room highlighted by a cozy gas fireplace and walkout access to the deck and expansive backyard; perfect for relaxing or hosting gatherings. Upstairs, you’ll find three generously sized bedrooms. The lower level family room includes a bar area, making it an ideal space for entertaining or movie nights. Additional highlights include main floor laundry and a roof replaced 5 years ago. This home is ready for your perso
Key facts
- Gas fireplace
- Main floor laundry
- Bar area
Tags
Neighborhood map
What this means for you Summary
Snapshot
- This is a 3-bed/1.0-bath single-family listed at $295k.
Deal economics
- At list price, monthly cash flow is $16 ($189/yr) — positive.
- The deal already cash-flows at list — no discount required.
- To meet the 1% rule (rent ≥ 1% of price), the offer needs to be $265k (10.1% below list).
- Recommended offer: $265k (10.1% below list) — sets the bar for 1% rule.
- Cap rate 6.4% vs local median 3.4% in Maple Grove — top-decile yield for the area; either an underpriced asset or a hidden risk that comps aren't pricing in. Stress-test before assuming the spread holds.
Location & tenants
- Location reads 81/100 on livability (#54 in MN, #1,353 nationally) — a professional / high-income tenant draw. Strengths: commute A+, employment A+, housing A+; Watch: amenities D, cost of living D.
- Osseo Public School District (suburban): math 42% / reading 51% proficiency, ranked #129 of 301 in MN (top 43%) — families likely to look elsewhere, expect single-tenant / working-renter base with shorter leases.
- Zoned schools: Elm Creek Elementary (math 52% / reading 47%, grade D, #423 of 857 statewide, top 55%, 521 students, 41% FRL); Osseo Middle School (math 42% / reading 52%, grade D+, #97 of 258 statewide, top 39%, 1,155 students, 41% FRL); Osseo Senior High (math 26% / reading 58%, grade F, #222 of 471 statewide, top 50%, 2,280 students, 55% FRL).
- Market conditions: Rents rising (+2.3%/yr); 387 active listings in the ZIP; 1 comparable units currently listed for rent nearby; high-income renter base; 4,651 units permitted in Hennepin County in 2024 (2,443 in 5+ unit buildings).
Forward outlook
- Local home prices are declining (-3.0%/yr); year-one equity from $2k of loan paydown is wiped out by about $9k of value loss. Plan a longer hold.
- Hennepin County population projected at +30% by 2050 — long-run rental-demand tailwind backs the buy-and-hold thesis.
Negotiation context
- It's been on market 37 days — a 3% lower offer ($286k) is reasonable based on typical stale-listing flexibility.
- 2 sale attempts; this cycle's ask has dropped $65k (18%) from the opening price — seller is motivated, your offer sets the floor, not the list.
- Current owner paid $62k; list at $295k implies a 372% gain — meaningful room to come down on a strong offer.
Questions for the listing agent
- It's been on market 37 days. Have you received any prior offers? Is the seller open to a 10% concession, seller financing, or rate buy-down credit?
- Built in 1979 — when were the roof, HVAC, electrical panel, plumbing, and water heater last replaced?
- Is there a deadline driving the sale (1031 exchange, divorce, estate, relocation)? That informs how much negotiation room exists.
- Schools are A-rated — typically a magnet for longer-tenancy family renters. What's the average tenant stay here, and is there a school-zone premium baked into asking?
- What's the average days-on-market for RENTAL listings here right now (not sales)? A rising rental-DOM trend means longer vacancies and softer asking-rent achievability than the comps imply.
- What's the recent tenant-quality profile in this submarket — average credit score on applications, eviction rate, late-payment / NSF rate, and stable-employment percentage? A property-management company in the area should have these aggregated.
- How much new for-sale + rental construction is in the pipeline within 1–3 miles? Heavy new supply typically softens prices + rents 12–24 months out; constrained supply supports both.
Investment metrics
- 1% rule
- 0.90% ✗
- Cap rate
- 6.36%
- Cash-on-cash
- 0.23%
- DSCR
- 1.01
- GRM
- 9.3
CMA / ARV
- ARV (on-the-fly)
- $406,432
- Comps found
- 3
Show comp detail 3 sales within ~0.75 mi
| Address | Dist | Beds/Ba | Sqft | Sold | Price | $/sf | Match |
|---|---|---|---|---|---|---|---|
| 10698 Boundary Creek Ter | 0.21mi | 4/2.0 (+1) | 1,803 (-8%) | 16mo | $375,000 | $208 | 55 |
| 10013 Hidden Oaks Ln N | 0.43mi | 3/3.0 | 2,107 (+8%) | 12mo | $468,000 | $222 | 49 |
| 11140 Gettysburg Ave N | 0.73mi | 3/2.0 | 2,088 (+7%) | 21mo | $340,000 | $163 | 33 |
Match score weights: distance 35% · size 25% · config 20% · recency 20%. Top-matched comps best support the ARV.
Projected returns pro-forma
-3.0% appreciation · 2.26% rent growth · sell at horizon
- IRR
- -16.8%
- Equity multiple
- 0.41×
- Total profit
- $-48,697
- Equity at exit
- $43,985
- IRR
- -10.0%
- Equity multiple
- 0.41×
- Total profit
- $-48,776
- Equity at exit
- $25,506
Cash invested: $82,600 (down + closing). Projections, not guarantees.
Landlord ↔ Tenant lean methodology
- Overall (STATE)
- 46 Balanced
- State Minnesota
- 46 Balanced · D+2
- County
- — inherits STATE
- City
- — inherits STATE
ZIP-level market 55369
- Rents YoY
- 2.3%
- Active inventory
- 387
- Price-to-rent
- 9.3×
Monthly cashflow live
- Estimated rent
- $2,653 medium interval (Pro) →
- Mortgage (P&I)
- −$1,547
- Tax from tax record
- −$410 /mo · $4,923/yr
- Insurance
- −$123
- HOA
- −$0
- Vacancy / Maint / Mgmt
- −$557
- Net cashflow
- $16
Break-even live
Sensitivity live
| Price | -10% $183 | -5% $99 | +0% $16 | +5% $-68 | +10% $-151 |
|---|---|---|---|---|---|
| Rent | -10% $-194 | -5% $-89 | +0% $16 | +5% $121 | +10% $225 |
| Rate | -1.0pp $164 | -0.5pp $91 | base $16 | +0.5pp $-61 | +1.0pp $-138 |
UW: 25.0% down · 7.5% · 30yr · 1.5% tax · 5.0% vac · 8.0% maint · 8.0% mgmt
Financing live
Cash to close
- Down payment
- $73,750
- Closing costs
- $8,850
- Reserves months
- —
- Total cash needed
- —
Loan-product check · same deal, 3 products live
Conventional
25% down · 7.5% · 30yr
- Down + closing
- —
- Monthly P&I
- —
- Monthly cashflow
- —
- DSCR
- —
- Eligible?
- —
Personal DTI + credit; lowest rate.
DSCR
20% down · 8.5% · 30yr
- Down + closing
- —
- Monthly P&I
- —
- Monthly cashflow
- —
- DSCR
- —
- Eligible?
- —
No personal income docs; deal must DSCR.
Hard money
10% down · 12.0% · 12mo
- Down + closing
- —
- Monthly P&I
- —
- Monthly cashflow
- —
- DSCR
- —
- Eligible?
- —
Short-term bridge; refi at stabilization.
Rent comps 1 comps
| Address | Beds | Baths | Sqft | Rent | $/sqft | DOM | Units | Dist |
|---|---|---|---|---|---|---|---|---|
| 10414 Valley Forge Ln N Maple Grove, MN | 4.0 | 2.0 | 2487 | $3,300 | $1.33 | 21d | 1 | 0.49mi |
Listing history 9 events
-
2026-02-11status Pending
-
2026-02-05historical Contingent - Inspection
-
2026-01-29status Active
-
2026-01-23price $295,000
-
2026-01-22historical Contingent - Inspection
-
2026-01-15price $325,000
-
2026-01-13price $339,900
-
2026-01-05$360,000 Active
-
1979-03-01soldstatus $62,500
ⓘ Source: listings_history table (triggers on properties + properties_extension) + one-shot
backfill from property_details.listing_events for pre-trigger history.
Tax reassessment forecast MN · Partial reset (capped growth)
- Current annual tax
- $4,923 · $410/mo
- Projected year-2 tax
- $4,923 · $410/mo
- Expected delta
- $0/yr ($0/mo · 0.0%)
ⓘ Screening estimate from a state-policy table — verify with the county assessor before closing.
Climate risk First Street
- Flood 1/10 Low FEMA zone X (unshaded) · 0% chance over 30 yrs
- Wildfire 1/10 Low
- Heat 2/10 Low 7 d/yr ≥100°F today · 13 d/yr by 30 yrs out
- Wind 2/10 Low
- Air quality 2/10 Low 1 unhealthy d/yr today · 2 by 30 yrs out
Nearby sold comps map
Loading sold comps map…
Walkable amenities ~0.75 mi
Loading nearby amenities…
Taxation est. · year 1
- Rental income
- $31,837
- − Mortgage interest
- −$16,525
- − Property taxes
- −$4,923
- − Insurance
- −$1,475
- − Repairs & maintenance
- −$2,547
- − Management
- −$2,547
- − Depreciation
- −$8,582
- Taxable loss
- −$4,762
- Est. tax savings @ 24.0%
- +$1,143
- After-tax cash flow
- $1,331/yr
For passive investors: Depreciation is non-cash, so a rental often shows a tax loss while cash-flowing — sheltering income. Rental losses are passive: they offset passive income freely, and up to $25,000/yr can offset ordinary (W-2) income if you actively participate and your MAGI is under $100k (phasing out to $0 by $150k); unused losses carry forward. On sale, claimed depreciation is recaptured at up to 25%, and gains may owe capital-gains tax (a 1031 exchange can defer both). Figures are a year-1 estimate at your 24.0% rate — not tax advice; consult a CPA.
Schools (NCES district)
- District
- Osseo Public School District
- NCES district ID
- 2725200
- Math proficiency
- 42% ▼ -7.00%
- Reading proficiency
- 51% ▼ -4.00%
- Median HH income
- $76,168
- Composite
- 42.35/100
- National rank
- #3250
- State rank
- #129 of 301 in MN
Livability — Maple Grove
- Score
- 81/100
- State rank
- #54
- US rank
- #1353
Category grades
Schools grade is shown separately in the Schools card above.
Census & demographics
- Census place
- Maple Grove, MN
- County
- Hennepin County · 1,150,272 people
- City population
- 77,762
- Metro
- Minneapolis-St. Paul-Bloomington, MN-WI
- Population (ZIP)
- 39,290
- Household income
- $112,144
- Rent vs Own
- Severe rent burden
- 718.0
Population outlook (Hennepin County) Hauer SSP2
- Today (2025)
- 1,405,227 people
- By 2030
- 1,492,650 · +6.2%
- By 2040
- 1,660,157 · +18.1%
- By 2050
- 1,823,498 · +29.8%
- By 2075
- 2,221,283 · +58.1%
- By 2100
- 2,509,976 · +78.6%
Race, ethnicity, and origin ACS 2023
- Neighborhood character
- Predominantly White (76%)
- Race & ethnicity
- White 76% Two or more races 7% Black 6% Asian 6% Hispanic / Latino 6%
- Hispanic origin (detail)
- Mexican 3%
- Common ancestry
- Portuguese 10% Romanian 6% Lithuanian 3%
- Foreign-born
- 11% · Canada, China, Vietnam
- Languages at home
- 86% English-only · Spanish 5% Other Asian/Pacific 2% Chinese 1%
Political lean MEDSL · Hennepin
- 2024 margin
- Solid D (+42.6) · D 70.2% · R 27.5% · Other 2.3%
- 2008→2024 swing
- +14.0pp toward D · 2008: 28.6pp · 2024: 42.6pp
- All cycles
- 2024: D+42.6 2020: D+43.2 2016: D+35.3 2012: D+27.1 2008: D+28.6
Not yet ingested
- Civics
- —
Market trends
- HPI YoY
- ▼ -313.16%
- Current HPI
- 233.7627
- Rent YoY
- ▲ 2.26%
- Metro
- Minneapolis-St. Paul-Bloomington, MN-WI
- State GDP YoY
- ▲ 2.41%
- F500 in state
- 34
Industry mix (Fortune 500 HQ in MN)
| Industry | F500 HQs | Revenue |
|---|---|---|
| Healthcare | 2 | $407B |
|
||
| Retail | 2 | $150B |
|
||
| Consumer Goods | 2 | $32B |
|
||
| Industrial Machinery | 2 | $6B |
|
||
| Agriculture | 1 | $40B |
|
||
| Healthcare / Medical Devices | 1 | $32B |
|
||
Price history
+372.0% since first listed9 events — show timeline
- 2026-02-11 Pending — NORTHSTARMLS as Distributed by MLS Grid
- 2026-02-05 Contingent — NORTHSTARMLS as Distributed by MLS Grid
- 2026-01-29 Relisted — NORTHSTARMLS as Distributed by MLS Grid
- 2026-01-23 Price Changed $295,000 NORTHSTARMLS as Distributed by MLS Grid
- 2026-01-22 Contingent — NORTHSTARMLS as Distributed by MLS Grid
- 2026-01-15 Price Changed $325,000 NORTHSTARMLS as Distributed by MLS Grid
- 2026-01-13 Price Changed $339,900 NORTHSTARMLS as Distributed by MLS Grid
- 2026-01-05 Listed $360,000 NORTHSTARMLS as Distributed by MLS Grid
- 1979-03-01 Sold (Public Records) $62,500 Public Records
Property tax history
+2.7%/yrLatest (2025): $4,923 · -0.2% YoY. Source: county tax records.
Cash-flow waterfall
monthlySold comps — $/sqft
last 12 mo · ≤1 miLoading sold comps…