4300 Bay Point Rd #439 · Upper Grand Lagoon, FL
Flood risk 6/10 · Moderate
- FEMA flood zone
- X (unshaded)
- Chance of flooding over 30 yrs
- 0.59%
- Est. flood insurance / yr
- $507 – $1,088
Fire risk 1/10 · Minimal
- Est. fire insurance / yr
- $947 – $1,759
Heat risk 10/10 · Severe
- Hot days now (above 106°F)
- 7 days/yr
- Hot days in 30 yrs
- 22 days/yr
Wind risk 10/10 · Severe
- Chance of severe wind over 30 yrs
- 99.0%
Air-quality risk 1/10 · Minimal
- Unhealthy air days now
- 0 days/yr
- Unhealthy air days in 30 yrs
- 0 days/yr
Risk factors via First Street. Map © Google.
Why this score? — see what drove the C grade
The composite is a weighted blend of 9 inputs, each scored 0–100. Each bar is that input's sub-score; the figure is the points it added to the 100-point composite (weight × sub-score).
- Cash flow +24.9/30.0
- DSCR +8.1/10.0
- ARV discount +7.5/15.0
- 1% rule +5.8/10.0
- Schools +4.3/10.0
- Livability +3.4/5.0
- Rent growth +3.1/5.0
- Condition / age +2.5/5.0
- Appreciation +0.0/10.0
$269,000
🖨 Deal sheet (PDF) 📄 Offer letter ✓ Due diligence
Listing remarks
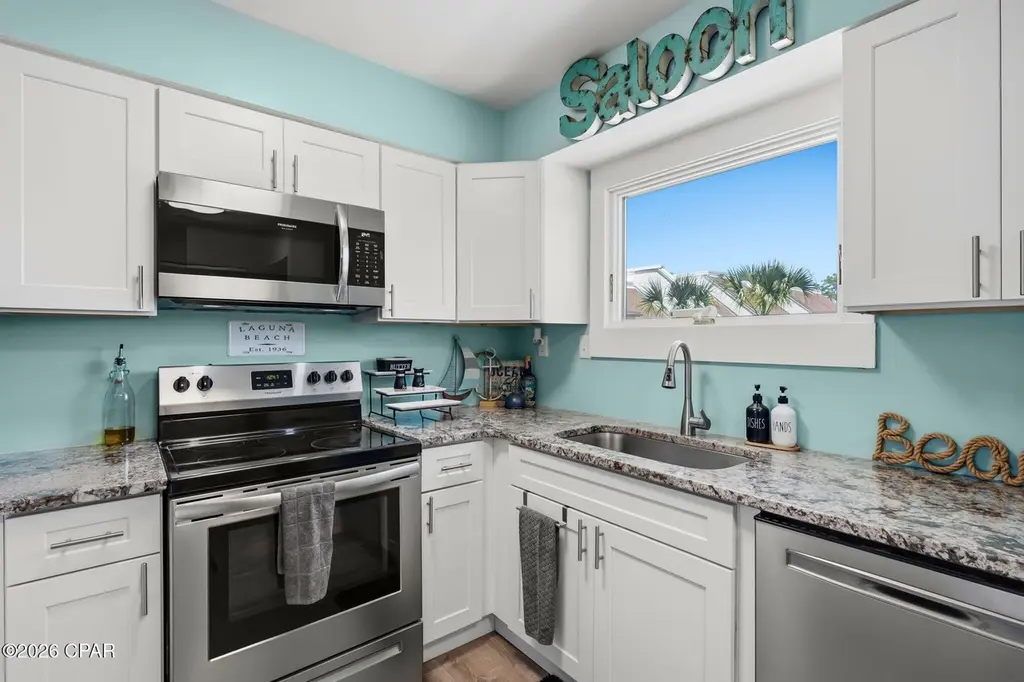
If you've been searching for a lifestyle-driven community with exceptional amenities, this is your opportunity. Nestled within a gated, golf cart-friendly neighborhood, residents enjoy access to a full-service marina, a premier four-star golf course, and a vibrant calendar of social activities--all designed to elevate everyday living. This beautifully appointed second-floor condo features 2 bedrooms and 2 bathrooms, offering both comfort and privacy within the highly sought-after Bay Point Golf Villas. A versatile den provides the option to easily convert into a third bedroom, adding flexibility to suit your needs. Surrounded by serene, lush surroundings, the elevated location enhances the
Key facts
- Gated neighborhood
- Second floor condo
- Versatile den
Tags
Property features AI
Finance
- HOA & community: Homeowners association; Community amenities: fishing, golf, marina, gated
Exterior
- Parking: Additional parking and parking lot
- Security: Gated with guard; Twenty-four hour security
- Utilities: Electricity available
- Home design: Single-family residential zoning; Stucco exterior
- Construction: Shingle roof; Stucco construction
- Exterior features: Private road frontage; Gated community with guard and 24-hour security; Fishing, golf, marina access in community; Short-term rentals allowed
Interior
- Bedrooms: Bedroom on second level (approximately 13 x 12 ft); Primary bedroom on second level (approximately 16 x 12 ft)
- Bathrooms: 2 full bathrooms
- Heating & cooling: Central heating (electric); Central air conditioning
- Interior features: Balcony
Neighborhood map
What this means for you Summary
Snapshot
- This is a 2-bed/2.0-bath condo listed at $269k.
Deal economics
- At list price, monthly cash flow is $574 ($7k/yr) — positive.
- The deal already cash-flows at list — no discount required.
- Meets the 1% rule at list price ($3k rent vs $269k).
- Cap rate 8.9% vs local median 3.2% in Upper Grand Lagoon — top-decile yield for the area; either an underpriced asset or a hidden risk that comps aren't pricing in. Stress-test before assuming the spread holds.
Location & tenants
- Location reads 67/100 on livability (#583 in FL) — a middle-class / working-renter tenant base. Strengths: housing A+, crime A, cost of living B+; Watch: amenities F, commute F, health & safety F.
- Bay (suburban): math 51% / reading 51% proficiency, ranked #29 of 73 in FL (top 40%) — acceptable for families but not a draw, mixed tenant base, ~2y average lease.
- Zoned schools: Patronis Elementary School (math 70% / reading 70%, grade A-, #345 of 2,144 statewide, top 17%, 648 students, 42% FRL); Surfside Middle School (math 58% / reading 59%, grade B, #148 of 571 statewide, top 26%, 843 students, 48% FRL); J.R. Arnold High School (math 41% / reading 54%, grade D, #204 of 667 statewide, top 31%, 1,617 students, 36% FRL).
- Market conditions: Rents rising (+2.5%/yr); 1032 active listings in the ZIP; 3 comparable units currently listed for rent nearby; rentals at typical pace (median 23d on market — plan ~3-4 weeks tenant-placement turnaround); solid renter incomes; 2,473 units permitted in Bay County in 2024 (559 in 5+ unit buildings).
- This rent runs 43% of the median local income ($81k/yr) — at the standard rent-burdened threshold; future hikes will face affordability resistance.
Forward outlook
- Local home prices are declining (-3.0%/yr); year-one equity from $2k of loan paydown is wiped out by about $8k of value loss. Plan a longer hold.
- Bay County population projected at +24% by 2050 — long-run rental-demand tailwind backs the buy-and-hold thesis.
Negotiation context
- Only 9 days on market — expect competitive offers; lowballing is unlikely to land.
- 8 sale attempts since 19y ago with the ask held roughly flat each time — persistent listings suggest the price (not the market) is what's stuck; bring a comps-based counter.
- Current owner paid $106k; list at $269k implies a 154% gain — meaningful room to come down on a strong offer.
Risks & watch-outs
- Climate carrying-cost: major flood risk; severe wind risk, 99% chance of damaging wind over 30y; extreme-heat days projected 7→22/yr by 2055 (HVAC capex compounding) — expect insurance premiums to compound above CPI over the hold.
Questions for the listing agent
- Any open or pending special assessments — roof, HVAC, plumbing, elevator, façade? What's the per-unit balance and payoff schedule, and is the seller paying it off at close or rolling it to the buyer?
- Is there a deadline driving the sale (1031 exchange, divorce, estate, relocation)? That informs how much negotiation room exists.
- Schools are D-rated, which usually means shorter tenancies and higher turnover. Who's the typical renter profile here, and what's been the actual vacancy rate?
- What's the average days-on-market for RENTAL listings here right now (not sales)? A rising rental-DOM trend means longer vacancies and softer asking-rent achievability than the comps imply.
- What's the recent tenant-quality profile in this submarket — average credit score on applications, eviction rate, late-payment / NSF rate, and stable-employment percentage? A property-management company in the area should have these aggregated.
- How much new apartment / multifamily construction is in the pipeline within 1–3 miles? Heavy new supply (>2% of stock underway) typically softens rents 12–24 months out; light construction supports rent growth.
Investment metrics
- 1% rule
- 1.08% ✓
- Cap rate
- 8.85%
- Cash-on-cash
- 9.14%
- DSCR
- 1.41
- GRM
- 7.7
CMA / ARV
No comps found within radius.
Projected returns pro-forma
-3.0% appreciation · 2.55% rent growth · sell at horizon
- IRR
- -3.0%
- Equity multiple
- 0.89×
- Total profit
- $-8,404
- Equity at exit
- $40,109
- IRR
- 6.2%
- Equity multiple
- 1.45×
- Total profit
- $34,240
- Equity at exit
- $23,258
Cash invested: $75,320 (down + closing). Projections, not guarantees.
Landlord ↔ Tenant lean methodology
- Overall (STATE)
- 87 Strongly Landlord-Friendly
- State Florida
- 87 Strongly Landlord-Friendly · R+3
- County
- — inherits STATE
- City
- — inherits STATE
ZIP-level market 32408
- Rents YoY
- 2.5%
- Active inventory
- 1032
- Price-to-rent
- 7.7×
Monthly cashflow live
- Estimated rent
- $2,917 medium interval (Pro) →
- Mortgage (P&I)
- −$1,411
- Tax from tax record
- −$208 /mo · $2,492/yr
- Insurance
- −$112
- HOA
- −$0
- Vacancy / Maint / Mgmt
- −$612
- Net cashflow
- $574
Break-even live
Sensitivity live
| Price | -10% $726 | -5% $650 | +0% $574 | +5% $498 | +10% $421 |
|---|---|---|---|---|---|
| Rent | -10% $343 | -5% $458 | +0% $574 | +5% $689 | +10% $804 |
| Rate | -1.0pp $709 | -0.5pp $642 | base $574 | +0.5pp $504 | +1.0pp $433 |
UW: 25.0% down · 7.5% · 30yr · 1.5% tax · 5.0% vac · 8.0% maint · 8.0% mgmt
Financing live
Cash to close
- Down payment
- $67,250
- Closing costs
- $8,070
- Reserves months
- —
- Total cash needed
- —
Loan-product check · same deal, 3 products live
Conventional
25% down · 7.5% · 30yr
- Down + closing
- —
- Monthly P&I
- —
- Monthly cashflow
- —
- DSCR
- —
- Eligible?
- —
Personal DTI + credit; lowest rate.
DSCR
20% down · 8.5% · 30yr
- Down + closing
- —
- Monthly P&I
- —
- Monthly cashflow
- —
- DSCR
- —
- Eligible?
- —
No personal income docs; deal must DSCR.
Hard money
10% down · 12.0% · 12mo
- Down + closing
- —
- Monthly P&I
- —
- Monthly cashflow
- —
- DSCR
- —
- Eligible?
- —
Short-term bridge; refi at stabilization.
Rent comps 3 comps
| Address | Beds | Baths | Sqft | Rent | $/sqft | DOM | Units | Dist |
|---|---|---|---|---|---|---|---|---|
| 4805 Stellata Ln Panama City, FL | 3.0 | 2.0 | 1280 | $2,250 | $1.76 | 22d | 1 | 0.50mi |
| 2400 Grandiflora Blvd #606 Panama City, FL | 3.0 | 3.0 | 1485 | $2,500 | $1.68 | 22d | 1 | 0.64mi |
| 4050 Marriott Dr Unit 1510830P Panama City, FL | 2.0 | 2.0 | 1506 | $6,212 | $4.12 | 15d | 1 | 0.88mi |
HOA detail condo
- Monthly dues
- $0 · $0/yr
- Likely covers
- security
- Assessments
- None detected in remarks — confirm with the listing agent.
Listing history 20 events
-
2026-04-29status Pending
-
2026-04-20$269,000 Active
-
2021-12-14historical
-
2021-12-14historical
-
2021-12-09historical
-
2021-12-09historical
-
2020-05-29soldstatus $105,900
-
2020-05-26soldstatus $105,900
-
2019-10-14$105,900
-
2014-09-16soldstatus $80,000
-
2014-09-06$99,900
-
2014-06-26$89,999
-
2013-01-10$108,500
-
2012-04-04$139,900
-
2011-06-15soldstatus $100,000
-
2011-06-10soldstatus $100,000
-
2008-01-22$109,900
-
2007-05-16soldstatus $175,000
-
2007-05-14soldstatus $175,000
-
2007-01-12$209,000
ⓘ Source: listings_history table (triggers on properties + properties_extension) + one-shot
backfill from property_details.listing_events for pre-trigger history.
Tax reassessment forecast FL · Resets to sale price
- Current annual tax
- $2,492 · $208/mo
- Projected year-2 tax
- $2,492 · $208/mo
- Expected delta
- $0/yr ($0/mo · 0.0%)
ⓘ Screening estimate from a state-policy table — verify with the county assessor before closing.
Climate risk First Street
- Flood 6/10 Major FEMA zone X (unshaded) · 59% chance over 30 yrs
- Wildfire 1/10 Low
- Heat 10/10 Extreme 7 d/yr ≥106°F today · 22 d/yr by 30 yrs out
- Wind 10/10 Extreme 99% chance of damaging wind over 30 yrs
- Air quality 1/10 Low 0 unhealthy d/yr today · 0 by 30 yrs out
Nearby sold comps map
Loading sold comps map…
Walkable amenities ~0.75 mi
Loading nearby amenities…
Taxation est. · year 1
- Rental income
- $34,998
- − Mortgage interest
- −$15,068
- − Property taxes
- −$2,492
- − Insurance
- −$1,345
- − Repairs & maintenance
- −$2,800
- − Management
- −$2,800
- − Depreciation
- −$7,825
- Taxable income
- $2,668
- Est. tax owed @ 24.0%
- −$640
- After-tax cash flow
- $6,243/yr
For passive investors: Depreciation is non-cash, so a rental often shows a tax loss while cash-flowing — sheltering income. Rental losses are passive: they offset passive income freely, and up to $25,000/yr can offset ordinary (W-2) income if you actively participate and your MAGI is under $100k (phasing out to $0 by $150k); unused losses carry forward. On sale, claimed depreciation is recaptured at up to 25%, and gains may owe capital-gains tax (a 1031 exchange can defer both). Figures are a year-1 estimate at your 24.0% rate — not tax advice; consult a CPA.
Schools (NCES district)
- District
- Bay
- NCES district ID
- 1200090
- Math proficiency
- 51% ▼ -8.00%
- Reading proficiency
- 51% ▼ -7.00%
- Median HH income
- $47,740
- Composite
- 43.41/100
- National rank
- #3014
- State rank
- #29 of 73 in FL
Livability — Upper Grand Lagoon
- Score
- 67/100
- State rank
- #583
- US rank
- #11085
Category grades
Schools grade is shown separately in the Schools card above.
Census & demographics
- Census place
- Upper Grand Lagoon, FL
- County
- Bay County · 163,593 people
- City population
- 18,326
- Metro
- Panama City, FL
- Population (ZIP)
- 18,832
- Household income
- $80,822
- Rent vs Own
- Severe rent burden
- 817.0
Population outlook (Bay County) Hauer SSP2
- Today (2025)
- 206,264 people
- By 2030
- 217,740 · +5.6%
- By 2040
- 238,738 · +15.7%
- By 2050
- 255,545 · +23.9%
- By 2075
- 288,295 · +39.8%
- By 2100
- 288,638 · +39.9%
Race, ethnicity, and origin ACS 2023
- Neighborhood character
- Predominantly White (81%)
- Race & ethnicity
- White 81% Hispanic / Latino 7% Two or more races 6% Black 3% Asian 2%
- Hispanic origin (detail)
- Mexican 2% Puerto Rican 2%
- Common ancestry
- Romanian 4% Lithuanian 4% Italian 2%
- Foreign-born
- 11% · Canada, South Korea
- Languages at home
- 88% English-only · Spanish 5% Russian/Polish/Slavic 4% Tagalog/Filipino 1%
Political lean MEDSL · Bay
- 2024 margin
- Solid R (+47.4) · D 25.8% · R 73.1% · Other 1.1%
- 2008→2024 swing
- -6.6pp toward R · 2008: -40.7pp · 2024: -47.4pp
- All cycles
- 2024: R+47.4 2020: R+43.5 2016: R+46.3 2012: R+43.6 2008: R+40.7
Not yet ingested
- Civics
- —
Market trends
- HPI YoY
- ▼ -202.52%
- Current HPI
- 246.9126
- Rent YoY
- ▲ 2.55%
- Metro
- Panama City, FL
- State GDP YoY
- ▲ 3.28%
- F500 in state
- 36
Industry mix (Fortune 500 HQ in FL)
| Industry | F500 HQs | Revenue |
|---|---|---|
| Industrial Technology | 2 | $29B |
|
||
| Insurance | 2 | $17B |
|
||
| Retail | 1 | $60B |
|
||
| Technology Distribution | 1 | $58B |
|
||
| Homebuilding | 1 | $35B |
|
||
| Technology Manufacturing | 1 | $35B |
|
||
Price history
+28.7% since first listed20 events — show timeline
- 2026-04-29 Pending — CPARMLS
- 2026-04-20 Listed $269,000 CPARMLS
- 2021-12-14 Listing Removed — CPARMLS
- 2021-12-14 Listing Removed — CPARMLS
- 2021-12-09 Listing Removed — CPARMLS
- 2021-12-09 Listing Removed — CPARMLS
- 2020-05-29 Sold (MLS) $105,900 CPARMLS
- 2020-05-26 Sold (Public Records) $105,900 Public Records
- 2019-10-14 Listed $105,900 CPARMLS
- 2014-09-16 Sold (Public Records) $80,000 Public Records
- 2014-09-06 Listed $99,900 CPARMLS
- 2014-06-26 Listed $89,999 CPARMLS
- 2013-01-10 Listed $108,500 CPARMLS
- 2012-04-04 Listed $139,900 CPARMLS
- 2011-06-15 Sold (Public Records) $100,000 Public Records
- 2011-06-10 Sold (MLS) $100,000 CPARMLS
- 2008-01-22 Listed $109,900 CPARMLS
- 2007-05-16 Sold (Public Records) $175,000 Public Records
- 2007-05-14 Sold (MLS) $175,000 CPARMLS
- 2007-01-12 Listed $209,000 CPARMLS
Property tax history
+8.0%/yrLatest (2025): $2,492 · +3.9% YoY. Source: county tax records.
Cash-flow waterfall
monthlySold comps — $/sqft
last 12 mo · ≤1 miLoading sold comps…