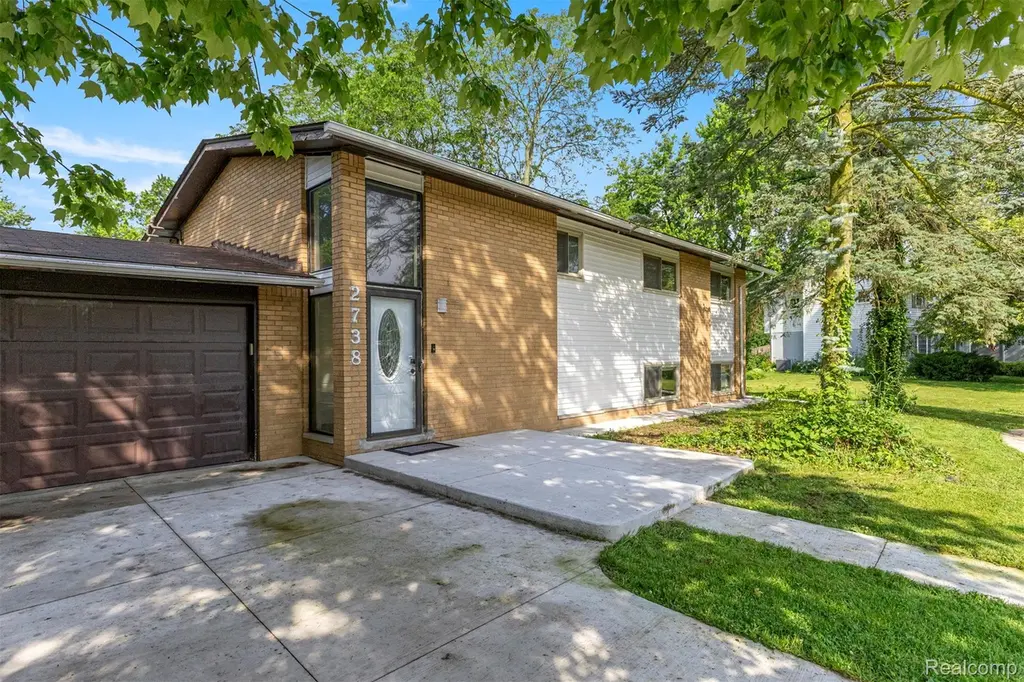
2738 Berry Dr · Bloomfield Hills, MI
Flood risk 1/10 · Minimal
- FEMA flood zone
- X (unshaded)
- Chance of flooding over 30 yrs
- 0.0%
- Est. flood insurance / yr
- $473 – $860
Fire risk 1/10 · Minimal
- Est. fire insurance / yr
- $784 – $1,456
Heat risk 2/10 · Minimal
- Hot days now (above 98°F)
- 7 days/yr
- Hot days in 30 yrs
- 15 days/yr
Wind risk 2/10 · Minimal
- Chance of severe wind over 30 yrs
- —
Air-quality risk 3/10 · Minor
- Unhealthy air days now
- 2 days/yr
- Unhealthy air days in 30 yrs
- 4 days/yr
Risk factors via First Street. Map © Google.
Why this score? — see what drove the D grade
The composite is a weighted blend of 9 inputs, each scored 0–100. Each bar is that input's sub-score; the figure is the points it added to the 100-point composite (weight × sub-score).
- Cash flow +12.4/30.0
- ARV discount +8.2/15.0
- Schools +6.5/10.0
- DSCR +3.7/10.0
- 1% rule +3.6/10.0
- Livability +3.6/5.0
- Rent growth +2.5/5.0
- Condition / age +2.5/5.0
- Appreciation +0.0/10.0
$399,900
🖨 Deal sheet (PDF) 📄 Offer letter ✓ Due diligence
Listing remarks MLS
A 4-bedroom, 2.5-bath bi-level home in a desirable Bloomfield Hills Oakland County neighborhood close to shopping, dining, and major commuter routes. A newer concrete circular driveway and main drive provide excellent parking and curb appeal. Inside, enjoy a bright freshly painted interior, spacious layout, and a cozy natural wood-burning fireplace. The primary suite features a fully renovated en-suite bath. The lower level offers flexible living space ideal for a family room, office, or media area with an electric fireplace feature. Outside, the backyard is built for entertaining with an in-ground pool, diving board, slide, concrete patio, upper balcony views, and walkout-style yard access. Updates include furnace and airconditioned, gutters with guards, roof, windows, finished insulated garage, and included appliances.
Key facts
- Slide
- Diving board
- In ground pool
Tags
Property features AI
Exterior
- Parking: Attached garage with 2 spaces
- Utilities: Public water; Public sewer
- Home design: Single-family residence; Two levels; Mid-level entry
- Construction: Brick and wood siding construction; Asphalt roof; Slab foundation; Built as residential single-family
- Exterior features: Patio; Paved road access
Interior
- Kitchen: Dishwasher; Disposal; Free-standing electric range; Free-standing refrigerator; Microwave; Stainless steel appliances
- Bathrooms: Two full bathrooms; One half bathroom
- Heating & cooling: Forced air heating; Natural gas heating; No central cooling
- Interior features: Gas fireplace; Mid-level entry with steps; Five total rooms
- Laundry & utility: Washer included
Neighborhood map
What this means for you Summary
Snapshot
- This is a 3-bed/2.5-bath single-family listed at $400k.
Deal economics
- At list price, monthly cash flow is $-69 ($-823/yr) — negative.
- To cash-flow at today's rent, offer at most $388k (3.0% below list).
- To meet the 1% rule (rent ≥ 1% of price), the offer needs to be $344k (14.1% below list).
- Recommended offer: $344k (14.1% below list) — sets the bar for 1% rule.
- Cap rate 6.1% vs local median 0.8% in Bloomfield Hills — top-decile yield for the area; either an underpriced asset or a hidden risk that comps aren't pricing in. Stress-test before assuming the spread holds.
Location & tenants
- Location reads 72/100 on livability (#263 in MI) — a middle-class / working-renter tenant base. Strengths: crime A+, employment A+, housing A-; Watch: commute D+, amenities F, cost of living F.
- Bloomfield Hills Schools (suburban): math 65% / reading 74% proficiency, ranked #5 of 540 in MI (top 1%) — acceptable for families but not a draw, mixed tenant base, ~2y average lease; only 7% free/reduced lunch — higher-income household profile.
- Zoned schools: Eastover Elementary School (math 82% / reading 77%, grade A, #21 of 1,397 statewide, top 2%, 456 students, 16% FRL); East Hills Middle School (math 62% / reading 70%, grade A-, #35 of 493 statewide, top 7%, 571 students, 16% FRL); Bloomfield Hills High School (math 59% / reading 82%, grade B+, #32 of 713 statewide, top 4%, 1,598 students, 14% FRL).
- Market conditions: 132 active listings in the ZIP; 3 comparable units currently listed for rent nearby; rentals leasing fast (median 7d on market — plan ~1-2 weeks tenant-placement turnaround); high-income renter base; 2,614 units permitted in Oakland County in 2024 (721 in 5+ unit buildings).
Forward outlook
- Local home prices are declining (-3.0%/yr); year-one equity from $3k of loan paydown is wiped out by about $12k of value loss. Plan a longer hold.
- Oakland County population projected at +10% by 2050 — modest demand growth; plan on rents tracking national, not racing it.
Negotiation context
- It's been on market 38 days — a 3% lower offer ($388k) is reasonable based on typical stale-listing flexibility.
- 22 sale attempts since 25y ago with the ask held roughly flat each time — persistent listings suggest the price (not the market) is what's stuck; bring a comps-based counter.
- Current owner paid $232k; list at $400k implies a 72% gain — meaningful room to come down on a strong offer.
Questions for the listing agent
- What do current leases actually rent for vs. the listed asking? Can we see a recent rent roll and the last 12 months of T-12 income?
- It's been on market 38 days. Have you received any prior offers? Is the seller open to a 14% concession, seller financing, or rate buy-down credit?
- Built in 1961 — when were the roof, HVAC, electrical panel, plumbing, and water heater last replaced?
- Is there a deadline driving the sale (1031 exchange, divorce, estate, relocation)? That informs how much negotiation room exists.
- Schools are A-rated — typically a magnet for longer-tenancy family renters. What's the average tenant stay here, and is there a school-zone premium baked into asking?
- The area grade is low — what's the realistic commute time and amenity access for the typical tenant pool here? Any planned neighborhood developments (good or bad) we should know about?
- What's the average days-on-market for RENTAL listings here right now (not sales)? A rising rental-DOM trend means longer vacancies and softer asking-rent achievability than the comps imply.
- What's the recent tenant-quality profile in this submarket — average credit score on applications, eviction rate, late-payment / NSF rate, and stable-employment percentage? A property-management company in the area should have these aggregated.
- How much new for-sale + rental construction is in the pipeline within 1–3 miles? Heavy new supply typically softens prices + rents 12–24 months out; constrained supply supports both.
Investment metrics
- 1% rule
- 0.86% ✗
- Cap rate
- 6.09%
- Cash-on-cash
- -0.73%
- DSCR
- 0.97
- GRM
- 9.7
CMA / ARV
- ARV (on-the-fly)
- $406,020
- Comps found
- 12
Show comp detail 12 sales within ~0.75 mi
| Address | Dist | Beds/Ba | Sqft | Sold | Price | $/sf | Match |
|---|---|---|---|---|---|---|---|
| 2864 Colonial Trl | 0.23mi | 3/1.5 | 1,881 (-6%) | 2mo | $411,000 | $219 | 73 |
| 2727 Brady Dr | 0.19mi | 3/2.5 | 1,868 (-7%) | 16mo | $403,000 | $216 | 66 |
| 237 Marlborough Dr | 0.50mi | 3/2.0 | 1,859 (-8%) | 0mo | $375,000 | $202 | 62 |
| 2769 Colonial Way | 0.28mi | 4/2.0 (+1) | 1,919 (-4%) | 17mo | $350,000 | $182 | 58 |
| 2615 Douglas Dr | 0.34mi | 4/2.0 (+1) | 2,119 (+5%) | 14mo | $450,000 | $212 | 57 |
| 60 E Square Lake Rd | 0.27mi | 3/2.5 | 1,853 (-8%) | 22mo | $356,000 | $192 | 56 |
| 2155 Devonshire Rd | 0.64mi | 3/2.0 | 2,128 (+6%) | 4mo | $355,000 | $167 | 55 |
| 181 Timber Trace Ln | 0.48mi | 3/2.0 | 1,905 (-5%) | 20mo | $270,000 | $142 | 50 |
| 2381 Bratton Ave | 0.66mi | 3/2.0 | 2,221 (+10%) | 2mo | $385,000 | $173 | 48 |
| 2462 Bratton Ave | 0.66mi | 3/2.0 | 1,920 (-4%) | 19mo | $375,000 | $195 | 44 |
| 1997 Devonshire Rd | 0.71mi | 4/2.5 (+1) | 1,923 (-4%) | 17mo | $417,000 | $217 | 40 |
| 2163 Somerset Rd | 0.63mi | 3/2.0 | 1,729 (-14%) | 17mo | $405,000 | $234 | 31 |
Match score weights: distance 35% · size 25% · config 20% · recency 20%. Top-matched comps best support the ARV.
Projected returns pro-forma
-3.0% appreciation · 3.0% rent growth · sell at horizon
- IRR
- -17.5%
- Equity multiple
- 0.38×
- Total profit
- $-69,104
- Equity at exit
- $59,626
- IRR
- -9.5%
- Equity multiple
- 0.41×
- Total profit
- $-65,538
- Equity at exit
- $34,576
Cash invested: $111,972 (down + closing). Projections, not guarantees.
Landlord ↔ Tenant lean methodology
- Overall (STATE)
- 62 Landlord-Friendly
- State Michigan
- 62 Landlord-Friendly · EVEN
- County
- — inherits STATE
- City
- — inherits STATE
ZIP-level market 48304
- Active inventory
- 132
- Price-to-rent
- 9.7×
Monthly cashflow live
- Estimated rent
- $3,437 medium interval (Pro) →
- Mortgage (P&I)
- −$2,097
- Tax from tax record
- −$520 /mo · $6,237/yr
- Insurance
- −$167
- HOA
- −$0
- Vacancy / Maint / Mgmt
- −$722
- Net cashflow
- $-69
Break-even live
Sensitivity live
| Price | -10% $158 | -5% $45 | +0% $-69 | +5% $-182 | +10% $-295 |
|---|---|---|---|---|---|
| Rent | -10% $-340 | -5% $-204 | +0% $-69 | +5% $67 | +10% $203 |
| Rate | -1.0pp $133 | -0.5pp $33 | base $-69 | +0.5pp $-172 | +1.0pp $-278 |
UW: 25.0% down · 7.5% · 30yr · 1.5% tax · 5.0% vac · 8.0% maint · 8.0% mgmt
Financing live
Cash to close
- Down payment
- $99,975
- Closing costs
- $11,997
- Reserves months
- —
- Total cash needed
- —
Loan-product check · same deal, 3 products live
Conventional
25% down · 7.5% · 30yr
- Down + closing
- —
- Monthly P&I
- —
- Monthly cashflow
- —
- DSCR
- —
- Eligible?
- —
Personal DTI + credit; lowest rate.
DSCR
20% down · 8.5% · 30yr
- Down + closing
- —
- Monthly P&I
- —
- Monthly cashflow
- —
- DSCR
- —
- Eligible?
- —
No personal income docs; deal must DSCR.
Hard money
10% down · 12.0% · 12mo
- Down + closing
- —
- Monthly P&I
- —
- Monthly cashflow
- —
- DSCR
- —
- Eligible?
- —
Short-term bridge; refi at stabilization.
Rent comps 3 comps
| Address | Beds | Baths | Sqft | Rent | $/sqft | DOM | Units | Dist |
|---|---|---|---|---|---|---|---|---|
| 42160 Woodward Ave Bloomfield Hills, MI | 2.0 | 2.0 | 1689 | $3,500 | $2.07 | 0d | 1 | 0.08mi |
| 124 Alice Ave Bloomfield Township, MI | 3.0 | 1.0 | 1440 | $2,000 | $1.39 | 7d | 1 | 1.10mi |
| 3975 Brookside Dr Bloomfield Hills, MI | 4.0 | 2.5 | 2094 | $3,250 | $1.55 | 26d | 1 | 1.50mi |
Listing history 50 events
-
2026-06-21days on market $399,900 Active 38 DOM
-
2026-06-18days on market $399,900 Active 35 DOM
-
2026-06-17days on market $399,900 Active 34 DOM
-
2026-06-16days on market $399,900 Active 33 DOM
-
2026-06-15days on market $399,900 Active 32 DOM
-
2026-06-13days on market $399,900 Active 30 DOM
-
2026-06-13days on market $399,900 Active 29 DOM
-
2026-06-09days on market $399,900 Active 26 DOM
-
2026-06-08days on market $399,900 Active 25 DOM
-
2026-06-07days on market $399,900 Active 24 DOM
-
2026-06-04days on market $399,900 Active 21 DOM
-
2026-06-03days on market $399,900 Active 20 DOM
-
2026-06-02days on market $399,900 Active 19 DOM
-
2026-06-01days on market $399,900 Active 18 DOM
-
2026-05-31days on market $399,900 Active 17 DOM
-
2026-05-14$399,900 Active 832-char remark
Show marketing remark (832 chars)
A 4-bedroom, 2.5-bath bi-level home in a desirable Bloomfield Hills Oakland County neighborhood close to shopping, dining, and major commuter routes. A newer concrete circular driveway and main drive provide excellent parking and curb appeal. Inside, enjoy a bright freshly painted interior, spacious layout, and a cozy natural wood-burning fireplace. The primary suite features a fully renovated en-suite bath. The lower level offers flexible living space ideal for a family room, office, or media area with an electric fireplace feature. Outside, the backyard is built for entertaining with an in-ground pool, diving board, slide, concrete patio, upper balcony views, and walkout-style yard access. Updates include furnace and airconditioned, gutters with guards, roof, windows, finished insulated garage, and included appliances.
-
2026-05-14$399,900 Active
Show marketing remark (832 chars)
A 4-bedroom, 2.5-bath bi-level home in a desirable Bloomfield Hills Oakland County neighborhood close to shopping, dining, and major commuter routes. A newer concrete circular driveway and main drive provide excellent parking and curb appeal. Inside, enjoy a bright freshly painted interior, spacious layout, and a cozy natural wood-burning fireplace. The primary suite features a fully renovated en-suite bath. The lower level offers flexible living space ideal for a family room, office, or media area with an electric fireplace feature. Outside, the backyard is built for entertaining with an in-ground pool, diving board, slide, concrete patio, upper balcony views, and walkout-style yard access. Updates include furnace and airconditioned, gutters with guards, roof, windows, finished insulated garage, and included appliances.
-
2026-04-25historical
-
2026-03-31price $425,000
-
2026-03-31price $425,000
-
2026-02-28price $450,000
-
2026-02-27price $450,000
-
2026-02-13price $475,000
-
2026-02-12price $475,000
-
2026-01-10$490,000 Active
-
2026-01-10$490,000 Active
-
2026-01-08historical
-
2025-08-16historical
-
2025-08-16historical
-
2025-07-30price $499,600
-
2025-07-30price $499,600
-
2025-06-25$499,700 Active
-
2025-06-23$499,700 Active
-
2022-11-08historical
-
2022-11-07historical
-
2022-10-18$319,000 Active
-
2022-10-18$319,000 Active
-
2022-09-07historical
-
2022-09-07historical
-
2022-07-23price $349,000
-
2022-07-23price $349,000
-
2022-07-12$359,000 Active
-
2022-07-12$359,000 Active
-
2019-06-29historical
-
2019-06-29historical
-
2018-07-20price $299,900
-
2018-07-20price $299,900
-
2018-06-19$315,000 Active
-
2018-06-19$315,000 Active
-
2017-05-16soldstatus $232,000
ⓘ Source: listings_history table (triggers on properties + properties_extension) + one-shot
backfill from property_details.listing_events for pre-trigger history.
Tax reassessment forecast MI · Partial reset (capped growth)
- Current annual tax
- $6,237 · $520/mo
- Projected year-2 tax
- $6,237 · $520/mo
- Expected delta
- $0/yr ($0/mo · 0.0%)
ⓘ Screening estimate from a state-policy table — verify with the county assessor before closing.
Climate risk First Street
- Flood 1/10 Low FEMA zone X (unshaded) · 0% chance over 30 yrs
- Wildfire 1/10 Low
- Heat 2/10 Low 7 d/yr ≥98°F today · 15 d/yr by 30 yrs out
- Wind 2/10 Low
- Air quality 3/10 Moderate 2 unhealthy d/yr today · 4 by 30 yrs out
Nearby sold comps map
Loading sold comps map…
Walkable amenities ~0.75 mi
Loading nearby amenities…
Taxation est. · year 1
- Rental income
- $41,240
- − Mortgage interest
- −$22,401
- − Property taxes
- −$6,237
- − Insurance
- −$2,000
- − Repairs & maintenance
- −$3,299
- − Management
- −$3,299
- − Depreciation
- −$11,633
- Taxable loss
- −$7,630
- Est. tax savings @ 24.0%
- +$1,831
- After-tax cash flow
- $1,008/yr
For passive investors: Depreciation is non-cash, so a rental often shows a tax loss while cash-flowing — sheltering income. Rental losses are passive: they offset passive income freely, and up to $25,000/yr can offset ordinary (W-2) income if you actively participate and your MAGI is under $100k (phasing out to $0 by $150k); unused losses carry forward. On sale, claimed depreciation is recaptured at up to 25%, and gains may owe capital-gains tax (a 1031 exchange can defer both). Figures are a year-1 estimate at your 24.0% rate — not tax advice; consult a CPA.
Schools (NCES district)
- District
- Bloomfield Hills Schools
- NCES district ID
- 2606090
- Math proficiency
- 65% ▼ -2.00%
- Reading proficiency
- 74% ▲ 2.00%
- Median HH income
- $117,848
- Composite
- 65.41/100
- National rank
- #481
- State rank
- #5 of 540 in MI
Livability — Bloomfield Hills
- Score
- 72/100
- State rank
- #263
- US rank
- #6482
Category grades
Schools grade is shown separately in the Schools card above.
Census & demographics
- County
- Oakland County · 1,009,092 people
- City population
- 34,892
- Metro
- Detroit-Warren-Dearborn, MI
- Population (ZIP)
- 17,387
- Household income
- $143,204
- Rent vs Own
- Severe rent burden
- 85.0
Population outlook (Oakland County) Hauer SSP2
- Today (2025)
- 1,335,747 people
- By 2030
- 1,375,100 · +2.9%
- By 2040
- 1,435,385 · +7.5%
- By 2050
- 1,469,250 · +10.0%
- By 2075
- 1,531,946 · +14.7%
- By 2100
- 1,450,485 · +8.6%
Race, ethnicity, and origin ACS 2023
- Neighborhood character
- Predominantly White (79%)
- Race & ethnicity
- White 79% Asian 10% Two or more races 4% Black 4% Hispanic / Latino 2%
- Common ancestry
- Romanian 6% Lithuanian 3% Slovak 2%
- Foreign-born
- 17% · China, Canada, South Korea
- Languages at home
- 79% English-only · Other Indo-European 6% Arabic 5% Other Asian/Pacific 3%
Political lean MEDSL · Oakland
- 2024 margin
- D (+10.6) · D 54.4% · R 43.8% · Other 1.9%
- 2008→2024 swing
- -3.9pp toward R · 2008: 14.5pp · 2024: 10.6pp
- All cycles
- 2024: D+10.6 2020: D+14.1 2016: D+8.1 2012: D+8.1 2008: D+14.5
Not yet ingested
- Civics
- —
Market trends
- HPI YoY
- ▼ -195.96%
- Current HPI
- 160.6477
- Rent YoY
- —
- Metro
- Detroit-Warren-Dearborn, MI
- State GDP YoY
- ▲ 1.37%
- F500 in state
- 28
Industry mix (Fortune 500 HQ in MI)
| Industry | F500 HQs | Revenue |
|---|---|---|
| Automotive Parts | 3 | $48B |
|
||
| Automotive | 2 | $372B |
|
||
| Chemicals | 1 | $45B |
|
||
| Automotive Retail | 1 | $29B |
|
||
| Healthcare / Medical Devices | 1 | $23B |
|
||
| Automotive Technology | 1 | $20B |
|
||
Price history
+53.9% since first listed61 events — show timeline
- 2026-05-14 Listed $399,900 REALCOMP
- 2026-05-14 Listed $399,900 MiRealSource-MiMLS
- 2026-04-25 Listing Removed — MiRealSource-MiMLS
- 2026-03-31 Price Changed $425,000 MiRealSource-MiMLS
- 2026-03-31 Price Changed $425,000 REALCOMP
- 2026-02-28 Price Changed $450,000 MiRealSource-MiMLS
- 2026-02-27 Price Changed $450,000 REALCOMP
- 2026-02-13 Price Changed $475,000 MiRealSource-MiMLS
- 2026-02-12 Price Changed $475,000 REALCOMP
- 2026-01-10 Listed $490,000 MiRealSource-MiMLS
- 2026-01-10 Listed $490,000 REALCOMP
- 2026-01-08 Coming Soon — MiRealSource-MiMLS
- 2025-08-16 Listing Removed — REALCOMP
- 2025-08-16 Listing Removed — MiRealSource-MiMLS
- 2025-07-30 Price Changed $499,600 MiRealSource-MiMLS
- 2025-07-30 Price Changed $499,600 REALCOMP
- 2025-06-25 Listed $499,700 REALCOMP
- 2025-06-23 Listed $499,700 MiRealSource-MiMLS
- 2022-11-08 Listing Removed — MiRealSource-MiMLS
- 2022-11-07 Listing Removed — REALCOMP
- 2022-10-18 Listed $319,000 MiRealSource-MiMLS
- 2022-10-18 Listed $319,000 REALCOMP
- 2022-09-07 Listing Removed — REALCOMP
- 2022-09-07 Listing Removed — MiRealSource-MiMLS
- 2022-07-23 Price Changed $349,000 MiRealSource-MiMLS
- 2022-07-23 Price Changed $349,000 REALCOMP
- 2022-07-12 Listed $359,000 MiRealSource-MiMLS
- 2022-07-12 Listed $359,000 REALCOMP
- 2019-06-29 Listing Removed — REALCOMP
- 2019-06-29 Listing Removed — MiRealSource-MiMLS
- 2018-07-20 Price Changed $299,900 MiRealSource-MiMLS
- 2018-07-20 Price Changed $299,900 REALCOMP
- 2018-06-19 Listed $315,000 MiRealSource-MiMLS
- 2018-06-19 Listed $315,000 REALCOMP
- 2017-05-16 Sold (Public Records) $232,000 Public Records
- 2017-04-28 Sold (MLS) $232,000 MiRealSource-MiMLS
- 2017-04-28 Sold (MLS) $232,000 REALCOMP
- 2017-03-31 Pending — MiRealSource-MiMLS
- 2017-03-31 Pending — REALCOMP
- 2017-03-22 Listed $238,700 MiRealSource-MiMLS
- 2017-03-22 Listed $238,700 REALCOMP
- 2016-09-23 Listing Removed — REALCOMP
- 2016-09-22 Listing Removed — MiRealSource-MiMLS
- 2016-07-15 Price Changed $249,000 MiRealSource-MiMLS
- 2016-07-15 Price Changed $249,000 REALCOMP
- 2016-06-23 Listed $259,000 MiRealSource-MiMLS
- 2016-06-22 Listed $259,000 REALCOMP
- 2015-10-25 Listing Removed — REALCOMP
- 2015-10-25 Listing Removed — MiRealSource-MiMLS
- 2015-09-18 Price Changed $254,000 MiRealSource-MiMLS
- 2015-09-18 Price Changed $254,000 REALCOMP
- 2015-06-24 Listed $259,900 MiRealSource-MiMLS
- 2015-06-24 Listed $259,900 REALCOMP
- 2005-10-06 Listing Removed — REALCOMP
- 2005-09-07 Listed $289,000 REALCOMP
- 2005-09-06 Listing Removed — REALCOMP
- 2005-06-09 Listed $289,000 REALCOMP
- 2001-10-18 Listing Removed — REALCOMP
- 2001-09-04 Listing Removed — REALCOMP
- 2001-09-01 Listed $259,900 REALCOMP
- 2001-07-25 Listed $259,900 REALCOMP
Property tax history
+6.8%/yrLatest (2025): $6,237 · +2.1% YoY. Source: county tax records.
Cash-flow waterfall
monthlySold comps — $/sqft
last 12 mo · ≤1 miLoading sold comps…