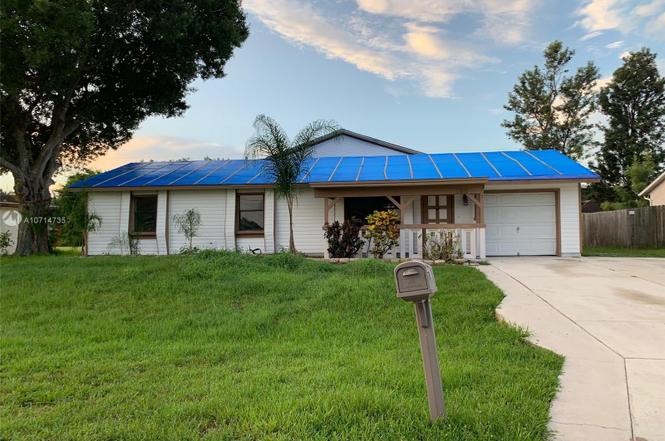
756 SW Bond Rd · Port St. Lucie, FL
Flood risk 1/10 · Minimal
- FEMA flood zone
- X (unshaded)
- Chance of flooding over 30 yrs
- 0.0%
- Est. flood insurance / yr
- $507 – $1,088
Fire risk 1/10 · Minimal
- Est. fire insurance / yr
- $947 – $1,759
Heat risk 10/10 · Severe
- Hot days now (above 106°F)
- 7 days/yr
- Hot days in 30 yrs
- 24 days/yr
Wind risk 10/10 · Severe
- Chance of severe wind over 30 yrs
- 99.0%
Air-quality risk 1/10 · Minimal
- Unhealthy air days now
- 0 days/yr
- Unhealthy air days in 30 yrs
- 0 days/yr
Risk factors via First Street. Map © Google.
Why this score? — see what drove the C+ grade
The composite is a weighted blend of 9 inputs, each scored 0–100. Each bar is that input's sub-score; the figure is the points it added to the 100-point composite (weight × sub-score).
- Cash flow +21.8/30.0
- ARV discount +15.0/15.0
- DSCR +7.0/10.0
- 1% rule +5.1/10.0
- Schools +3.7/10.0
- Rent growth +2.6/5.0
- Livability +2.5/5.0
- Condition / age +2.5/5.0
- Appreciation +0.0/10.0
$285,000
🖨 Deal sheet 📄 Offer letter ✓ Due diligence
Listing remarks MLS
THIS HOME WONT LAST AT THIS PRICE FEATURE 3 BEDROOM 2 BATH EXTRA LARGE MASTER BEDROOM WITH DUAL CLOSET AND OVER SIDE FAMILY ROOM. HOME IS JUST 5 MINUTES TO TURNPIKE, MINUTES TO TURTLE RUN PARK AND 10 MINUTES TO I-95. NEED TLC. .. NEW ROOF NEED.
Key facts
- Spacious yard
- Roof 2020
- Fenced yard
Tags
Property features AI
Finance
- Financial info: Pets allowed with no restrictions
- HOA & community: No association amenities
Exterior
- Parking: Attached 2-car garage; 2 covered parking spaces
- Utilities: Public water; Public sewer; Three-phase electric service; Cable available
- Home design: Single family residence; Multi/split levels; One story; Northwest facing; Resale property
- Construction: Frame construction with vinyl siding; Composition/shingle roof; Built on foundation (public records)
- Exterior features: Screened patio; Patio; Fenced yard; Paved road frontage; Not waterfront
Interior
- Kitchen: Dishwasher; Electric range; Microwave; Refrigerator; Electric water heater
- Bedrooms: 3 bedrooms on the main level
- Flooring: Carpet; Ceramic tile
- Bathrooms: 2 full bathrooms on the main level
- Heating & cooling: Central electric heating; Central electric cooling; Ceiling fans
- Interior features: Cathedral ceilings; Vaulted ceilings; Entrance foyer; Walk-in closets; Stacked bedroom layout
- Laundry & utility: Inside laundry in a laundry closet
Neighborhood map
What this means for you Summary
Snapshot
- This is a 3-bed/2.0-bath single-family listed at $285k.
Deal economics
- At list price, monthly cash flow is $443 ($5k/yr) — positive.
- The deal already cash-flows at list — no discount required.
- Meets the 1% rule at list price ($3k rent vs $285k).
- Recommended offer: $251k (12.0% below list) — sets the bar for market timing.
- Cap rate 8.2% vs local median 3.9% in Port St. Lucie — top-decile yield for the area; either an underpriced asset or a hidden risk that comps aren't pricing in. Stress-test before assuming the spread holds.
Location & tenants
- Location reads: area grade C — affects rentability + tenant quality, not the cash-flow math above.
- St. Lucie (urban): math 40% / reading 48% proficiency, ranked #51 of 73 in FL (top 70%) — families likely to look elsewhere, expect single-tenant / working-renter base with shorter leases.
- Market conditions: Rents flat; 758 active listings in the ZIP; 40 comparable units currently listed for rent nearby; rentals at typical pace (median 24d on market — plan ~3-4 weeks tenant-placement turnaround); solid renter incomes; 4,868 units permitted in St. Lucie County in 2024 (268 in 5+ unit buildings).
- This rent runs 40% of the median local income ($86k/yr) — at the standard rent-burdened threshold; future hikes will face affordability resistance.
Forward outlook
- Local home prices are declining (-3.0%/yr); year-one equity from $2k of loan paydown is wiped out by about $9k of value loss. Plan a longer hold.
- St. Lucie County population projected at +20% by 2050 — long-run rental-demand tailwind backs the buy-and-hold thesis.
Negotiation context
- It's been on market 217 days — a 12% lower offer ($251k) is reasonable based on typical stale-listing flexibility.
- 8 sale attempts since 22y ago; this cycle's ask has dropped $40k (12%) from the opening price — seller is motivated, your offer sets the floor, not the list.
- Current owner paid $141k; list at $285k implies a 102% gain — meaningful room to come down on a strong offer.
Risks & watch-outs
- Climate carrying-cost: severe wind risk, 99% chance of damaging wind over 30y; extreme-heat days projected 7→24/yr by 2055 (HVAC capex compounding) — expect insurance premiums to compound above CPI over the hold.
Questions for the listing agent
- It's been on market 217 days. Have you received any prior offers? Is the seller open to a 12% concession, seller financing, or rate buy-down credit?
- Why hasn't it sold? Are there any deal-killer items the seller is aware of (foundation, flood, title, zoning, code violations)?
- Is there a deadline driving the sale (1031 exchange, divorce, estate, relocation)? That informs how much negotiation room exists.
- What's the average days-on-market for RENTAL listings here right now (not sales)? A rising rental-DOM trend means longer vacancies and softer asking-rent achievability than the comps imply.
- What's the recent tenant-quality profile in this submarket — average credit score on applications, eviction rate, late-payment / NSF rate, and stable-employment percentage? A property-management company in the area should have these aggregated.
- How much new for-sale + rental construction is in the pipeline within 1–3 miles? Heavy new supply typically softens prices + rents 12–24 months out; constrained supply supports both.
Investment metrics
- 1% rule
- 1.01% ✓
- Cap rate
- 8.16%
- Cash-on-cash
- 6.66%
- DSCR
- 1.30
- GRM
- 8.3
CMA / ARV
- ARV (on-the-fly)
- $411,240
- Comps found
- 12
Show comp detail 12 sales within ~0.75 mi
| Address | Dist | Beds/Ba | Sqft | Sold | Price | $/sf | Match |
|---|---|---|---|---|---|---|---|
| 2062 SW Idaho Ln | 0.31mi | 3/2.0 | 1,814 (+2%) | 2mo | $415,000 | $229 | 82 |
| 679 SW Post Ter | 0.11mi | 3/2.0 | 1,564 (-12%) | 7mo | $359,900 | $230 | 68 |
| 782 SW Amber Ter | 0.58mi | 3/2.0 | 1,808 (+1%) | 4mo | $400,000 | $221 | 68 |
| 674 SW Sandbar Ter SW | 0.31mi | 3/2.0 | 1,647 (-8%) | 10mo | $410,000 | $249 | 64 |
| 925 SW Nichols Ter | 0.53mi | 3/2.0 | 1,652 (-8%) | 7mo | $385,000 | $233 | 57 |
| 950 SW Longfellow Rd | 0.35mi | 4/2.0 (+1) | 1,912 (+7%) | 12mo | $331,000 | $173 | 57 |
| 2309 SW Chestnut Ln | 0.31mi | 3/2.0 | 2,005 (+12%) | 12mo | $415,000 | $207 | 55 |
| 1037 SW California Blvd | 0.63mi | 3/2.0 | 1,629 (-9%) | 3mo | $380,000 | $233 | 53 |
| 926 SW Nichols Ter | 0.56mi | 3/2.0 | 1,608 (-10%) | 10mo | $345,000 | $215 | 49 |
| 838 SW Sail Ter | 0.57mi | 3/2.0 | 1,582 (-12%) | 10mo | $420,000 | $265 | 46 |
| 701 SW Amber Ter | 0.69mi | 3/2.0 | 1,539 (-14%) | 1mo | $240,000 | $156 | 44 |
| 1029 SW Jennifer Ter | 0.66mi | 4/2.0 (+1) | 1,933 (+8%) | 10mo | $478,000 | $247 | 43 |
Match score weights: distance 35% · size 25% · config 20% · recency 20%. Top-matched comps best support the ARV.
Projected returns pro-forma
-3.0% appreciation · 0.22% rent growth · sell at horizon
- IRR
- -9.1%
- Equity multiple
- 0.68×
- Total profit
- $-25,842
- Equity at exit
- $42,494
- IRR
- -3.6%
- Equity multiple
- 0.79×
- Total profit
- $-16,700
- Equity at exit
- $24,642
Cash invested: $79,800 (down + closing). Projections, not guarantees.
Landlord ↔ Tenant lean methodology
- Overall (STATE)
- 87 Strongly Landlord-Friendly
- State Florida
- 87 Strongly Landlord-Friendly · R+3
- County
- — inherits STATE
- City
- — inherits STATE
ZIP-level market 34953
- Home prices YoY
- -10.1%
- Rents YoY
- 0.2%
- Active inventory
- 758
- Price-to-rent
- 8.3×
Monthly cashflow live
- Estimated rent
- $2,870 high interval (Pro) →
- Mortgage (P&I)
- −$1,495
- Tax from tax record
- −$211 /mo · $2,538/yr
- Insurance
- −$119
- HOA
- −$0
- Vacancy / Maint / Mgmt
- −$603
- Net cashflow
- $443
Break-even live
UW: 25.0% down · 7.5% · 30yr · 1.5% tax · 5.0% vac · 8.0% maint · 8.0% mgmt
Financing live
Cash to close
- Down payment
- $71,250
- Closing costs
- $8,550
- Reserves months
- —
- Total cash needed
- —
Loan-product check · same deal, 3 products live
Conventional
25% down · 7.5% · 30yr
- Down + closing
- —
- Monthly P&I
- —
- Monthly cashflow
- —
- DSCR
- —
- Eligible?
- —
Personal DTI + credit; lowest rate.
DSCR
20% down · 8.5% · 30yr
- Down + closing
- —
- Monthly P&I
- —
- Monthly cashflow
- —
- DSCR
- —
- Eligible?
- —
No personal income docs; deal must DSCR.
Hard money
10% down · 12.0% · 12mo
- Down + closing
- —
- Monthly P&I
- —
- Monthly cashflow
- —
- DSCR
- —
- Eligible?
- —
Short-term bridge; refi at stabilization.
Rent comps 40 comps
| Address | Beds | Baths | Sqft | Rent | $/sqft | DOM | Units | Dist |
|---|---|---|---|---|---|---|---|---|
| 619 SW Post Ter Port Saint Lucie, FL | 3.0 | 2.0 | 1827 | $2,600 | $1.42 | 23d | 1 | 0.11mi |
| 2180 SW Cameo Blvd Port Saint Lucie, FL | 4.0 | 2.0 | 1796 | $3,400 | $1.89 | 23d | 1 | 0.24mi |
| 2078 SW Idaho Ln Port Saint Lucie, FL | 3.0 | 2.0 | 1800 | $2,361 | $1.31 | 14d | 1 | 0.29mi |
| 662 SW Sandbar Ter Port Saint Lucie, FL | 4.0 | 2.0 | 1644 | $2,366 | $1.44 | 14d | 1 | 0.32mi |
| 2351 SW Chestnut Ln Unit N/A Port St. Lucie, FL | 3.0 | 2.0 | 1510 | $3,000 | $1.99 | 23d | 1 | 0.39mi |
| 928 SW John Maccormack Ter Port Saint Lucie, FL | 4.0 | 2.5 | 1802 | $2,800 | $1.55 | 14d | 1 | 0.45mi |
| 1941 SW Hampshire Ln Port Saint Lucie, FL | 4.0 | 2.0 | 1908 | $2,600 | $1.36 | 23d | 1 | 0.52mi |
| 2450 SW Cameo Blvd Unit A Port St. Lucie, FL | 3.0 | 2.0 | 2400 | $2,800 | $1.17 | 14d | 1 | 0.66mi |
| 2141 SW Bayshore Blvd Port Saint Lucie, FL | 3.0 | 2.0 | 1918 | $3,300 | $1.72 | 14d | 1 | 0.74mi |
| 2265 SW Edison Cir Port Saint Lucie, FL | 2.0 | 2.0 | 1305 | $2,250 | $1.72 | 23d | 1 | 0.82mi |
| 1782 SW Bayshore Blvd Port Saint Lucie, FL | 4.0 | 3.0 | 2094 | $3,200 | $1.53 | 23d | 1 | 0.84mi |
| 1080 SW Colorado Ave Port Saint Lucie, FL | 3.0 | 2.0 | 1240 | $2,150 | $1.73 | 23d | 1 | 0.86mi |
| 1750 SW Hampshire Ln Port Saint Lucie, FL | 3.0 | 2.0 | 1597 | $2,376 | $1.49 | 14d | 1 | 0.88mi |
| 332 SW Glenwood Dr Port Saint Lucie, FL | 4.0 | 2.0 | 2176 | $2,400 | $1.10 | 21d | 1 | 0.89mi |
| 279 SW Glenwood Dr Port Saint Lucie, FL | 3.0 | 2.0 | 1393 | $2,975 | $2.14 | 23d | 1 | 0.97mi |
| 2617 SW Chestnut Ln Port Saint Lucie, FL | 3.0 | 2.0 | 2052 | $2,675 | $1.30 | 14d | 1 | 0.98mi |
| 2617 SW Chestnut Ln Port Saint Lucie, FL | 3.0 | 2.0 | 1457 | $2,675 | $1.84 | 23d | 1 | 0.98mi |
| 1273 SW Granville Ave Port St. Lucie, FL | 4.0 | 3.0 | 2100 | $3,500 | $1.67 | 23d | 1 | 0.99mi |
| 1992 SW Brisbane St Port Saint Lucie, FL | 4.0 | 3.0 | 2478 | $4,995 | $2.02 | 23d | 1 | 0.99mi |
| 1143 SW Estaugh Ave Port Saint Lucie, FL | 4.0 | 3.0 | 1941 | $2,800 | $1.44 | 23d | 1 | 1.00mi |
| 992 SW College Park Rd Port Saint Lucie, FL | 4.0 | 3.0 | 2078 | $2,700 | $1.30 | 23d | 1 | 1.00mi |
| 518 SW Aster Rd Port Saint Lucie, FL | 4.0 | 2.0 | 1773 | $3,450 | $1.95 | 23d | 1 | 1.00mi |
| 481 SW Aster Rd Port Saint Lucie, FL | 3.0 | 2.0 | 1499 | $3,000 | $2.00 | 23d | 1 | 1.01mi |
| 262 SW Crescent Ave Port Saint Lucie, FL | 3.0 | 2.0 | 1482 | $2,600 | $1.75 | 23d | 1 | 1.05mi |
| 233 SW Chapman Ave Port Saint Lucie, FL | 3.0 | 2.0 | 1467 | $1,250 | $0.85 | 21d | 1 | 1.11mi |
| 2357 SW Norton St Port Saint Lucie, FL | 4.0 | 3.0 | 2134 | $2,800 | $1.31 | 23d | 1 | 1.12mi |
| 1626 SW Buffum Ln Port Saint Lucie, FL | 4.0 | 2.0 | 1704 | $2,600 | $1.53 | 23d | 1 | 1.16mi |
| 997 SW Eureka Ave Port Saint Lucie, FL | 3.0 | 2.0 | 1986 | $2,600 | $1.31 | 23d | 1 | 1.20mi |
| 1341 SW Oriole Ln Port Saint Lucie, FL | 3.0 | 2.0 | 1698 | $2,300 | $1.35 | 23d | 1 | 1.22mi |
| 2174 SW Wayne St Port Saint Lucie, FL | 3.0 | 2.0 | 1463 | $2,370 | $1.62 | 23d | 1 | 1.24mi |
| 221 SW Voltair Ter Port Saint Lucie, FL | 4.0 | 2.5 | 2232 | $3,000 | $1.34 | 23d | 1 | 1.25mi |
| 543 SW Whitmore Dr Port Saint Lucie, FL | 4.0 | 2.0 | 1916 | $2,950 | $1.54 | 23d | 1 | 1.25mi |
| 1086 SW Eureka Ave Port Saint Lucie, FL | 3.0 | 2.0 | 1508 | $2,600 | $1.72 | 14d | 1 | 1.26mi |
| 2073 SW Capeador St Port Saint Lucie, FL | 3.0 | 2.0 | 1250 | $2,500 | $2.00 | 23d | 1 | 1.28mi |
| 210 SW Voltair Ter Port Saint Lucie, FL | 3.0 | 2.0 | 1526 | $2,650 | $1.74 | 23d | 1 | 1.28mi |
| 161 SW Grimaldo Ter Port Saint Lucie, FL | 3.0 | 2.0 | 1628 | $2,300 | $1.41 | 21d | 1 | 1.37mi |
| 180 SW Voltair Ter Port Saint Lucie, FL | 3.0 | 2.0 | 1519 | $2,500 | $1.65 | 23d | 1 | 1.38mi |
| 2033 SW Beekman St Unit 2033 Port St. Lucie, FL | 3.0 | 2.0 | 2081 | $3,700 | $1.78 | 23d | 1 | 1.41mi |
| 1402 SW Crest Ave Port Saint Lucie, FL | 4.0 | 2.0 | 1827 | $2,495 | $1.37 | 23d | 1 | 1.49mi |
| 1956 SW Beekman St Unit 1956 Port St. Lucie, FL | 4.0 | 3.0 | 2525 | $3,500 | $1.39 | 14d | 1 | 1.50mi |
Listing history 27 events
-
2026-05-31days on market $285,000 Active 217 DOM
-
2026-05-30days on market $285,000 Active 216 DOM
-
2026-02-18price $285,000
-
2025-12-28price $300,000
-
2025-10-26$324,900 Active
-
2020-06-08historical
-
2020-01-03price $239,000
-
2019-12-07$269,000 Active
-
2019-10-04soldstatus $141,000
-
2019-10-02soldstatus $141,000 Sold 245-char remark
Show marketing remark (245 chars)
THIS HOME WONT LAST AT THIS PRICE FEATURE 3 BEDROOM 2 BATH EXTRA LARGE MASTER BEDROOM WITH DUAL CLOSET AND OVER SIDE FAMILY ROOM. HOME IS JUST 5 MINUTES TO TURNPIKE, MINUTES TO TURTLE RUN PARK AND 10 MINUTES TO I-95. NEED TLC. .. NEW ROOF NEED.
-
2019-09-23status Active 245-char remark
Show marketing remark (245 chars)
THIS HOME WONT LAST AT THIS PRICE FEATURE 3 BEDROOM 2 BATH EXTRA LARGE MASTER BEDROOM WITH DUAL CLOSET AND OVER SIDE FAMILY ROOM. HOME IS JUST 5 MINUTES TO TURNPIKE, MINUTES TO TURTLE RUN PARK AND 10 MINUTES TO I-95. NEED TLC. .. NEW ROOF NEED.
-
2019-08-17status Pending 245-char remark
Show marketing remark (245 chars)
THIS HOME WONT LAST AT THIS PRICE FEATURE 3 BEDROOM 2 BATH EXTRA LARGE MASTER BEDROOM WITH DUAL CLOSET AND OVER SIDE FAMILY ROOM. HOME IS JUST 5 MINUTES TO TURNPIKE, MINUTES TO TURTLE RUN PARK AND 10 MINUTES TO I-95. NEED TLC. .. NEW ROOF NEED.
-
2019-07-29$139,900 Active 245-char remark
Show marketing remark (245 chars)
THIS HOME WONT LAST AT THIS PRICE FEATURE 3 BEDROOM 2 BATH EXTRA LARGE MASTER BEDROOM WITH DUAL CLOSET AND OVER SIDE FAMILY ROOM. HOME IS JUST 5 MINUTES TO TURNPIKE, MINUTES TO TURTLE RUN PARK AND 10 MINUTES TO I-95. NEED TLC. .. NEW ROOF NEED.
-
2019-07-29historical
Show marketing remark (245 chars)
THIS HOME WONT LAST AT THIS PRICE FEATURE 3 BEDROOM 2 BATH EXTRA LARGE MASTER BEDROOM WITH DUAL CLOSET AND OVER SIDE FAMILY ROOM. HOME IS JUST 5 MINUTES TO TURNPIKE, MINUTES TO TURTLE RUN PARK AND 10 MINUTES TO I-95. NEED TLC. .. NEW ROOF NEED.
-
2019-07-09$139,900
-
2004-10-29soldstatus $165,000
-
2004-10-26soldstatus $165,000
-
2004-09-01historical
-
2004-07-08$169,900
-
2004-06-17historical
-
2004-06-16soldstatus $126,000
-
2004-06-10soldstatus $126,000
-
2004-06-01historical
-
2004-02-17$139,900
-
2004-02-17$147,900
-
1993-02-12soldstatus $51,300
-
1992-02-21soldstatus $72,500
ⓘ Source: listings_history table (triggers on properties + properties_extension) + one-shot
backfill from property_details.listing_events for pre-trigger history.
Tax reassessment forecast FL · Resets to sale price
- Current annual tax
- $2,538 · $211/mo
- Projected year-2 tax
- $2,538 · $211/mo
- Expected delta
- $0/yr ($0/mo · 0.0%)
ⓘ Screening estimate from a state-policy table — verify with the county assessor before closing.
Climate risk First Street
- Flood 1/10 Low FEMA zone X (unshaded) · 0% chance over 30 yrs
- Wildfire 1/10 Low
- Heat 10/10 Extreme 7 d/yr ≥106°F today · 24 d/yr by 30 yrs out
- Wind 10/10 Extreme 99% chance of damaging wind over 30 yrs
- Air quality 1/10 Low 0 unhealthy d/yr today · 0 by 30 yrs out
Nearby sold comps map
Loading sold comps map…
Walkable amenities ~0.75 mi
Loading nearby amenities…
Taxation est. · year 1
- Rental income
- $34,444
- − Mortgage interest
- −$15,964
- − Property taxes
- −$2,538
- − Insurance
- −$1,425
- − Repairs & maintenance
- −$2,755
- − Management
- −$2,755
- − Depreciation
- −$8,291
- Taxable income
- $714
- Est. tax owed @ 24.0%
- −$171
- After-tax cash flow
- $5,141/yr
For passive investors: Depreciation is non-cash, so a rental often shows a tax loss while cash-flowing — sheltering income. Rental losses are passive: they offset passive income freely, and up to $25,000/yr can offset ordinary (W-2) income if you actively participate and your MAGI is under $100k (phasing out to $0 by $150k); unused losses carry forward. On sale, claimed depreciation is recaptured at up to 25%, and gains may owe capital-gains tax (a 1031 exchange can defer both). Figures are a year-1 estimate at your 24.0% rate — not tax advice; consult a CPA.
Schools (NCES district)
- District
- St. Lucie
- NCES district ID
- 1201770
- Math proficiency
- 40% ▼ -11.00%
- Reading proficiency
- 48% ▼ -4.00%
- Median HH income
- $44,737
- Composite
- 37.28/100
- National rank
- #4449
- State rank
- #51 of 73 in FL
Livability — Port St. Lucie
No livability data for this city. (Only ~50 U.S. cities are tracked.)
Census & demographics
- Census place
- Port St. Lucie, FL
- County
- Saint Lucie County · 337,150 people
- City population
- 221,051
- Metro
- Port St. Lucie, FL
- Population (ZIP)
- 86,875
- Household income
- $85,667
- Rent vs Own
- Severe rent burden
- 857.0
Population outlook (St. Lucie County) Hauer SSP2
- Today (2025)
- 338,016 people
- By 2030
- 355,687 · +5.2%
- By 2040
- 385,521 · +14.1%
- By 2050
- 406,106 · +20.1%
- By 2075
- 441,054 · +30.5%
- By 2100
- 436,885 · +29.2%
Race, ethnicity, and origin ACS 2023
- Neighborhood character
- Diverse neighborhood (Simpson 0.69)
- Race & ethnicity
- White 42% Hispanic / Latino 28% Black 23% Two or more races 15% Asian 2%
- Hispanic origin (detail)
- Mexican 2% Puerto Rican 8% Cuban 4% Dominican 3%
- Common ancestry
- Hispanic 4% Romanian 2% Estonian 2%
- Foreign-born
- 24% · Canada, Jamaica, China
- Languages at home
- 69% English-only · Spanish 19% French/Haitian/Cajun 6% Other Indo-European 3%
Political lean MEDSL · St. Lucie
- 2024 margin
- Lean R (+9.1) · D 45.1% · R 54.2%
- 2008→2024 swing
- -21.2pp toward R · 2008: 12.1pp · 2024: -9.1pp
- All cycles
- 2024: R+9.1 2020: R+1.6 2016: R+2.5 2012: D+7.9 2008: D+12.1
Not yet ingested
- Civics
- —
Market trends
- HPI YoY
- ▼ -44.19%
- Current HPI
- 392.7681
- Rent YoY
- ▲ 0.22%
- Metro
- Port St. Lucie, FL
- State GDP YoY
- ▲ 3.28%
- F500 in state
- 36
Industry mix (Fortune 500 HQ in FL)
| Industry | F500 HQs | Revenue |
|---|---|---|
| Industrial Technology | 2 | $29B |
|
||
| Insurance | 2 | $17B |
|
||
| Retail | 1 | $60B |
|
||
| Technology Distribution | 1 | $58B |
|
||
| Homebuilding | 1 | $35B |
|
||
| Technology Manufacturing | 1 | $35B |
|
||
Price history
+293.1% since first listed25 events — show timeline
- 2026-02-18 Price Changed $285,000 Beaches MLS
- 2025-12-28 Price Changed $300,000 Beaches MLS
- 2025-10-26 Listed $324,900 Beaches MLS
- 2020-06-08 Listing Removed — Beaches MLS
- 2020-01-03 Price Changed $239,000 Beaches MLS
- 2019-12-07 Listed $269,000 Beaches MLS
- 2019-10-04 Sold (Public Records) $141,000 Public Records
- 2019-10-02 Sold (MLS) $141,000 MARMLS
- 2019-09-23 Relisted — MARMLS
- 2019-08-17 Pending — MARMLS
- 2019-07-29 Listing Removed — Beaches MLS
- 2019-07-29 Listed $139,900 MARMLS
- 2019-07-09 Listed $139,900 Beaches MLS
- 2004-10-29 Sold (Public Records) $165,000 Public Records
- 2004-10-26 Sold (MLS) $165,000 Beaches MLS
- 2004-09-01 Listing Removed — Beaches MLS
- 2004-07-08 Listed $169,900 Beaches MLS
- 2004-06-17 Listing Removed — MCRTC
- 2004-06-16 Sold (Public Records) $126,000 Public Records
- 2004-06-10 Sold (MLS) $126,000 Beaches MLS
- 2004-06-01 Listing Removed — Beaches MLS
- 2004-02-17 Listed $147,900 MCRTC
- 2004-02-17 Listed $139,900 Beaches MLS
- 1993-02-12 Sold (Public Records) $51,300 Public Records
- 1992-02-21 Sold (Public Records) $72,500 Public Records
Property tax history
+6.2%/yrLatest (2025): $2,538 · +3.8% YoY. Source: county tax records.
Cash-flow waterfall
monthlySold comps — $/sqft
last 12 mo · ≤1 miLoading sold comps…