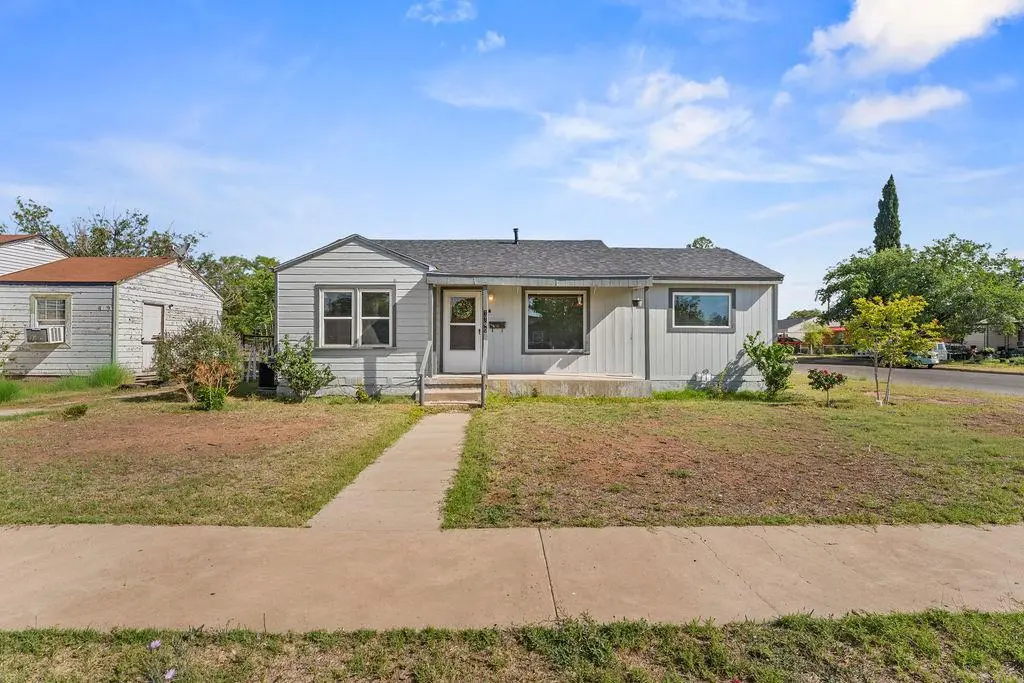
1100 Smith St · Odessa, TX
Flood risk 1/10 · Minimal
- FEMA flood zone
- X (unshaded)
- Chance of flooding over 30 yrs
- 0.0%
- Est. flood insurance / yr
- $507 – $1,088
Fire risk 4/10 · Minor
- Est. fire insurance / yr
- $1,222 – $2,270
Heat risk 6/10 · Moderate
- Hot days now (above 101°F)
- 7 days/yr
- Hot days in 30 yrs
- 20 days/yr
Wind risk 2/10 · Minimal
- Chance of severe wind over 30 yrs
- 2.0%
Air-quality risk 1/10 · Minimal
- Unhealthy air days now
- 0 days/yr
- Unhealthy air days in 30 yrs
- 0 days/yr
Risk factors via First Street. Map © Google.
Why this score? — see what drove the D grade
The composite is a weighted blend of 9 inputs, each scored 0–100. Each bar is that input's sub-score; the figure is the points it added to the 100-point composite (weight × sub-score).
- Cash flow +15.1/30.0
- ARV discount +6.2/15.0
- DSCR +4.6/10.0
- 1% rule +4.5/10.0
- Livability +3.8/5.0
- Rent growth +2.5/5.0
- Condition / age +2.5/5.0
- Schools +2.2/10.0
- Appreciation +0.0/10.0
$214,900
🖨 Deal sheet 📄 Offer letter ✓ Due diligence
Listing remarks MLS
A MUST SEE! This is a complete restoration of a great family home in an established neighborhood. Completely rewired electrical, new plumbing, roof, windows, bathrooms & kitchen! Open floor plan with 2 living areas. Separate laundry and pantry area with rear entrance for easy access. Detached 360 sq. ft. garage/shop painted to match house. Top this off with restored original hard wood floors!
Key facts
- Centrally located
- Beautiful backyard
- 7,405 sq ft lot
Tags
Property features AI
Exterior
- Parking: Detached garage; Parking pad
- Utilities: Public water; Public sewer; Propane available
- Home design: Residential single-family home; Entry on main level
- Construction: Composition roof; Pillar/post/pier foundation
- Exterior features: Landscaped lot; Paved road access; Solar generation
Interior
- Kitchen: Electric range; Dishwasher
- Flooring: Carpet; Tile; Hardwood
- Bathrooms: 2 full bathrooms
- Heating & cooling: Central heating (electric); Central air (electric)
- Interior features: Pantry; Window blinds
- Laundry & utility: Washer hookup; Electric water heater; Dryer
Neighborhood map
What this means for you Summary
Snapshot
- This is a 3-bed/2.0-bath single-family listed at $215k.
Deal economics
- At list price, monthly cash flow is $72 ($865/yr) — positive.
- The deal already cash-flows at list — no discount required.
- To meet the 1% rule (rent ≥ 1% of price), the offer needs to be $204k (5.0% below list).
- Recommended offer: $204k (5.0% below list) — sets the bar for 1% rule.
Location & tenants
- Location reads 75/100 on livability (#132 in TX, #3,928 nationally) — a middle-class / working-renter tenant base. Strengths: cost of living A+, housing A+, health & safety A+; Watch: commute D+, amenities D.
- Ector County ISD (urban): math 22% / reading 27% proficiency, ranked #707 of 826 in TX (top 86%) — low school quality limits family demand, transient renter base, plan for 1-2y turnover.
- Zoned schools: Pease El (589 students, 79% FRL); Crockett Middle (math 21% / reading 19%, grade F, #1,428 of 1,662 statewide, top 87%, 1,036 students, 66% FRL); Odessa H S (math 18% / reading 22%, grade F, #1,397 of 1,632 statewide, top 87%, 3,874 students, 68% FRL) — zoned schools average 71% FRL vs 56% district-wide (15 pts higher); higher-poverty schools than district average — tighter screening recommended.
- Market conditions: 122 active listings in the ZIP; 18 comparable units currently listed for rent nearby; rentals at typical pace (median 21d on market — plan ~3-4 weeks tenant-placement turnaround); 44% of comp listings sitting > 30 days — soft ceiling on asking rent; 1,004 units permitted in Ector County in 2024 (0 in 5+ unit buildings).
- This rent runs 43% of the median local income ($57k/yr) — at the standard rent-burdened threshold; future hikes will face affordability resistance.
Forward outlook
- Local home prices are declining (-3.0%/yr); year-one equity from $1k of loan paydown is wiped out by about $6k of value loss. Plan a longer hold.
- Ector County population projected at +78% by 2050 — long-run rental-demand tailwind backs the buy-and-hold thesis.
Negotiation context
- It's been on market 42 days — a 3% lower offer ($208k) is reasonable based on typical stale-listing flexibility.
- 2 sale attempts since 10y ago; this cycle's ask has dropped $14k (6%) from the opening price — seller is motivated, your offer sets the floor, not the list.
Risks & watch-outs
- Watch-outs: built in 1949 — expect roof / HVAC / electrical / plumbing capex.
- Climate carrying-cost: extreme-heat days projected 7→20/yr by 2055 (HVAC capex compounding) — expect insurance premiums to compound above CPI over the hold.
Questions for the listing agent
- It's been on market 42 days. Have you received any prior offers? Is the seller open to a 5% concession, seller financing, or rate buy-down credit?
- Built in 1949 — when were the roof, HVAC, electrical panel, plumbing, and water heater last replaced?
- Is there a deadline driving the sale (1031 exchange, divorce, estate, relocation)? That informs how much negotiation room exists.
- Schools are F-rated, which usually means shorter tenancies and higher turnover. Who's the typical renter profile here, and what's been the actual vacancy rate?
- The area grade is low — what's the realistic commute time and amenity access for the typical tenant pool here? Any planned neighborhood developments (good or bad) we should know about?
- What's the average days-on-market for RENTAL listings here right now (not sales)? A rising rental-DOM trend means longer vacancies and softer asking-rent achievability than the comps imply.
- What's the recent tenant-quality profile in this submarket — average credit score on applications, eviction rate, late-payment / NSF rate, and stable-employment percentage? A property-management company in the area should have these aggregated.
- How much new for-sale + rental construction is in the pipeline within 1–3 miles? Heavy new supply typically softens prices + rents 12–24 months out; constrained supply supports both.
Investment metrics
- 1% rule
- 0.95% ✗
- Cap rate
- 6.70%
- Cash-on-cash
- 1.44%
- DSCR
- 1.06
- GRM
- 8.8
CMA / ARV
- ARV (median comp)
- $208,854
- List price
- $214,900
- Delta
- 2.89%
- Verdict
- FAIR
- Comps
- 2 within 1.0 mi
Projected returns pro-forma
-3.0% appreciation · 3.0% rent growth · sell at horizon
- IRR
- -14.0%
- Equity multiple
- 0.50×
- Total profit
- $-30,170
- Equity at exit
- $32,042
- IRR
- -5.1%
- Equity multiple
- 0.67×
- Total profit
- $-20,101
- Equity at exit
- $18,581
Cash invested: $60,172 (down + closing). Projections, not guarantees.
Landlord ↔ Tenant lean methodology
- Overall (STATE)
- 87 Strongly Landlord-Friendly
- State Texas
- 87 Strongly Landlord-Friendly · R+5
- County
- — inherits STATE
- City
- — inherits STATE
ZIP-level market 79763
- Active inventory
- 122
- Price-to-rent
- 8.8×
Monthly cashflow live
- Estimated rent
- $2,041 high interval (Pro) →
- Mortgage (P&I)
- −$1,127
- Tax from tax record
- −$324 /mo · $3,885/yr
- Insurance
- −$90
- HOA
- −$0
- Vacancy / Maint / Mgmt
- −$429
- Net cashflow
- $72
Break-even live
UW: 25.0% down · 7.5% · 30yr · 1.5% tax · 5.0% vac · 8.0% maint · 8.0% mgmt
Financing live
Cash to close
- Down payment
- $53,725
- Closing costs
- $6,447
- Reserves months
- —
- Total cash needed
- —
Loan-product check · same deal, 3 products live
Conventional
25% down · 7.5% · 30yr
- Down + closing
- —
- Monthly P&I
- —
- Monthly cashflow
- —
- DSCR
- —
- Eligible?
- —
Personal DTI + credit; lowest rate.
DSCR
20% down · 8.5% · 30yr
- Down + closing
- —
- Monthly P&I
- —
- Monthly cashflow
- —
- DSCR
- —
- Eligible?
- —
No personal income docs; deal must DSCR.
Hard money
10% down · 12.0% · 12mo
- Down + closing
- —
- Monthly P&I
- —
- Monthly cashflow
- —
- DSCR
- —
- Eligible?
- —
Short-term bridge; refi at stabilization.
Rent comps 18 comps
| Address | Beds | Baths | Sqft | Rent | $/sqft | DOM | Units | Dist |
|---|---|---|---|---|---|---|---|---|
| 3107 Merrill Ave Odessa, TX | 4.0 | 2.0 | 1212 | $1,800 | $1.49 | 43d | 1 | 0.46mi |
| 3509 N Golder Ave Odessa, TX | 3.0 | 2.0 | 1216 | $1,700 | $1.40 | 13d | 1 | 0.68mi |
| 200 Santa Rita Dr Odessa, TX | 3.0 | 2.0 | 1438 | $2,400 | $1.67 | 43d | 1 | 0.75mi |
| 237 Orchard Dr Odessa, TX | 4.0 | 2.0 | 1768 | $2,000 | $1.13 | 13d | 1 | 0.77mi |
| 314 Santa Rita Dr Odessa, TX | 3.0 | 2.0 | 2072 | $1,875 | $0.90 | 21d | 1 | 0.80mi |
| 1800 W 23rd St Odessa, TX | 3.0 | 2.5 | 1880 | $2,650 | $1.41 | 43d | 1 | 0.82mi |
| 1604 N Sam Houston Ave Odessa, TX | 2.0 | 1.0 | 1142 | $2,000 | $1.75 | 43d | 1 | 0.85mi |
| 815 W 40th St Odessa, TX | 3.0 | 2.0 | 1216 | $1,800 | $1.48 | 43d | 1 | 0.92mi |
| 3800 N Golder Ave Odessa, TX | 3.0 | 2.0 | 1050 | $1,600 | $1.52 | 21d | 1 | 0.92mi |
| 1322 N Lincoln Ave Odessa, TX | 3.0 | 1.0 | 1218 | $2,200 | $1.81 | 43d | 1 | 1.06mi |
| 1322 N Lincoln Ave Odessa, TX | 3.0 | 1.0 | 1218 | $2,100 | $1.72 | 21d | 1 | 1.06mi |
| 1315 N Jackson Ave Odessa, TX | 3.0 | 2.0 | 1216 | $1,500 | $1.23 | 13d | 1 | 1.21mi |
| 2 Star Cir Odessa, TX | 3.0 | 2.0 | 1377 | $2,200 | $1.60 | 13d | 1 | 1.23mi |
| 2439 W 15th St Odessa, TX | 3.0 | 2.0 | 1175 | $1,500 | $1.28 | 13d | 1 | 1.26mi |
| 1322 Harless Ave Unit 1 Odessa, TX | 2.0 | 1.5 | 1200 | $1,700 | $1.42 | 43d | 1 | 1.34mi |
| 1318 Harless Ave Odessa, TX | 2.0 | 1.5 | 1200 | $1,600 | $1.33 | 21d | 1 | 1.34mi |
| 1220 Adams Ave Unit 4 Odessa, TX | 4.0 | 1.0 | 1063 | $1,750 | $1.65 | 43d | 1 | 1.47mi |
| 715 N Kelly Ave Odessa, TX | 2.0 | 1.0 | 1170 | $2,000 | $1.71 | 21d | 1 | 1.48mi |
Listing history 22 events
-
2026-06-19days on market $214,900 Active 42 DOM
-
2026-06-18days on market $214,900 Active 41 DOM
-
2026-06-17days on market $214,900 Active 40 DOM
-
2026-06-16days on market $214,900 Active 39 DOM
-
2026-06-15days on market $214,900 Active 38 DOM
-
2026-06-14days on market $214,900 Active 36 DOM
-
2026-06-13pricedays on market $214,900 Active 35 DOM
-
2026-06-10days on market $219,000 Active 33 DOM
-
2026-06-09days on market $219,000 Active 32 DOM
-
2026-06-08days on market $219,000 Active 31 DOM
-
2026-06-07days on market $219,000 Active 30 DOM
-
2026-06-03days on market $219,000 Active 25 DOM
-
2026-06-01days on market $219,000 Active 24 DOM
-
2026-05-31days on market $219,000 Active 23 DOM
-
2026-05-30days on market $219,000 Active 22 DOM
-
2026-05-19price $219,000 351-char remark
-
2026-05-16price $225,000 351-char remark
-
2026-05-08$228,900 Active 351-char remark
-
2017-06-08soldstatus
-
2017-06-06soldstatus 401-char remark
Show marketing remark (401 chars)
A MUST SEE! This is a complete restoration of a great family home in an established neighborhood. Completely rewired electrical, new plumbing, roof, windows, bathrooms & kitchen! Open floor plan with 2 living areas. Separate laundry and pantry area with rear entrance for easy access. Detached 360 sq. ft. garage/shop painted to match house. Top this off with restored original hard wood floors!
-
2016-05-03$135,000 401-char remark
Show marketing remark (401 chars)
A MUST SEE! This is a complete restoration of a great family home in an established neighborhood. Completely rewired electrical, new plumbing, roof, windows, bathrooms & kitchen! Open floor plan with 2 living areas. Separate laundry and pantry area with rear entrance for easy access. Detached 360 sq. ft. garage/shop painted to match house. Top this off with restored original hard wood floors!
-
2015-06-26soldstatus
ⓘ Source: listings_history table (triggers on properties + properties_extension) + one-shot
backfill from property_details.listing_events for pre-trigger history.
Tax reassessment forecast TX · Resets to sale price
- Current annual tax
- $3,885 · $324/mo
- Projected year-2 tax
- $3,933 · $328/mo
- Expected delta
- +$48/yr (+$4/mo · 1.2%)
ⓘ Screening estimate from a state-policy table — verify with the county assessor before closing.
Climate risk First Street
- Flood 1/10 Low FEMA zone X (unshaded) · 0% chance over 30 yrs
- Wildfire 4/10 Moderate
- Heat 6/10 Major 7 d/yr ≥101°F today · 20 d/yr by 30 yrs out
- Wind 2/10 Low 2% chance of damaging wind over 30 yrs
- Air quality 1/10 Low 0 unhealthy d/yr today · 0 by 30 yrs out
Nearby sold comps map
Loading sold comps map…
Walkable amenities ~0.75 mi
Loading nearby amenities…
Taxation est. · year 1
- Rental income
- $24,490
- − Mortgage interest
- −$12,038
- − Property taxes
- −$3,885
- − Insurance
- −$1,074
- − Repairs & maintenance
- −$1,959
- − Management
- −$1,959
- − Depreciation
- −$6,252
- Taxable loss
- −$2,677
- Est. tax savings @ 24.0%
- +$642
- After-tax cash flow
- $1,507/yr
For passive investors: Depreciation is non-cash, so a rental often shows a tax loss while cash-flowing — sheltering income. Rental losses are passive: they offset passive income freely, and up to $25,000/yr can offset ordinary (W-2) income if you actively participate and your MAGI is under $100k (phasing out to $0 by $150k); unused losses carry forward. On sale, claimed depreciation is recaptured at up to 25%, and gains may owe capital-gains tax (a 1031 exchange can defer both). Figures are a year-1 estimate at your 24.0% rate — not tax advice; consult a CPA.
Schools (NCES district)
- District
- Ector County ISD
- NCES district ID
- 4818000
- Math proficiency
- 22% ▼ -9.00%
- Reading proficiency
- 27% ▼ -4.00%
- Median HH income
- $52,740
- Composite
- 21.89/100
- National rank
- #8233
- State rank
- #707 of 826 in TX
Livability — Odessa
- Score
- 75/100
- State rank
- #132
- US rank
- #3928
Category grades
Schools grade is shown separately in the Schools card above.
Census & demographics
- Census place
- Odessa, TX
- County
- Ector County · 131,169 people
- City population
- 131,169
- Metro
- Odessa, TX
- Population (ZIP)
- 35,174
- Household income
- $56,877
- Rent vs Own
- Severe rent burden
- 842.0
Population outlook (Ector County) Hauer SSP2
- Today (2025)
- 212,765 people
- By 2030
- 241,962 · +13.7%
- By 2040
- 306,582 · +44.1%
- By 2050
- 379,755 · +78.5%
- By 2075
- 568,991 · +167.4%
- By 2100
- 709,829 · +233.6%
Race, ethnicity, and origin ACS 2023
- Neighborhood character
- Predominantly Hispanic (76%)
- Race & ethnicity
- Hispanic / Latino 76% Two or more races 24% White 19% Black 2%
- Hispanic origin (detail)
- Mexican 72%
- Common ancestry
- Lithuanian 1% Slovak 1%
- Foreign-born
- 22% · Canada
- Languages at home
- 39% English-only · Spanish 60%
Political lean MEDSL · Ector
- 2024 margin
- Solid R (+52.9) · D 23.2% · R 76.1%
- 2008→2024 swing
- -4.9pp toward R · 2008: -48.0pp · 2024: -52.9pp
- All cycles
- 2024: R+52.9 2020: R+47.8 2016: R+40.6 2012: R+48.9 2008: R+48.0
Not yet ingested
- Civics
- —
Market trends
- HPI YoY
- ▼ -213.81%
- Current HPI
- 254.9773
- Rent YoY
- —
- Metro
- Odessa, TX
- State GDP YoY
- ▲ 3.95%
- F500 in state
- 110
Industry mix (Fortune 500 HQ in TX)
| Industry | F500 HQs | Revenue |
|---|---|---|
| Energy | 16 | $1,198B |
|
||
| Technology | 5 | $198B |
|
||
| Engineering / Construction | 4 | $72B |
|
||
| Energy Services | 3 | $60B |
|
||
| Utilities | 3 | $41B |
|
||
| Healthcare | 2 | $330B |
|
||
Price history
+59.2% since first listed8 events — show timeline
- 2026-06-11 Price Changed $214,900 ODMLS
- 2026-05-19 Price Changed $219,000 ODMLS
- 2026-05-16 Price Changed $225,000 ODMLS
- 2026-05-08 Listed $228,900 ODMLS
- 2017-06-08 Sold (Public Records) — Public Records
- 2017-06-06 Sold (MLS) — ODMLS
- 2016-05-03 Listed $135,000 ODMLS
- 2015-06-26 Sold (Public Records) — Public Records
Property tax history
+9.1%/yrLatest (2025): $3,885 · +1.4% YoY. Source: county tax records.
Cash-flow waterfall
monthlySold comps — $/sqft
last 12 mo · ≤1 miLoading sold comps…