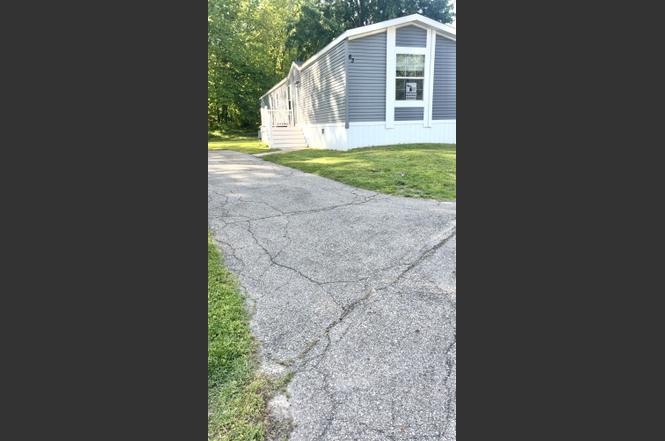
7604 Red Arrow Hwy · Watervliet, MI
Flood risk No data
- FEMA flood zone
- —
- Chance of flooding over 30 yrs
- —
- Est. flood insurance / yr
- —
Fire risk No data
- Est. fire insurance / yr
- —
Heat risk No data
- Hot days now (above threshold)
- —
- Hot days in 30 yrs
- —
Wind risk No data
- Chance of severe wind over 30 yrs
- —
Air-quality risk No data
- Unhealthy air days now
- —
- Unhealthy air days in 30 yrs
- —
Risk factors via First Street. Map © Google.
Why this score? — see what drove the B- grade
The composite is a weighted blend of 9 inputs, each scored 0–100. Each bar is that input's sub-score; the figure is the points it added to the 100-point composite (weight × sub-score).
- Cash flow +30.0/30.0
- 1% rule +10.0/10.0
- DSCR +10.0/10.0
- ARV discount +7.5/15.0
- Livability +3.5/5.0
- Schools +3.1/10.0
- Rent growth +2.5/5.0
- Condition / age +2.5/5.0
- Appreciation +0.0/10.0
$65,000
🖨 Deal sheet (PDF) 📄 Offer letter ✓ Due diligence
Listing remarks
Move in today! 2019 Champion Fortune Gold Star 2. 4 Bedrooms | 2 Bathrooms | Open Concept Design located in a desirable Pleasant View! $2000 floor credit! This well-maintained 2019 Champion Fortune Gold Star 2 offers a spacious open-concept layout and comfortable living throughout. With four bedrooms and two full bathrooms, this home provides plenty of space for families, entertaining, or working from home. The kitchen and living area flow seamlessly together, creating a bright and inviting atmosphere. Included with the home are the washer, dryer, refrigerator, stove, dishwasher, and ceiling fans, making this property truly move-in ready. Home Features: • Central Air Conditioning
Key facts
- Cable ready
- Open concept design
- Built 2019
Tags
Property features AI
Finance
- HOA & community: Homeowners association with a playground
Exterior
- Home design: Ranch-style residence; Residential property
- Construction: Built in 2019; Vinyl siding; Shingle roof
- Exterior features: Public water
Interior
- Kitchen: Dishwasher; Microwave; Oven; Refrigerator
- Bathrooms: Two full bathrooms
- Heating & cooling: Forced air heating; Has cooling
- Interior features: Eight total rooms; Slab basement
- Laundry & utility: Washer; Dryer
Neighborhood map
What this means for you Summary
Snapshot
- This is a 4-bed/2.0-bath other listed at $65k.
Deal economics
- At list price, monthly cash flow is $996 ($12k/yr) — positive.
- The deal already cash-flows at list — no discount required.
- Meets the 1% rule at list price ($2k rent vs $65k).
- Recommended offer: $64k (1.5% below list) — sets the bar for market timing.
- Cap rate 24.7% vs local median 4.2% in Watervliet — top-decile yield for the area; either an underpriced asset or a hidden risk that comps aren't pricing in. Stress-test before assuming the spread holds.
Location & tenants
- Location reads 70/100 on livability (#295 in MI) — a middle-class / working-renter tenant base. Strengths: cost of living A+, health & safety A+, housing A; Watch: employment C-, schools D+, crime D+.
- Watervliet School District (town): math 31% / reading 43% proficiency, ranked #260 of 540 in MI (top 48%) — families likely to look elsewhere, expect single-tenant / working-renter base with shorter leases.
- Market conditions: 81 active listings in the ZIP; 4 comparable units currently listed for rent nearby; rentals lingering (median 45d on market — plan ~5-8 weeks vacancy on turnover, expect pricing pressure); 100% of comp listings sitting > 30 days — soft ceiling on asking rent; 397 units permitted in Berrien County in 2024 (40 in 5+ unit buildings).
Forward outlook
- Local home prices are declining (-3.0%/yr); year-one equity from $449 of loan paydown is wiped out by about $2k of value loss. Plan a longer hold.
- Berrien County population projected at -16% by 2050 — secular population decline; favor cash flow + early exit over multi-decade hold.
- At projected returns (-3.0% appreciation + 3.0% rent growth), your $18k cash investment doubles in ~2 years — after that, you're playing with house money.
Negotiation context
- It's been on market 30 days — a 2% lower offer ($64k) is reasonable based on typical stale-listing flexibility.
- 43 sale attempts since 31y ago; this cycle's ask is 197% above the opening price — seller raised mid-cycle; expect resistance to lowballs.
- Current owner paid $19k; list at $65k implies a 242% gain — meaningful room to come down on a strong offer.
Questions for the listing agent
- Is there a deadline driving the sale (1031 exchange, divorce, estate, relocation)? That informs how much negotiation room exists.
- Schools are D-rated, which usually means shorter tenancies and higher turnover. Who's the typical renter profile here, and what's been the actual vacancy rate?
- Crime grade is D in this area — have there been break-ins, vandalism, or insurance claims at this property in the last 3 years? What carrier currently insures it and at what premium?
- What's the average days-on-market for RENTAL listings here right now (not sales)? A rising rental-DOM trend means longer vacancies and softer asking-rent achievability than the comps imply.
- What's the recent tenant-quality profile in this submarket — average credit score on applications, eviction rate, late-payment / NSF rate, and stable-employment percentage? A property-management company in the area should have these aggregated.
- How much new for-sale + rental construction is in the pipeline within 1–3 miles? Heavy new supply typically softens prices + rents 12–24 months out; constrained supply supports both.
Investment metrics
- 1% rule
- 2.81% ✓
- Cap rate
- 24.67%
- Cash-on-cash
- 65.64%
- DSCR
- 3.92
- GRM
- 3.0
CMA / ARV
No comps found within radius.
Projected returns pro-forma
-3.0% appreciation · 3.0% rent growth · sell at horizon
- IRR
- 64.9%
- Equity multiple
- 3.91×
- Total profit
- $52,899
- Equity at exit
- $9,692
- IRR
- 69.2%
- Equity multiple
- 8.02×
- Total profit
- $127,820
- Equity at exit
- $5,620
Cash invested: $18,200 (down + closing). Projections, not guarantees.
Landlord ↔ Tenant lean methodology
- Overall (STATE)
- 62 Landlord-Friendly
- State Michigan
- 62 Landlord-Friendly · EVEN
- County
- — inherits STATE
- City
- — inherits STATE
ZIP-level market 49098
- Active inventory
- 81
- Price-to-rent
- 3.0×
Monthly cashflow live
- Estimated rent
- $1,829 medium interval (Pro) →
- Mortgage (P&I)
- −$341
- Tax est. 1.5%
- −$81 /mo · $975/yr
- Insurance
- −$27
- HOA
- −$0
- Vacancy / Maint / Mgmt
- −$384
- Net cashflow
- $996
Break-even live
Sensitivity live
| Price | -10% $1,040 | -5% $1,018 | +0% $996 | +5% $973 | +10% $951 |
|---|---|---|---|---|---|
| Rent | -10% $851 | -5% $923 | +0% $996 | +5% $1,068 | +10% $1,140 |
| Rate | -1.0pp $1,028 | -0.5pp $1,012 | base $996 | +0.5pp $979 | +1.0pp $962 |
UW: 25.0% down · 7.5% · 30yr · 1.5% tax · 5.0% vac · 8.0% maint · 8.0% mgmt
Financing live
Cash to close
- Down payment
- $16,250
- Closing costs
- $1,950
- Reserves months
- —
- Total cash needed
- —
Loan-product check · same deal, 3 products live
Conventional
25% down · 7.5% · 30yr
- Down + closing
- —
- Monthly P&I
- —
- Monthly cashflow
- —
- DSCR
- —
- Eligible?
- —
Personal DTI + credit; lowest rate.
DSCR
20% down · 8.5% · 30yr
- Down + closing
- —
- Monthly P&I
- —
- Monthly cashflow
- —
- DSCR
- —
- Eligible?
- —
No personal income docs; deal must DSCR.
Hard money
10% down · 12.0% · 12mo
- Down + closing
- —
- Monthly P&I
- —
- Monthly cashflow
- —
- DSCR
- —
- Eligible?
- —
Short-term bridge; refi at stabilization.
Rent comps 4 comps
| Address | Beds | Baths | Sqft | Rent | $/sqft | DOM | Units | Dist |
|---|---|---|---|---|---|---|---|---|
| 7604 Red Arrow Hwy Watervliet, MI | 2.0–3.0 | 2.0 | 1078 | $1,319 | $1.22 | 44d | 1 | 0.03mi |
| 4020 Sumner Dr Watervliet, MI | 4.0 | 2.0 | 1750 | $2,395 | $1.37 | 44d | 1 | 0.28mi |
| 3882 Watertown Dr Watervliet, MI | 4.0 | 2.0 | 1750 | $2,195 | $1.25 | 44d | 1 | 0.33mi |
| 3866 Watertown Dr Watervliet, MI | 4.0 | 2.0 | 2060 | $2,495 | $1.21 | 44d | 1 | 0.34mi |
Listing history 50 events
-
2026-06-21days on market $65,000 Active 30 DOM
-
2026-06-18days on market $65,000 Active 28 DOM
-
2026-06-17days on market $65,000 Active 27 DOM
-
2026-06-16days on market $65,000 Active 26 DOM
-
2026-06-15days on market $65,000 Active 25 DOM
-
2026-06-13days on market $65,000 Active 23 DOM
-
2026-06-12days on market $65,000 Active 22 DOM
-
2026-06-09days on market $65,000 Active 19 DOM
-
2026-06-08days on market $65,000 Active 18 DOM
-
2026-06-07days on market $65,000 Active 17 DOM
-
2026-06-07days on market $65,000 Active 16 DOM
-
2026-06-04days on market $65,000 Active 13 DOM
-
2026-06-02days on market $65,000 Active 12 DOM
-
2026-06-01days on market $65,000 Active 11 DOM
-
2026-05-31days on market $65,000 Active 10 DOM
-
2026-05-31days on market $65,000 Active 9 DOM
-
2014-09-15historical
-
2014-09-15historical
-
2014-09-15historical
-
2014-09-15historical
-
2014-09-15historical
-
2014-09-15historical
-
2014-09-15historical
-
2014-09-15historical
-
2001-07-10historical
-
2000-09-05soldstatus $19,000
-
2000-09-05soldstatus $19,000
-
2000-08-02$21,900
-
2000-08-02$21,900
-
2000-07-11$42,000
-
2000-07-11$42,000
-
2000-07-06historical
-
2000-04-15historical
-
2000-04-07soldstatus $39,000
-
2000-04-07soldstatus $39,000
-
2000-03-16$39,900
-
2000-03-16$39,900
-
2000-01-07$18,500
-
2000-01-07$18,500
-
2000-01-01historical
-
1999-10-15$10,000
-
1999-10-15$10,000
-
1999-10-01$37,500
-
1999-10-01$37,500
-
1999-08-20$10,000
-
1999-08-20$10,000
-
1999-05-04soldstatus $17,500
-
1999-05-04soldstatus $17,500
-
1999-01-08$18,750
-
1999-01-08$18,750
ⓘ Source: listings_history table (triggers on properties + properties_extension) + one-shot
backfill from property_details.listing_events for pre-trigger history.
Nearby sold comps map
Loading sold comps map…
Walkable amenities ~0.75 mi
Loading nearby amenities…
Taxation est. · year 1
- Rental income
- $21,945
- − Mortgage interest
- −$3,641
- − Property taxes
- −$975
- − Insurance
- −$325
- − Repairs & maintenance
- −$1,756
- − Management
- −$1,756
- − Depreciation
- −$1,891
- Taxable income
- $11,602
- Est. tax owed @ 24.0%
- −$2,784
- After-tax cash flow
- $9,162/yr
For passive investors: Depreciation is non-cash, so a rental often shows a tax loss while cash-flowing — sheltering income. Rental losses are passive: they offset passive income freely, and up to $25,000/yr can offset ordinary (W-2) income if you actively participate and your MAGI is under $100k (phasing out to $0 by $150k); unused losses carry forward. On sale, claimed depreciation is recaptured at up to 25%, and gains may owe capital-gains tax (a 1031 exchange can defer both). Figures are a year-1 estimate at your 24.0% rate — not tax advice; consult a CPA.
Schools (NCES district)
- District
- Watervliet School District
- NCES district ID
- 2635460
- Math proficiency
- 31% ▼ -9.00%
- Reading proficiency
- 43% ▼ -1.00%
- Median HH income
- $42,249
- Composite
- 31.22/100
- National rank
- #6034
- State rank
- #260 of 540 in MI
Livability — Watervliet
- Score
- 70/100
- State rank
- #295
- US rank
- #7373
Category grades
Schools grade is shown separately in the Schools card above.
Census & demographics
- Population (ZIP)
- 5,791
Population outlook (Berrien County) Hauer SSP2
- Today (2025)
- 149,273 people
- By 2030
- 145,211 · -2.7%
- By 2040
- 135,435 · -9.3%
- By 2050
- 125,543 · -15.9%
- By 2075
- 103,986 · -30.3%
- By 2100
- 82,256 · -44.9%
Race, ethnicity, and origin ACS 2023
- Neighborhood character
- Predominantly White (81%)
- Race & ethnicity
- White 81% Hispanic / Latino 9% Black 5% Two or more races 3% Asian 1%
- Hispanic origin (detail)
- Mexican 8%
- Common ancestry
- Iranian 7% Romanian 4% Slovak 2%
- Foreign-born
- 3% · Canada, Vietnam
- Languages at home
- 96% English-only · Spanish 3% French/Haitian/Cajun 0%
Political lean MEDSL · Berrien
- 2024 margin
- Lean R (+7.9) · D 45.4% · R 53.2% · Other 1.4%
- 2008→2024 swing
- -13.3pp toward R · 2008: 5.5pp · 2024: -7.9pp
- All cycles
- 2024: R+7.9 2020: R+7.4 2016: R+12.7 2012: R+6.6 2008: D+5.5
Not yet ingested
- Civics
- —
Market trends
- HPI YoY
- ▼ -223.00%
- Current HPI
- 208.2105
- Rent YoY
- —
- Metro
- —
- State GDP YoY
- ▲ 1.37%
- F500 in state
- 28
Industry mix (Fortune 500 HQ in MI)
| Industry | F500 HQs | Revenue |
|---|---|---|
| Automotive Parts | 3 | $48B |
|
||
| Automotive | 2 | $372B |
|
||
| Chemicals | 1 | $45B |
|
||
| Automotive Retail | 1 | $29B |
|
||
| Healthcare / Medical Devices | 1 | $23B |
|
||
| Automotive Technology | 1 | $20B |
|
||
Price history
+22.6% since first listed85 events — show timeline
- 2014-09-15 Listing Removed — SW Michigan MLS
- 2014-09-15 Listing Removed — SW Michigan MLS
- 2014-09-15 Listing Removed — SW Michigan MLS
- 2014-09-15 Listing Removed — SW Michigan MLS
- 2014-09-15 Listing Removed — SW Michigan MLS
- 2014-09-15 Listing Removed — SW Michigan MLS
- 2014-09-15 Listing Removed — SW Michigan MLS
- 2014-09-15 Listing Removed — SW Michigan MLS
- 2001-07-10 Listing Removed — REALCOMP
- 2000-09-05 Sold (MLS) $19,000 REALCOMP
- 2000-09-05 Sold (MLS) $19,000 SW Michigan MLS
- 2000-08-02 Listed $21,900 REALCOMP
- 2000-08-02 Listed $21,900 SW Michigan MLS
- 2000-07-11 Listed $42,000 REALCOMP
- 2000-07-11 Listed $42,000 SW Michigan MLS
- 2000-07-06 Listing Removed — REALCOMP
- 2000-04-15 Listing Removed — REALCOMP
- 2000-04-07 Sold (MLS) $39,000 REALCOMP
- 2000-04-07 Sold (MLS) $39,000 SW Michigan MLS
- 2000-03-16 Listed $39,900 REALCOMP
- 2000-03-16 Listed $39,900 SW Michigan MLS
- 2000-01-07 Listed $18,500 REALCOMP
- 2000-01-07 Listed $18,500 SW Michigan MLS
- 2000-01-01 Listing Removed — REALCOMP
- 1999-10-15 Listed $10,000 REALCOMP
- 1999-10-15 Listed $10,000 SW Michigan MLS
- 1999-10-01 Listed $37,500 SW Michigan MLS
- 1999-10-01 Listed $37,500 REALCOMP
- 1999-08-20 Listed $10,000 REALCOMP
- 1999-08-20 Listed $10,000 SW Michigan MLS
- 1999-05-04 Sold (MLS) $17,500 REALCOMP
- 1999-05-04 Sold (MLS) $17,500 SW Michigan MLS
- 1999-01-08 Listed $18,750 REALCOMP
- 1999-01-08 Listed $18,750 SW Michigan MLS
- 1998-10-30 Sold (MLS) $16,000 REALCOMP
- 1998-10-30 Sold (MLS) $16,000 SW Michigan MLS
- 1998-06-13 Listing Removed — REALCOMP
- 1998-03-25 Listed $17,900 REALCOMP
- 1998-03-25 Listed $17,900 SW Michigan MLS
- 1998-03-16 Listed $15,500 REALCOMP
- 1998-03-16 Listed $15,500 SW Michigan MLS
- 1998-01-30 Listing Removed — SW Michigan MLS
- 1998-01-30 Listing Removed — REALCOMP
- 1997-12-06 Listing Removed — REALCOMP
- 1997-10-06 Listing Removed — SW Michigan MLS
- 1997-10-06 Listing Removed — REALCOMP
- 1997-08-27 Listed $12,000 SW Michigan MLS
- 1997-08-27 Listed $12,000 REALCOMP
- 1997-08-11 Listed $25,900 SW Michigan MLS
- 1997-08-11 Listed $25,900 REALCOMP
- 1997-06-18 Listed $29,500 REALCOMP
- 1997-06-18 Listed $29,500 SW Michigan MLS
- 1997-02-12 Sold (MLS) $20,946 REALCOMP
- 1997-02-12 Sold (MLS) $20,946 SW Michigan MLS
- 1997-01-31 Listed $22,000 REALCOMP
- 1997-01-31 Listed $22,000 SW Michigan MLS
- 1996-12-20 Sold (MLS) $34,500 REALCOMP
- 1996-12-20 Sold (MLS) $34,500 SW Michigan MLS
- 1996-12-03 Listing Removed — REALCOMP
- 1996-11-15 Sold (MLS) $19,000 REALCOMP
- 1996-11-15 Sold (MLS) $19,000 SW Michigan MLS
- 1996-10-24 Listed $37,900 REALCOMP
- 1996-10-24 Listed $37,900 SW Michigan MLS
- 1996-10-16 Sold (MLS) $12,000 REALCOMP
- 1996-10-16 Sold (MLS) $12,000 SW Michigan MLS
- 1996-10-08 Listing Removed — REALCOMP
- 1996-09-03 Listed $18,500 REALCOMP
- 1996-09-03 Listed $18,500 SW Michigan MLS
- 1996-08-12 Listed $19,500 REALCOMP
- 1996-08-12 Listed $19,500 SW Michigan MLS
- 1996-07-08 Sold (MLS) $22,900 REALCOMP
- 1996-07-08 Sold (MLS) $22,900 SW Michigan MLS
- 1996-06-17 Listed $22,900 REALCOMP
- 1996-06-17 Listed $22,900 SW Michigan MLS
- 1996-04-19 Sold (MLS) $14,000 REALCOMP
- 1996-04-19 Sold (MLS) $14,000 SW Michigan MLS
- 1996-04-16 Listed $19,000 REALCOMP
- 1996-04-16 Listed $19,000 SW Michigan MLS
- 1996-04-08 Listed $15,230 REALCOMP
- 1996-04-08 Listed $15,230 SW Michigan MLS
- 1995-11-30 Sold (MLS) $16,000 REALCOMP
- 1995-11-30 Sold (MLS) $16,000 SW Michigan MLS
- 1995-10-03 Listed $17,900 REALCOMP
- 1995-10-03 Listed $17,900 SW Michigan MLS
- 1995-09-05 Listed $15,500 SW Michigan MLS
Cash-flow waterfall
monthlySold comps — $/sqft
last 12 mo · ≤1 miLoading sold comps…