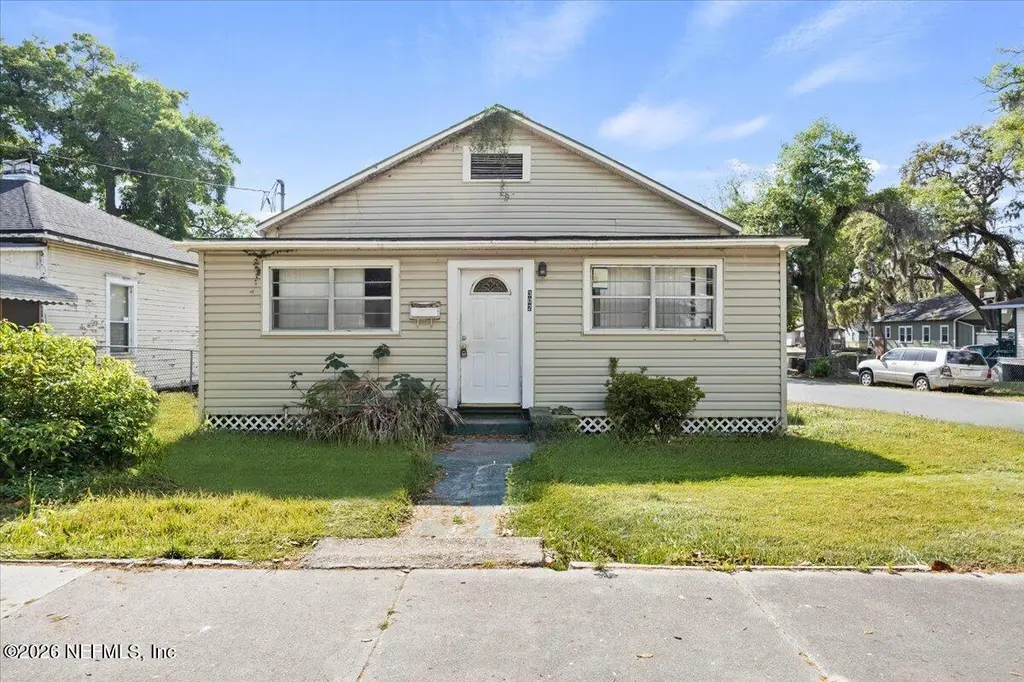
302 Belfort St · Jacksonville, FL
Flood risk 1/10 · Minimal
- FEMA flood zone
- X (unshaded)
- Chance of flooding over 30 yrs
- 0.0%
- Est. flood insurance / yr
- $507 – $1,088
Fire risk 1/10 · Minimal
- Est. fire insurance / yr
- $947 – $1,759
Heat risk 9/10 · Severe
- Hot days now (above 107°F)
- 7 days/yr
- Hot days in 30 yrs
- 20 days/yr
Wind risk 9/10 · Severe
- Chance of severe wind over 30 yrs
- 99.0%
Air-quality risk 5/10 · Moderate
- Unhealthy air days now
- 7 days/yr
- Unhealthy air days in 30 yrs
- 7 days/yr
Risk factors via First Street. Map © Google.
Why this score? — see what drove the B grade
The composite is a weighted blend of 9 inputs, each scored 0–100. Each bar is that input's sub-score; the figure is the points it added to the 100-point composite (weight × sub-score).
- Cash flow +30.0/30.0
- 1% rule +10.0/10.0
- DSCR +10.0/10.0
- ARV discount +7.5/15.0
- Livability +4.2/5.0
- Schools +3.9/10.0
- Rent growth +3.7/5.0
- Condition / age +2.2/5.0
- Appreciation +0.0/10.0
$70,000
🖨 Deal sheet 📄 Offer letter ✓ Due diligence
Listing remarks
This spacious 3-bedroom 1 bathroom home is just waiting for you to make it shine again! This home offers a large kitchen, spacious bedrooms and a convenient location. A great project house to add to your portfolio. No LOI, no blind offers and no assignable contracts. LOI will not receive a response. 1-year transferable termite bond.
Key facts
- 5,227 sq ft lot
- Built 1914
- Listed 40 days
Property features AI
Finance
- HOA & community: Not a senior community
Exterior
- Parking: Off-street parking
- Utilities: Public sewer; Electricity connected; Sewer connected; Water available
- Home design: Single-family residence; Residential use
- Construction: Frame construction
- Exterior features: Corner lot
Interior
- Kitchen: Electric range
- Bedrooms: 3 bedrooms
- Bathrooms: 1 full bathroom
- Heating & cooling: Central heating; Central air
- Interior features: Central heating; Central air
- Laundry & utility: Electric dryer hookup
Neighborhood map
What this means for you Summary
Snapshot
- This is a 3-bed/1.0-bath single-family listed at $70k. Condition is rated fair.
Deal economics
- At list price, monthly cash flow is $834 ($10k/yr) — positive.
- The deal already cash-flows at list — no discount required.
- Meets the 1% rule at list price ($2k rent vs $70k).
- Recommended offer: $68k (3.0% below list) — sets the bar for market timing.
- Cap rate 20.6% vs local median 4.0% in Jacksonville — top-decile yield for the area; either an underpriced asset or a hidden risk that comps aren't pricing in. Stress-test before assuming the spread holds.
Location & tenants
- Location reads 83/100 on livability (#50 in FL, #911 nationally) — a professional / high-income tenant draw. Strengths: amenities A+, commute A+, housing A+.
- Duval (urban): math 46% / reading 45% proficiency, ranked #48 of 73 in FL (top 66%) — families likely to look elsewhere, expect single-tenant / working-renter base with shorter leases.
- Market conditions: Rents rising fast (+4.7%/yr); 75 active listings in the ZIP; 40 comparable units currently listed for rent nearby; rentals at typical pace (median 20d on market — plan ~3-4 weeks tenant-placement turnaround); 6,503 units permitted in Duval County in 2024 (1,131 in 5+ unit buildings).
- This rent runs 31% of the median local income ($65k/yr) — at the standard rent-burdened threshold; future hikes will face affordability resistance.
Forward outlook
- Local home prices are declining (-3.0%/yr); year-one equity from $484 of loan paydown is wiped out by about $2k of value loss. Plan a longer hold.
- Duval County population projected at +19% by 2050 — long-run rental-demand tailwind backs the buy-and-hold thesis.
- At projected returns (-3.0% appreciation + 4.7% rent growth), your $20k cash investment doubles in ~3 years — after that, you're playing with house money.
Negotiation context
- It's been on market 40 days — a 3% lower offer ($68k) is reasonable based on typical stale-listing flexibility.
Risks & watch-outs
- Watch-outs: built in 1914 — expect roof / HVAC / electrical / plumbing capex.
- Climate carrying-cost: severe wind risk, 99% chance of damaging wind over 30y; extreme-heat days projected 7→20/yr by 2055 (HVAC capex compounding) — expect insurance premiums to compound above CPI over the hold.
Questions for the listing agent
- It's been on market 40 days. Have you received any prior offers? Is the seller open to a 3% concession, seller financing, or rate buy-down credit?
- Have any recent inspections been done? Can we get a copy of the seller's disclosures and any deferred-maintenance estimates?
- Built in 1914 — when were the roof, HVAC, electrical panel, plumbing, and water heater last replaced?
- Is there a deadline driving the sale (1031 exchange, divorce, estate, relocation)? That informs how much negotiation room exists.
- Schools are B-rated — typically a magnet for longer-tenancy family renters. What's the average tenant stay here, and is there a school-zone premium baked into asking?
- What's the average days-on-market for RENTAL listings here right now (not sales)? A rising rental-DOM trend means longer vacancies and softer asking-rent achievability than the comps imply.
- What's the recent tenant-quality profile in this submarket — average credit score on applications, eviction rate, late-payment / NSF rate, and stable-employment percentage? A property-management company in the area should have these aggregated.
- How much new for-sale + rental construction is in the pipeline within 1–3 miles? Heavy new supply typically softens prices + rents 12–24 months out; constrained supply supports both.
Investment metrics
- 1% rule
- 2.38% ✓
- Cap rate
- 20.59%
- Cash-on-cash
- 51.07%
- DSCR
- 3.27
- GRM
- 3.5
CMA / ARV
- ARV (on-the-fly)
- $368,368
- Comps found
- 12
Show comp detail 12 sales within ~0.75 mi
| Address | Dist | Beds/Ba | Sqft | Sold | Price | $/sf | Match |
|---|---|---|---|---|---|---|---|
| 2562 Summit St | 0.16mi | 3/2.0 | 1,268 (-13%) | 3mo | $205,000 | $162 | 65 |
| 2165 Gilmore St | 0.48mi | 3/2.5 | 1,446 (-1%) | 10mo | $455,000 | $315 | 62 |
| 598 Florence St | 0.58mi | 3/2.5 | 1,426 (-2%) | 10mo | $270,000 | $189 | 55 |
| 2231 Dellwood Ave | 0.59mi | 3/2.0 | 1,574 (+8%) | 0mo | $475,000 | $302 | 54 |
| 2664 Ernest St | 0.61mi | 3/2.0 | 1,361 (-6%) | 4mo | $295,000 | $217 | 54 |
| 2331 Myra St | 0.65mi | 3/1.0 | 1,280 (-12%) | 1mo | $366,000 | $286 | 49 |
| 2111 Myra St | 0.68mi | 3/1.0 | 1,304 (-10%) | 7mo | $275,000 | $211 | 45 |
| 2669 Ernest St | 0.59mi | 3/2.0 | 1,324 (-9%) | 13mo | $335,000 | $253 | 42 |
| 2224 Dellwood Ave | 0.62mi | 3/1.5 | 1,674 (+15%) | 3mo | $275,000 | $164 | 42 |
| 2580 Dellwood Ave | 0.64mi | 3/2.0 | 1,611 (+11%) | 9mo | $435,000 | $270 | 41 |
| 2594 Haldumar Ter | 0.74mi | 2/1.0 (-1) | 1,260 (-14%) | 3mo | $285,000 | $226 | 36 |
| 2138 Ernest St | 0.58mi | 2/2.0 (-1) | 1,245 (-14%) | 8mo | $389,000 | $312 | 34 |
Match score weights: distance 35% · size 25% · config 20% · recency 20%. Top-matched comps best support the ARV.
Projected returns pro-forma
-3.0% appreciation · 4.69% rent growth · sell at horizon
- IRR
- 50.8%
- Equity multiple
- 3.28×
- Total profit
- $44,691
- Equity at exit
- $10,437
- IRR
- 56.9%
- Equity multiple
- 7.11×
- Total profit
- $119,676
- Equity at exit
- $6,052
Cash invested: $19,600 (down + closing). Projections, not guarantees.
Landlord ↔ Tenant lean methodology
- Overall (STATE)
- 87 Strongly Landlord-Friendly
- State Florida
- 87 Strongly Landlord-Friendly · R+3
- County
- — inherits STATE
- City
- — inherits STATE
ZIP-level market 32204
- Home prices YoY
- -28.2%
- Rents YoY
- 4.7%
- Active inventory
- 75
- Price-to-rent
- 3.5×
Monthly cashflow live
- Estimated rent
- $1,668 high interval (Pro) →
- Mortgage (P&I)
- −$367
- Tax est. 1.5%
- −$88 /mo · $1,050/yr
- Insurance
- −$29
- HOA
- −$0
- Vacancy / Maint / Mgmt
- −$350
- Net cashflow
- $834
Break-even live
UW: 25.0% down · 7.5% · 30yr · 1.5% tax · 5.0% vac · 8.0% maint · 8.0% mgmt
Financing live
Cash to close
- Down payment
- $17,500
- Closing costs
- $2,100
- Reserves months
- —
- Total cash needed
- —
Loan-product check · same deal, 3 products live
Conventional
25% down · 7.5% · 30yr
- Down + closing
- —
- Monthly P&I
- —
- Monthly cashflow
- —
- DSCR
- —
- Eligible?
- —
Personal DTI + credit; lowest rate.
DSCR
20% down · 8.5% · 30yr
- Down + closing
- —
- Monthly P&I
- —
- Monthly cashflow
- —
- DSCR
- —
- Eligible?
- —
No personal income docs; deal must DSCR.
Hard money
10% down · 12.0% · 12mo
- Down + closing
- —
- Monthly P&I
- —
- Monthly cashflow
- —
- DSCR
- —
- Eligible?
- —
Short-term bridge; refi at stabilization.
Rent comps 40 comps
| Address | Beds | Baths | Sqft | Rent | $/sqft | DOM | Units | Dist |
|---|---|---|---|---|---|---|---|---|
| 346 Acosta St Jacksonville, FL | 4.0 | 3.5 | 1536 | $1,600 | $1.04 | 23d | 1 | 0.15mi |
| 371 Smith St Jacksonville, FL | 3.0 | 2.0 | 1050 | $1,325 | $1.26 | 4d | 1 | 0.29mi |
| 2526 Phyllis St Jacksonville, FL | 3.0 | 2.0 | 1300 | $1,800 | $1.38 | 23d | 1 | 0.42mi |
| 2561 Rosselle St #1 Jacksonville, FL | 3.0 | 3.0 | 1287 | $1,395 | $1.08 | 23d | 1 | 0.46mi |
| 420 Sunshine St Jacksonville, FL | 3.0 | 2.0 | 1050 | $1,350 | $1.29 | 1d | 1 | 0.55mi |
| 715 Ralph St Jacksonville, FL | 4.0 | 2.0 | 1338 | $2,195 | $1.64 | 4d | 1 | 0.63mi |
| 1923 Broadway Ave Jacksonville, FL | 3.0 | 2.0 | 1230 | $1,421 | $1.16 | 23d | 1 | 0.66mi |
| 717 King St Jacksonville, FL | 3.0 | 2.0 | 1132 | $1,800 | $1.59 | 17d | 1 | 0.66mi |
| 2012 Baldwin St Jacksonville, FL | 3.0 | 2.0 | 1232 | $1,445 | $1.17 | 23d | 1 | 0.67mi |
| 2614 Dellwood Ave Jacksonville, FL | 3.0 | 1.0 | 1122 | $2,325 | $2.07 | 4d | 1 | 0.67mi |
| 2002 Ernest St Unit A Jacksonville, FL | 2.0 | 1.0 | 1000 | $1,795 | $1.79 | 13d | 1 | 0.68mi |
| 2044 Dellwood Ave Jacksonville, FL | 2.0 | 1.0 | 1375 | $1,825 | $1.33 | 23d | 1 | 0.71mi |
| 2309 College St Jacksonville, FL | 2.0 | 1.0 | 1200 | $1,200 | $1.00 | 13d | 1 | 0.75mi |
| 2701 Myra St Jacksonville, FL | 3.0 | 1.0 | 1065 | $1,595 | $1.50 | 21d | 1 | 0.75mi |
| 2759 Dellwood Ave Jacksonville, FL | 3.0 | 2.0 | 1080 | $2,100 | $1.94 | 19d | 1 | 0.76mi |
| 2578 Haldumar Ter Jacksonville, FL | 2.0 | 1.0 | 1114 | $2,195 | $1.97 | 14d | 1 | 0.77mi |
| 1979 Yulee St Jacksonville, FL | 3.0 | 2.0 | 1050 | $1,500 | $1.43 | 23d | 1 | 0.78mi |
| 2136 College St #4 Jacksonville, FL | 2.0 | 1.0 | 900 | $1,250 | $1.39 | 23d | 1 | 0.80mi |
| 1751 Broadway Ave Jacksonville, FL | 2.0 | 1.0 | 1000 | $1,525 | $1.52 | 4d | 1 | 0.83mi |
| 2812 Ernest St Jacksonville, FL | 3.0 | 1.0 | 1461 | $2,800 | $1.92 | 23d | 1 | 0.85mi |
| 2657 Post St Apt 2 Jacksonville, FL | 3.0 | 1.0 | 1100 | $1,700 | $1.55 | 2d | 1 | 0.88mi |
| 1607 Logan St Jacksonville, FL | 4.0 | 2.0 | 1232 | $1,800 | $1.46 | 23d | 1 | 0.90mi |
| 2803 College St Jacksonville, FL | 2.0 | 1.0 | 1100 | $1,550 | $1.41 | 13d | 1 | 0.92mi |
| 3035 Fitzgerald St Jacksonville, FL | 2.0 | 1.0 | 900 | $1,021 | $1.13 | 2d | 1 | 0.94mi |
| 226 Spruce St Jacksonville, FL | 4.0 | 2.0 | 1196 | $1,148 | $0.96 | 2d | 1 | 0.94mi |
| 1545 Union St W Jacksonville, FL | 3.0 | 2.0 | 1253 | $1,400 | $1.12 | 2d | 1 | 0.95mi |
| 2410 McQuade St Jacksonville, FL | 3.0 | 2.0 | 1307 | $1,425 | $1.09 | 23d | 1 | 0.96mi |
| 2777 Post St Jacksonville, FL | 2.0 | 1.0 | 1200 | $1,195 | $1.00 | 23d | 1 | 0.96mi |
| 1539 Union St W Jacksonville, FL | 3.0 | 1.5 | 1000 | $1,144 | $1.14 | 13d | 1 | 0.96mi |
| 2185 Kingston St Jacksonville, FL | 3.0 | 2.0 | 1230 | $1,381 | $1.12 | 23d | 1 | 0.96mi |
| 2154 Placeda St Jacksonville, FL | 4.0 | 1.5 | 1124 | $1,500 | $1.33 | 21d | 1 | 0.97mi |
| 2589 Park St Unit 2589 Jacksonville, FL | 2.0 | 1.0 | 1354 | $1,850 | $1.37 | 23d | 1 | 0.97mi |
| 2980 Ernest St Jacksonville, FL | 2.0 | 1.0 | 920 | $1,200 | $1.30 | 23d | 1 | 1.01mi |
| 3118 Dignan St Jacksonville, FL | 4.0 | 2.0 | 1103 | $1,148 | $1.04 | 1d | 1 | 1.03mi |
| 1448 Union St W Jacksonville, FL | 3.0 | 1.0 | 958 | $1,200 | $1.25 | 23d | 1 | 1.04mi |
| 1145 N Canal St Jacksonville, FL | 2.0 | 2.0 | 1184 | $1,396 | $1.18 | 2d | 1 | 1.05mi |
| 1470 Windle St Jacksonville, FL | 3.0 | 2.0 | 1170 | $1,425 | $1.22 | 14d | 1 | 1.05mi |
| 1943 Hardee St #1 Jacksonville, FL | 3.0 | 2.0 | 1622 | $1,248 | $0.77 | 3d | 1 | 1.05mi |
| 1710 W 2nd St Unit A Jacksonville, FL | 2.0 | 1.0 | 939 | $800 | $0.85 | 23d | 1 | 1.06mi |
| 809 McDuff Ave S Jacksonville, FL | 2.0 | 1.0 | 1006 | $995 | $0.99 | 4d | 1 | 1.06mi |
Listing history 16 events
-
2026-06-18days on market $70,000 Active 40 DOM
-
2026-06-17price $70,000 Active 39 DOM
-
2026-06-17days on market $75,000 Active 39 DOM
-
2026-06-16days on market $75,000 Active 38 DOM
-
2026-06-15days on market $75,000 Active 37 DOM
-
2026-06-13days on market $75,000 Active 34 DOM
-
2026-06-10remarks 334-char remark
-
2026-06-10days on market $75,000 Active 31 DOM
-
2026-06-08days on market $75,000 Active 30 DOM
-
2026-06-07days on market $75,000 Active 29 DOM
-
2026-06-05days on market $75,000 Active 26 DOM
-
2026-06-03days on market $75,000 Active 25 DOM
-
2026-06-02days on market $75,000 Active 24 DOM
-
2026-06-01days on market $75,000 Active 23 DOM
-
2026-05-31days on market $75,000 Active 22 DOM
-
2026-05-08$75,000 Active
ⓘ Source: listings_history table (triggers on properties + properties_extension) + one-shot
backfill from property_details.listing_events for pre-trigger history.
Climate risk First Street
- Flood 1/10 Low FEMA zone X (unshaded) · 0% chance over 30 yrs
- Wildfire 1/10 Low
- Heat 9/10 Extreme 7 d/yr ≥107°F today · 20 d/yr by 30 yrs out
- Wind 9/10 Extreme 99% chance of damaging wind over 30 yrs
- Air quality 5/10 Major 7 unhealthy d/yr today · 7 by 30 yrs out
Nearby sold comps map
Loading sold comps map…
Walkable amenities ~0.75 mi
Loading nearby amenities…
Taxation est. · year 1
- Rental income
- $20,018
- − Mortgage interest
- −$3,921
- − Property taxes
- −$1,050
- − Insurance
- −$350
- − Repairs & maintenance
- −$1,601
- − Management
- −$1,601
- − Depreciation
- −$2,036
- Taxable income
- $9,458
- Est. tax owed @ 24.0%
- −$2,270
- After-tax cash flow
- $7,739/yr
For passive investors: Depreciation is non-cash, so a rental often shows a tax loss while cash-flowing — sheltering income. Rental losses are passive: they offset passive income freely, and up to $25,000/yr can offset ordinary (W-2) income if you actively participate and your MAGI is under $100k (phasing out to $0 by $150k); unused losses carry forward. On sale, claimed depreciation is recaptured at up to 25%, and gains may owe capital-gains tax (a 1031 exchange can defer both). Figures are a year-1 estimate at your 24.0% rate — not tax advice; consult a CPA.
Condition & rehab AI · 12 photos
This home requires moderate renovations, including painting the exterior siding and updating the kitchen and bathroom. It has a good foundation and structure, and updating these areas can significantly increase its resale and rental value.
Repairs flagged
- Major Exterior siding — Weathered and could benefit from repainting.
- Minor Interior walls — Could use touch-up painting.
- Minor Kitchen cabinets — May need updating.
- Minor Bathroom — May need updates.
- Minor Landscaping — Could benefit from some maintenance and updates.
Value-add opportunities
- Resale Painting exterior siding — Fresh paint can significantly improve curb appeal and home value.
- Resale Updating kitchen cabinets — Modernizing the kitchen can attract more buyers.
- Resale Updating bathroom — A modern bathroom can enhance the home's appeal and value.
- Rental Landscaping maintenance — Well-maintained landscaping can attract tenants and increase rental value.
- Both Interior painting — Fresh paint can improve the home's appearance and attract both buyers and tenants.
Renovation cost estimate screening
| Repair item | Severity | Est. cost |
|---|---|---|
| Exterior siding · Weathered and could benefit from repainting. | Major | $15,000–50,000 |
| Interior walls · Could use touch-up painting. | Minor | $500–3,000 |
| Kitchen cabinets · May need updating. | Minor | $500–3,000 |
| Bathroom · May need updates. | Minor | $500–3,000 |
| Landscaping · Could benefit from some maintenance and updates. | Minor | $500–3,000 |
| Total estimated repair cost · 5 items | $17,000–62,000 |
Value-add ROI direction
- Resale Painting exterior siding — Fresh paint can significantly improve curb appeal and home value. ↑
- Resale Updating kitchen cabinets — Modernizing the kitchen can attract more buyers. ↑
- Resale Updating bathroom — A modern bathroom can enhance the home's appeal and value. ↑
- Rental Landscaping maintenance — Well-maintained landscaping can attract tenants and increase rental value. ↑
- Both Interior painting — Fresh paint can improve the home's appearance and attract both buyers and tenants. ↑
ⓘ Cost ranges are severity-bucket heuristics (US national rule-of-thumb). Get contractor quotes + a written scope before underwriting a rehab budget.
Schools (NCES district)
- District
- Duval
- NCES district ID
- 1200480
- Math proficiency
- 46% ▼ -11.00%
- Reading proficiency
- 45% ▼ -4.00%
- Median HH income
- $48,987
- Composite
- 38.97/100
- National rank
- #4076
- State rank
- #48 of 73 in FL
Livability — Jacksonville
- Score
- 83/100
- State rank
- #50
- US rank
- #911
Category grades
Schools grade is shown separately in the Schools card above.
Census & demographics
- Census place
- Jacksonville, FL
- County
- Duval County · 1,015,274 people
- City population
- 979,034
- Metro
- Jacksonville, FL
- Population (ZIP)
- 9,151
- Household income
- $65,063
- Rent vs Own
- Severe rent burden
- 866.0
Population outlook (Duval County) Hauer SSP2
- Today (2025)
- 1,013,010 people
- By 2030
- 1,059,228 · +4.6%
- By 2040
- 1,141,439 · +12.7%
- By 2050
- 1,205,258 · +19.0%
- By 2075
- 1,324,282 · +30.7%
- By 2100
- 1,319,620 · +30.3%
Race, ethnicity, and origin ACS 2023
- Neighborhood character
- Diverse neighborhood (Simpson 0.60)
- Race & ethnicity
- White 55% Black 30% Hispanic / Latino 6% Asian 6% Two or more races 6%
- Hispanic origin (detail)
- Mexican 3% Puerto Rican 1%
- Common ancestry
- Slovak 2% Lithuanian 2% Italian 1%
- Foreign-born
- 7% · China, Canada, Philippines
- Languages at home
- 92% English-only · Spanish 3% Chinese 2% Other Asian/Pacific 2%
Political lean MEDSL · Duval
- 2024 margin
- Toss-up / Even · D 48.7% · R 50.1% · Other 1.2%
- 2008→2024 swing
- +0.4pp no change · 2008: -1.9pp · 2024: -1.5pp
- All cycles
- 2024: R+1.5 2020: D+3.8 2016: R+1.5 2012: R+3.6 2008: R+1.9
Not yet ingested
- Civics
- —
Market trends
- HPI YoY
- ▼ -123.96%
- Current HPI
- 316.3185
- Rent YoY
- ▲ 4.69%
- Metro
- Jacksonville, FL
- State GDP YoY
- ▲ 3.28%
- F500 in state
- 36
Industry mix (Fortune 500 HQ in FL)
| Industry | F500 HQs | Revenue |
|---|---|---|
| Industrial Technology | 2 | $29B |
|
||
| Insurance | 2 | $17B |
|
||
| Retail | 1 | $60B |
|
||
| Technology Distribution | 1 | $58B |
|
||
| Homebuilding | 1 | $35B |
|
||
| Technology Manufacturing | 1 | $35B |
|
||
Price history
1 event — show timeline
- 2026-05-08 Listed $75,000 realMLS
Cash-flow waterfall
monthlySold comps — $/sqft
last 12 mo · ≤1 miLoading sold comps…