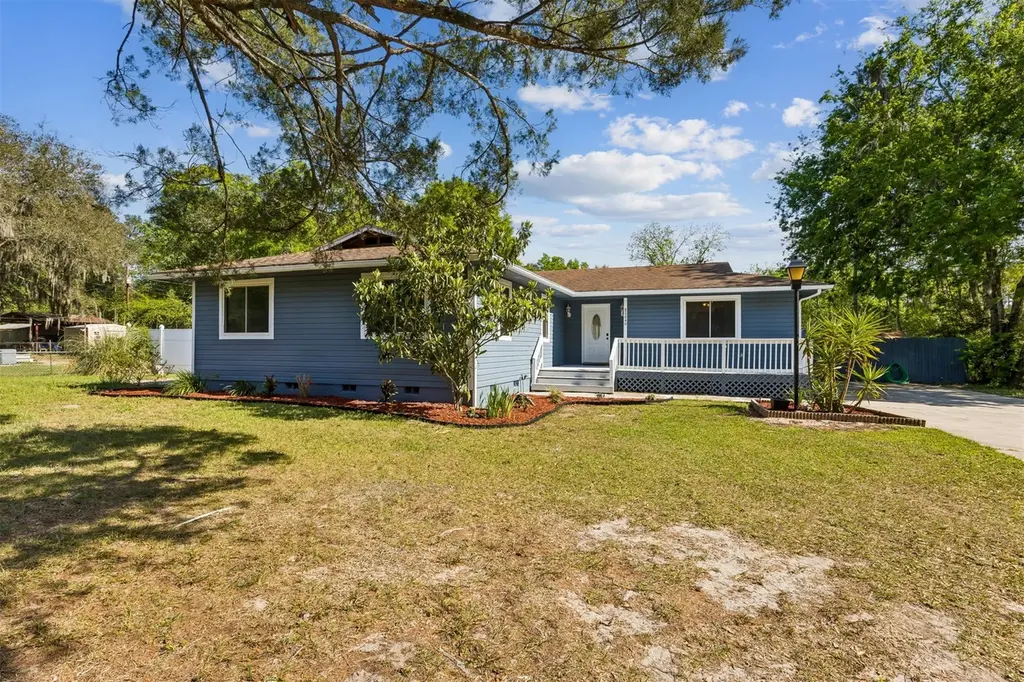
86040 Clyde St · Yulee, FL
Flood risk 1/10 · Minimal
- FEMA flood zone
- X (unshaded)
- Chance of flooding over 30 yrs
- 0.0%
- Est. flood insurance / yr
- $507 – $1,088
Fire risk 7/10 · Major
- Est. fire insurance / yr
- $947 – $1,759
Heat risk 9/10 · Severe
- Hot days now (above 106°F)
- 7 days/yr
- Hot days in 30 yrs
- 20 days/yr
Wind risk 9/10 · Severe
- Chance of severe wind over 30 yrs
- 99.0%
Air-quality risk 5/10 · Moderate
- Unhealthy air days now
- 6 days/yr
- Unhealthy air days in 30 yrs
- 7 days/yr
Risk factors via First Street. Map © Google.
Why this score? — see what drove the D grade
The composite is a weighted blend of 9 inputs, each scored 0–100. Each bar is that input's sub-score; the figure is the points it added to the 100-point composite (weight × sub-score).
- Appreciation +10.0/10.0
- Cash flow +7.0/30.0
- Schools +6.0/10.0
- ARV discount +5.5/15.0
- Livability +3.3/5.0
- Rent growth +3.2/5.0
- Condition / age +2.5/5.0
- 1% rule +1.4/10.0
- DSCR +1.2/10.0
$369,000
🖨 Deal sheet (PDF) 📄 Offer letter ✓ Due diligence
Listing remarks
Newly renovated 4-bedroom home with an in-ground swimming pool. Home includes new flooring, countertops, and appliances. This home has been freshly painted inside and outside and features beautiful landscaping in the front yard. A new pool pump was recently added. No HOA or CDD fees. Conveniently located to shopping, restaurants, Amelia Island beaches, JAX airport, and zoned for an A-rated school district.
Key facts
- 0.29 acre lot
- Parking
- Pool
Neighborhood map
What this means for you Summary
Snapshot
- This is a 4-bed/2.0-bath single-family listed at $369k.
Deal economics
- At list price, monthly cash flow is $-543 ($-7k/yr) — negative.
- To cash-flow at today's rent, offer at most $273k (26.0% below list).
- To meet the 1% rule (rent ≥ 1% of price), the offer needs to be $235k (36.3% below list).
- Recommended offer: $235k (36.3% below list) — sets the bar for 1% rule.
- Cap rate 4.5% vs local median 3.3% in Yulee — top-decile yield for the area; either an underpriced asset or a hidden risk that comps aren't pricing in. Stress-test before assuming the spread holds.
Location & tenants
- Location reads 66/100 on livability (#605 in FL) — a middle-class / working-renter tenant base. Strengths: housing A+, cost of living A-, crime B+; Watch: amenities F, commute F, health & safety F.
- Nassau (town): math 74% / reading 65% proficiency, ranked #4 of 73 in FL (top 6%) — acceptable for families but not a draw, mixed tenant base, ~2y average lease.
- Market conditions: Rents rising (+2.9%/yr); 601 active listings in the ZIP; 6 comparable units currently listed for rent nearby; rentals at typical pace (median 26d on market — plan ~3-4 weeks tenant-placement turnaround); solid renter incomes; 953 units permitted in Nassau County in 2024 (24 in 5+ unit buildings).
- This rent runs 30% of the median local income ($93k/yr) — at the standard rent-burdened threshold; future hikes will face affordability resistance.
Forward outlook
- In year one you build about $39k of equity ($3k loan paydown + $37k appreciation (10.0% local appreciation)).
- Nassau County population projected at +17% by 2050 — long-run rental-demand tailwind backs the buy-and-hold thesis.
- By year 2, paydown + projected appreciation supports a ~$63k cash-out refi (75% LTV) — recoverable capital for the next deal without selling this one.
Negotiation context
- Only 7 days on market — expect competitive offers; lowballing is unlikely to land.
- 2 sale attempts with the ask held roughly flat each time — persistent listings suggest the price (not the market) is what's stuck; bring a comps-based counter.
- Current owner paid $134k; list at $369k implies a 175% gain — meaningful room to come down on a strong offer.
Risks & watch-outs
- Climate carrying-cost: severe wind risk, 99% chance of damaging wind over 30y; major wildfire risk; extreme-heat days projected 7→20/yr by 2055 (HVAC capex compounding) — expect insurance premiums to compound above CPI over the hold.
Questions for the listing agent
- What do current leases actually rent for vs. the listed asking? Can we see a recent rent roll and the last 12 months of T-12 income?
- Is there a deadline driving the sale (1031 exchange, divorce, estate, relocation)? That informs how much negotiation room exists.
- Schools are B-rated — typically a magnet for longer-tenancy family renters. What's the average tenant stay here, and is there a school-zone premium baked into asking?
- The area grade is low — what's the realistic commute time and amenity access for the typical tenant pool here? Any planned neighborhood developments (good or bad) we should know about?
- What's the average days-on-market for RENTAL listings here right now (not sales)? A rising rental-DOM trend means longer vacancies and softer asking-rent achievability than the comps imply.
- What's the recent tenant-quality profile in this submarket — average credit score on applications, eviction rate, late-payment / NSF rate, and stable-employment percentage? A property-management company in the area should have these aggregated.
- How much new for-sale + rental construction is in the pipeline within 1–3 miles? Heavy new supply typically softens prices + rents 12–24 months out; constrained supply supports both.
Investment metrics
- 1% rule
- 0.64% ✗
- Cap rate
- 4.53%
- Cash-on-cash
- -6.31%
- DSCR
- 0.72
- GRM
- 13.1
CMA / ARV
- ARV (on-the-fly)
- $353,124
- Comps found
- 9
Show comp detail 9 sales within ~0.75 mi
| Address | Dist | Beds/Ba | Sqft | Sold | Price | $/sf | Match |
|---|---|---|---|---|---|---|---|
| 86148 Venetian Ave | 0.71mi | 3/2.0 (-1) | 1,685 (-3%) | 2mo | $335,000 | $199 | 56 |
| 86195 Venetian Ave | 0.70mi | 3/2.5 (-1) | 1,685 (-3%) | 2mo | $349,900 | $208 | 54 |
| 86254 Page Dairy Rd | 0.16mi | 3/2.0 (-1) | 1,482 (-14%) | 15mo | $419,000 | $283 | 51 |
| 86095 Venetian Ave | 0.68mi | 3/2.0 (-1) | 1,611 (-7%) | 4mo | $300,000 | $186 | 49 |
| 86090 Venetian Ave | 0.71mi | 3/2.0 (-1) | 1,718 (-1%) | 23mo | $350,000 | $204 | 42 |
| 86073 Venetian Ave | 0.68mi | 3/2.0 (-1) | 1,582 (-9%) | 16mo | $320,000 | $202 | 35 |
| 86097 Caesars Ave | 0.71mi | 3/2.0 (-1) | 1,588 (-8%) | 18mo | $312,500 | $197 | 33 |
| 86175 Venetian Ave | 0.69mi | 3/2.0 (-1) | 1,528 (-12%) | 17mo | $335,000 | $219 | 29 |
| 86040 Venetian Ave | 0.72mi | 3/3.0 (-1) | 1,492 (-14%) | 23mo | $337,000 | $226 | 15 |
Match score weights: distance 35% · size 25% · config 20% · recency 20%. Top-matched comps best support the ARV.
Projected returns pro-forma
10.0% appreciation · 2.88% rent growth · sell at horizon
- IRR
- 19.8%
- Equity multiple
- 2.61×
- Total profit
- $166,028
- Equity at exit
- $332,424
- IRR
- 18.1%
- Equity multiple
- 5.99×
- Total profit
- $515,449
- Equity at exit
- $716,886
Cash invested: $103,320 (down + closing). Projections, not guarantees.
Landlord ↔ Tenant lean methodology
- Overall (STATE)
- 87 Strongly Landlord-Friendly
- State Florida
- 87 Strongly Landlord-Friendly · R+3
- County
- — inherits STATE
- City
- — inherits STATE
ZIP-level market 32097
- Home prices YoY
- 19.5%
- Rents YoY
- 2.9%
- Active inventory
- 601
- Price-to-rent
- 13.1×
Monthly cashflow live
- Estimated rent
- $2,350 high interval (Pro) →
- Mortgage (P&I)
- −$1,935
- Tax from tax record
- −$311 /mo · $3,734/yr
- Insurance
- −$154
- HOA
- −$0
- Vacancy / Maint / Mgmt
- −$494
- Net cashflow
- $-543
Break-even live
Sensitivity live
| Price | -10% $-334 | -5% $-439 | +0% $-543 | +5% $-648 | +10% $-752 |
|---|---|---|---|---|---|
| Rent | -10% $-729 | -5% $-636 | +0% $-543 | +5% $-450 | +10% $-358 |
| Rate | -1.0pp $-357 | -0.5pp $-449 | base $-543 | +0.5pp $-639 | +1.0pp $-736 |
UW: 25.0% down · 7.5% · 30yr · 1.5% tax · 5.0% vac · 8.0% maint · 8.0% mgmt
Financing live
Cash to close
- Down payment
- $92,250
- Closing costs
- $11,070
- Reserves months
- —
- Total cash needed
- —
Loan-product check · same deal, 3 products live
Conventional
25% down · 7.5% · 30yr
- Down + closing
- —
- Monthly P&I
- —
- Monthly cashflow
- —
- DSCR
- —
- Eligible?
- —
Personal DTI + credit; lowest rate.
DSCR
20% down · 8.5% · 30yr
- Down + closing
- —
- Monthly P&I
- —
- Monthly cashflow
- —
- DSCR
- —
- Eligible?
- —
No personal income docs; deal must DSCR.
Hard money
10% down · 12.0% · 12mo
- Down + closing
- —
- Monthly P&I
- —
- Monthly cashflow
- —
- DSCR
- —
- Eligible?
- —
Short-term bridge; refi at stabilization.
Rent comps 6 comps
| Address | Beds | Baths | Sqft | Rent | $/sqft | DOM | Units | Dist |
|---|---|---|---|---|---|---|---|---|
| 86114 Harry Green Rd Yulee, FL | 3.0 | 1.0 | 1158 | $1,600 | $1.38 | 19d | 1 | 0.52mi |
| 86040 Hopper Ln Yulee, FL | 3.0 | 2.0 | 1664 | $1,650 | $0.99 | 19d | 1 | 0.85mi |
| 86131 Hopper Ln Yulee, FL | 3.0 | 2.0 | 1664 | $1,650 | $0.99 | 25d | 1 | 0.95mi |
| 86229 Mainline Rd Yulee, FL | 3.0 | 2.0 | 1219 | $2,195 | $1.80 | 25d | 1 | 1.15mi |
| 86215 Buggy Ct Yulee, FL | 3.0 | 2.0 | 1675 | $2,295 | $1.37 | 22d | 1 | 1.25mi |
| 86467 Moonlit Walk Cir Yulee, FL | 4.0 | 3.0 | 2010 | $3,100 | $1.54 | 25d | 1 | 1.32mi |
Listing history 5 events
-
2026-04-09status Pending
-
2026-04-02$369,000 Active
-
2025-06-12price $299,000
-
2025-05-14$311,000 Active
-
2003-09-12soldstatus $134,000
ⓘ Source: listings_history table (triggers on properties + properties_extension) + one-shot
backfill from property_details.listing_events for pre-trigger history.
Tax reassessment forecast FL · Resets to sale price
- Current annual tax
- $3,734 · $311/mo
- Projected year-2 tax
- $3,734 · $311/mo
- Expected delta
- $0/yr ($0/mo · 0.0%)
ⓘ Screening estimate from a state-policy table — verify with the county assessor before closing.
Climate risk First Street
- Flood 1/10 Low FEMA zone X (unshaded) · 0% chance over 30 yrs
- Wildfire 7/10 Severe
- Heat 9/10 Extreme 7 d/yr ≥106°F today · 20 d/yr by 30 yrs out
- Wind 9/10 Extreme 99% chance of damaging wind over 30 yrs
- Air quality 5/10 Major 6 unhealthy d/yr today · 7 by 30 yrs out
Nearby sold comps map
Loading sold comps map…
Walkable amenities ~0.75 mi
Loading nearby amenities…
Taxation est. · year 1
- Rental income
- $28,204
- − Mortgage interest
- −$20,670
- − Property taxes
- −$3,734
- − Insurance
- −$1,845
- − Repairs & maintenance
- −$2,256
- − Management
- −$2,256
- − Depreciation
- −$10,735
- Taxable loss
- −$13,292
- Est. tax savings @ 24.0%
- +$3,190
- After-tax cash flow
- $-3,329/yr
For passive investors: Depreciation is non-cash, so a rental often shows a tax loss while cash-flowing — sheltering income. Rental losses are passive: they offset passive income freely, and up to $25,000/yr can offset ordinary (W-2) income if you actively participate and your MAGI is under $100k (phasing out to $0 by $150k); unused losses carry forward. On sale, claimed depreciation is recaptured at up to 25%, and gains may owe capital-gains tax (a 1031 exchange can defer both). Figures are a year-1 estimate at your 24.0% rate — not tax advice; consult a CPA.
Schools (NCES district)
- District
- Nassau
- NCES district ID
- 1201350
- Math proficiency
- 74% ▼ -2.00%
- Reading proficiency
- 65% ▼ -2.00%
- Median HH income
- $58,267
- Composite
- 59.79/100
- National rank
- #899
- State rank
- #4 of 73 in FL
Livability — Yulee
- Score
- 66/100
- State rank
- #605
- US rank
- #11615
Category grades
Schools grade is shown separately in the Schools card above.
Census & demographics
- Census place
- Yulee, FL
- County
- Nassau County · 67,729 people
- City population
- 979,034
- Metro
- Jacksonville, FL
- Population (ZIP)
- 26,700
- Household income
- $93,161
- Rent vs Own
- Severe rent burden
- 404.0
Population outlook (Nassau County) Hauer SSP2
- Today (2025)
- 88,419 people
- By 2030
- 92,679 · +4.8%
- By 2040
- 99,257 · +12.3%
- By 2050
- 103,378 · +16.9%
- By 2075
- 109,726 · +24.1%
- By 2100
- 107,006 · +21.0%
Race, ethnicity, and origin ACS 2023
- Neighborhood character
- Predominantly White (75%)
- Race & ethnicity
- White 75% Two or more races 9% Black 9% Hispanic / Latino 8% Asian 1% Native American 1%
- Hispanic origin (detail)
- Mexican 2% Puerto Rican 2%
- Common ancestry
- Lithuanian 4% Italian 3% Romanian 2%
- Foreign-born
- 4% · Canada, Vietnam
- Languages at home
- 93% English-only · Spanish 5% Vietnamese 1%
Political lean MEDSL · Nassau
- 2024 margin
- Solid R (+46.9) · D 26.1% · R 73.1%
- 2008→2024 swing
- -3.1pp toward R · 2008: -43.8pp · 2024: -46.9pp
- All cycles
- 2024: R+46.9 2020: R+45.9 2016: R+50.2 2012: R+48.6 2008: R+43.8
Not yet ingested
- Civics
- —
Market trends
- HPI YoY
- ▲ 49.35%
- Current HPI
- 301.9299
- Rent YoY
- ▲ 2.88%
- Metro
- Jacksonville, FL
- State GDP YoY
- ▲ 3.28%
- F500 in state
- 36
Industry mix (Fortune 500 HQ in FL)
| Industry | F500 HQs | Revenue |
|---|---|---|
| Industrial Technology | 2 | $29B |
|
||
| Insurance | 2 | $17B |
|
||
| Retail | 1 | $60B |
|
||
| Technology Distribution | 1 | $58B |
|
||
| Homebuilding | 1 | $35B |
|
||
| Technology Manufacturing | 1 | $35B |
|
||
Price history
+175.4% since first listed5 events — show timeline
- 2026-04-09 Pending — AINCAR
- 2026-04-02 Listed $369,000 AINCAR
- 2025-06-12 Price Changed $299,000 AINCAR
- 2025-05-14 Listed $311,000 AINCAR
- 2003-09-12 Sold (Public Records) $134,000 Public Records
Property tax history
+13.4%/yrLatest (2025): $3,734 · +5.7% YoY. Source: county tax records.
Cash-flow waterfall
monthlySold comps — $/sqft
last 12 mo · ≤1 miLoading sold comps…