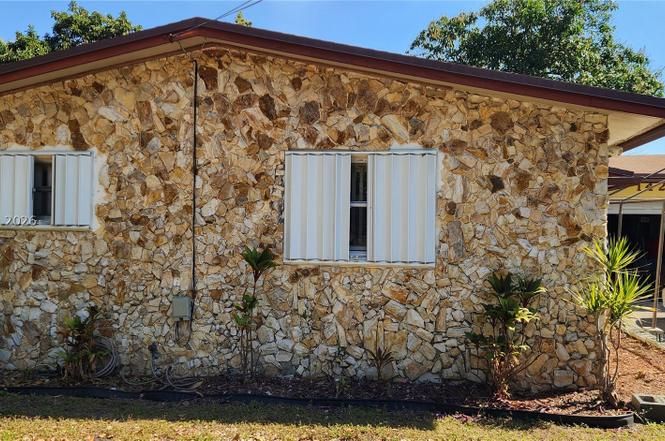
142 NW 8th Ave · Dania Beach, FL
Flood risk 1/10 · Minimal
- FEMA flood zone
- X (unshaded)
- Chance of flooding over 30 yrs
- 0.0%
- Est. flood insurance / yr
- $507 – $1,088
Fire risk 3/10 · Minor
- Est. fire insurance / yr
- $947 – $1,759
Heat risk 10/10 · Severe
- Hot days now (above 105°F)
- 7 days/yr
- Hot days in 30 yrs
- 27 days/yr
Wind risk 10/10 · Severe
- Chance of severe wind over 30 yrs
- 99.0%
Air-quality risk 2/10 · Minimal
- Unhealthy air days now
- 1 days/yr
- Unhealthy air days in 30 yrs
- 1 days/yr
Risk factors via First Street. Map © Google.
Why this score? — see what drove the B grade
The composite is a weighted blend of 9 inputs, each scored 0–100. Each bar is that input's sub-score; the figure is the points it added to the 100-point composite (weight × sub-score).
- Cash flow +30.0/30.0
- 1% rule +10.0/10.0
- DSCR +10.0/10.0
- ARV discount +7.5/15.0
- Schools +4.1/10.0
- Livability +3.9/5.0
- Condition / age +2.5/5.0
- Rent growth +2.1/5.0
- Appreciation +0.0/10.0
$190,000
🖨 Deal sheet 📄 Offer letter ✓ Due diligence
Listing remarks
PLEASE DO NOT DISTURB TENANTS OR SHOW UP ONSITE WITHOUT PRIORT AUTHORIZATION. ANY UNAUTHORIZED VISITS WILL BE CONSIDERED TRESSPASSING. Unapproved short sale –Cash or hard money only. Property needs repairs and updates throughout. Deferred maintenance present. Interior and exterior improvements required. The kitchen and bathrooms would benefit from upgrading. Buyer to conduct their own inspections and verify all information. Buyer to assume IF any liens, violations, and lender-required repairs. DO NOT DISTURB OWNERS. NO CALLS. Email ONLY for all inquiries. Calls will NOT be answered.
Key facts
- 5,420 sq ft lot
- Parking
- Built 1973
Neighborhood map
What this means for you Summary
Snapshot
- This is a 3-bed/1.0-bath single-family listed at $190k.
Deal economics
- At list price, monthly cash flow is $1k ($13k/yr) — positive.
- The deal already cash-flows at list — no discount required.
- Meets the 1% rule at list price ($3k rent vs $190k).
- Cap rate 13.1% vs local median 3.9% in Dania Beach — top-decile yield for the area; either an underpriced asset or a hidden risk that comps aren't pricing in. Stress-test before assuming the spread holds.
Location & tenants
- Location reads 77/100 on livability (#180 in FL, #2,806 nationally) — a middle-class / working-renter tenant base. Strengths: commute A+, cost of living A, housing A; Watch: schools D, employment D, amenities F.
- Broward (suburban): math 42% / reading 53% proficiency, ranked #46 of 73 in FL (top 63%) — families likely to look elsewhere, expect single-tenant / working-renter base with shorter leases.
- Market conditions: Rents soft (-1.7%/yr); 209 active listings in the ZIP; 40 comparable units currently listed for rent nearby; rentals at typical pace (median 22d on market — plan ~3-4 weeks tenant-placement turnaround); 2,111 units permitted in Broward County in 2024 (1,265 in 5+ unit buildings).
- At $2,908/mo this rent would consume 66% of the median local household income ($53k/yr) (locally 1999% of renters already pay >50% of income on rent) — very limited rent-growth headroom before tenants either downsize or default.
Forward outlook
- Local home prices are declining (-3.0%/yr); year-one equity from $1k of loan paydown is wiped out by about $6k of value loss. Plan a longer hold.
- Broward County population projected at +34% by 2050 — long-run rental-demand tailwind backs the buy-and-hold thesis.
- At projected returns (-3.0% appreciation + 0.0% rent growth), your $53k cash investment doubles in ~6 years — after that, you're playing with house money.
Negotiation context
- Only 6 days on market — expect competitive offers; lowballing is unlikely to land.
- 2 sale attempts with the ask held roughly flat each time — persistent listings suggest the price (not the market) is what's stuck; bring a comps-based counter.
- Current owner paid $80k; list at $190k implies a 138% gain — meaningful room to come down on a strong offer.
Risks & watch-outs
- Climate carrying-cost: severe wind risk, 99% chance of damaging wind over 30y; extreme-heat days projected 7→27/yr by 2055 (HVAC capex compounding) — expect insurance premiums to compound above CPI over the hold.
Questions for the listing agent
- Built in 1973 — when were the roof, HVAC, electrical panel, plumbing, and water heater last replaced?
- Is there a deadline driving the sale (1031 exchange, divorce, estate, relocation)? That informs how much negotiation room exists.
- Schools are D-rated, which usually means shorter tenancies and higher turnover. Who's the typical renter profile here, and what's been the actual vacancy rate?
- What's the average days-on-market for RENTAL listings here right now (not sales)? A rising rental-DOM trend means longer vacancies and softer asking-rent achievability than the comps imply.
- What's the recent tenant-quality profile in this submarket — average credit score on applications, eviction rate, late-payment / NSF rate, and stable-employment percentage? A property-management company in the area should have these aggregated.
- How much new for-sale + rental construction is in the pipeline within 1–3 miles? Heavy new supply typically softens prices + rents 12–24 months out; constrained supply supports both.
Investment metrics
- 1% rule
- 1.53% ✓
- Cap rate
- 13.11%
- Cash-on-cash
- 24.34%
- DSCR
- 2.08
- GRM
- 5.4
CMA / ARV
- ARV (on-the-fly)
- $575,736
- Comps found
- 4
Show comp detail 4 sales within ~0.75 mi
| Address | Dist | Beds/Ba | Sqft | Sold | Price | $/sf | Match |
|---|---|---|---|---|---|---|---|
| 601 NW 7th St | 0.32mi | 2/2.0 (-1) | 1,132 (-12%) | 2mo | $580,000 | $512 | 55 |
| 206 NE 2nd Pl | 0.47mi | 3/2.0 | 1,388 (+8%) | 16mo | $510,000 | $367 | 48 |
| 114 NE 2nd Pl | 0.41mi | 3/2.0 | 1,420 (+10%) | 16mo | $635,000 | $447 | 46 |
| 837 NW 10th Ave | 0.53mi | 3/2.0 | 1,480 (+15%) | 11mo | $589,000 | $398 | 38 |
Match score weights: distance 35% · size 25% · config 20% · recency 20%. Top-matched comps best support the ARV.
Projected returns pro-forma
-3.0% appreciation · 0.0% rent growth · sell at horizon
- IRR
- 14.3%
- Equity multiple
- 1.55×
- Total profit
- $29,415
- Equity at exit
- $28,330
- IRR
- 20.8%
- Equity multiple
- 2.53×
- Total profit
- $81,137
- Equity at exit
- $16,428
Cash invested: $53,200 (down + closing). Projections, not guarantees.
Landlord ↔ Tenant lean methodology
- Overall (STATE)
- 87 Strongly Landlord-Friendly
- State Florida
- 87 Strongly Landlord-Friendly · R+3
- County
- — inherits STATE
- City
- — inherits STATE
ZIP-level market 33004
- Rents YoY
- -1.7%
- Active inventory
- 209
- Price-to-rent
- 5.4×
Monthly cashflow live
- Estimated rent
- $2,908 high interval (Pro) →
- Mortgage (P&I)
- −$996
- Tax from tax record
- −$142 /mo · $1,706/yr
- Insurance
- −$79
- HOA
- −$0
- Vacancy / Maint / Mgmt
- −$611
- Net cashflow
- $1,079
Break-even live
UW: 25.0% down · 7.5% · 30yr · 1.5% tax · 5.0% vac · 8.0% maint · 8.0% mgmt
Financing live
Cash to close
- Down payment
- $47,500
- Closing costs
- $5,700
- Reserves months
- —
- Total cash needed
- —
Loan-product check · same deal, 3 products live
Conventional
25% down · 7.5% · 30yr
- Down + closing
- —
- Monthly P&I
- —
- Monthly cashflow
- —
- DSCR
- —
- Eligible?
- —
Personal DTI + credit; lowest rate.
DSCR
20% down · 8.5% · 30yr
- Down + closing
- —
- Monthly P&I
- —
- Monthly cashflow
- —
- DSCR
- —
- Eligible?
- —
No personal income docs; deal must DSCR.
Hard money
10% down · 12.0% · 12mo
- Down + closing
- —
- Monthly P&I
- —
- Monthly cashflow
- —
- DSCR
- —
- Eligible?
- —
Short-term bridge; refi at stabilization.
Rent comps 40 comps
| Address | Beds | Baths | Sqft | Rent | $/sqft | DOM | Units | Dist |
|---|---|---|---|---|---|---|---|---|
| 116 NW 6th Ave Dania, FL | 3.0 | 2.0 | 1324 | $3,500 | $2.64 | 24d | 1 | 0.15mi |
| 117 NW 11th Ave Dania, FL | 2.0 | 2.0 | 1550 | $2,200 | $1.42 | 22d | 1 | 0.17mi |
| 1106 NW 2nd St Dania, FL | 2.0 | 1.0 | 1264 | $2,100 | $1.66 | 20d | 1 | 0.17mi |
| 6 SW 7th Ave Dania Beach, FL | 2.0 | 1.0 | 1100 | $1,750 | $1.59 | 24d | 1 | 0.29mi |
| 250 NW 14th Way Unit 250 Dania Beach, FL | 3.0 | 1.0 | 1023 | $3,000 | $2.93 | 24d | 1 | 0.34mi |
| 29 SW 8th Ave Unit 1 Dania Beach, FL | 2.0 | 1.0 | 1610 | $1,800 | $1.12 | 24d | 1 | 0.34mi |
| 529 NW 8th St Dania, FL | 3.0 | 2.0 | 1680 | $3,650 | $2.17 | 24d | 1 | 0.36mi |
| 22 NW 14th Ave Dania, FL | 2.0 | 2.0 | 976 | $2,800 | $2.87 | 24d | 1 | 0.37mi |
| 101 NE 2nd Pl Dania, FL | 3.0 | 2.0 | 1346 | $3,500 | $2.60 | 24d | 1 | 0.40mi |
| 701 SW 1st St Unit 1 Dania Beach, FL | 2.0 | 1.0 | 1200 | $1,950 | $1.62 | 17d | 1 | 0.41mi |
| 110 SW 7th Ave Unit 2 Dania Beach, FL | 2.0 | 1.0 | 1575 | $1,900 | $1.21 | 7d | 1 | 0.42mi |
| 4 N Federal Hwy Dania, FL | 3.0 | 1.0–2.0 | 852 | $3,565 | $4.18 | 1d | 39 | 0.44mi |
| 947 Nautilus Isle Dania, FL | 2.0 | 2.0 | 1579 | $4,500 | $2.85 | 24d | 1 | 0.47mi |
| 101 SW 1st St Dania Beach, FL | 1.0–2.0 | 1.0–2.0 | 967 | $4,080 | $4.22 | 2d | 41 | 0.48mi |
| 213 Stirling Rd Dania, FL | 4.0 | 2.0 | 1660 | $2,600 | $1.57 | 24d | 1 | 0.54mi |
| 414 SW 2nd Ter Dania, FL | 2.0 | 1.0 | 1680 | $1,800 | $1.07 | 22d | 1 | 0.55mi |
| 120 N Compass Way Dania, FL | 1.0–3.0 | 1.0–2.0 | 982 | $3,478 | $3.54 | 24d | 1 | 0.58mi |
| 150 S Bryan Rd Dania, FL | 3.0 | 1.0–2.0 | 865 | $3,501 | $4.05 | 2d | 25 | 0.59mi |
| 212 SW 2nd Pl Unit 1258734P Dania Beach, FL | 2.0 | 2.5 | 1259 | $6,253 | $4.97 | 3d | 1 | 0.60mi |
| 121 N Compass Way Dania, FL | 1.0–2.0 | 1.0–2.0 | 871 | $3,010 | $3.45 | 24d | 3 | 0.62mi |
| 1424 Nautilus Isle Dania, FL | 3.0 | 2.0 | 1454 | $4,500 | $3.09 | 24d | 1 | 0.64mi |
| 115 SE 2nd St Unit 1 Dania Beach, FL | 2.0 | 1.0 | 1150 | $2,400 | $2.09 | 24d | 1 | 0.65mi |
| 211 SE 1st Ter Dania, FL | 3.0 | 2.0 | 1200 | $3,500 | $2.92 | 20d | 1 | 0.65mi |
| 241 SW 1st Ave Unit 1-2 Dania Beach, FL | 2.0 | 1.0 | 1450 | $2,200 | $1.52 | 5d | 1 | 0.67mi |
| 1453 NW 10th St #1 Dania Beach, FL | 2.0 | 1.0 | 1684 | $2,900 | $1.72 | 24d | 1 | 0.70mi |
| 241 SW 3rd Ter Dania, FL | 3.0 | 2.0 | 1163 | $3,100 | $2.67 | 5d | 1 | 0.71mi |
| 208 SW 3rd Pl Dania, FL | 2.0 | 1.0 | 952 | $2,300 | $2.42 | 24d | 1 | 0.75mi |
| 753 SW 3rd Pl Unit 753 Dania Beach, FL | 3.0 | 2.0 | 1014 | $2,800 | $2.76 | 14d | 1 | 0.76mi |
| 730 SW 4th St Unit A Dania Beach, FL | 2.0 | 1.0 | 1745 | $2,100 | $1.20 | 24d | 1 | 0.77mi |
| 357 Phippen Rd Unit 1-2 Dania Beach, FL | 2.0 | 1.0 | 1864 | $2,300 | $1.23 | 20d | 1 | 0.77mi |
| 141 SE 3rd Ave #203 Dania, FL | 2.0 | 2.0 | 1190 | $2,500 | $2.10 | 24d | 1 | 0.78mi |
| 367 Phippen Waiters Rd Unit back Dania Beach, FL | 2.0 | 1.0 | 1864 | $2,300 | $1.23 | 3d | 1 | 0.79mi |
| 369 Phippen Waiters Rd Unit 1 Dania Beach, FL | 2.0 | 1.0 | 1266 | $1,950 | $1.54 | 24d | 1 | 0.80mi |
| 369 Phippen Waiters Rd Unit Front Dania Beach, FL | 2.0 | 1.0 | 1266 | $1,900 | $1.50 | 20d | 1 | 0.80mi |
| 369 Phippen Waiters Rd Unit 1 Dania Beach, FL | 2.0 | 1.0 | 1266 | $1,900 | $1.50 | 3d | 1 | 0.80mi |
| 2000 Stirling Rd Hollywood, FL | 1.0–3.0 | 1.0–2.0 | 993 | $4,027 | $4.06 | 2d | 19 | 0.82mi |
| 253 SW 4th St Dania Beach, FL | 3.0 | 2.5 | 1530 | $4,300 | $2.81 | 3d | 1 | 0.83mi |
| 500 NE 2nd St Dania, FL | 1.0–2.0 | 1.0–2.0 | 850 | $2,000 | $2.35 | 24d | 6 | 0.86mi |
| 500 NE 2nd St Dania, FL | 1.0–2.0 | 1.0–2.0 | 850 | $2,000 | $2.35 | 12d | 6 | 0.86mi |
| 500 NE 2nd St Dania, FL | 1.0–2.0 | 1.0–2.0 | 850 | $1,950 | $2.29 | 10d | 4 | 0.86mi |
Listing history 9 events
-
2026-03-12status Pending
-
2026-03-06historical
-
2026-02-20price $424,900
-
2026-02-12$190,000 Active
-
2026-02-11$489,500 Active
-
2000-10-18soldstatus $80,000
-
1998-12-09soldstatus $100,000
-
1995-12-27soldstatus $73,000
-
1995-10-10soldstatus $26,200
ⓘ Source: listings_history table (triggers on properties + properties_extension) + one-shot
backfill from property_details.listing_events for pre-trigger history.
Tax reassessment forecast FL · Resets to sale price
- Current annual tax
- $1,706 · $142/mo
- Projected year-2 tax
- $1,706 · $142/mo
- Expected delta
- $0/yr ($0/mo · 0.0%)
ⓘ Screening estimate from a state-policy table — verify with the county assessor before closing.
Climate risk First Street
- Flood 1/10 Low FEMA zone X (unshaded) · 0% chance over 30 yrs
- Wildfire 3/10 Moderate
- Heat 10/10 Extreme 7 d/yr ≥105°F today · 27 d/yr by 30 yrs out
- Wind 10/10 Extreme 99% chance of damaging wind over 30 yrs
- Air quality 2/10 Low 1 unhealthy d/yr today · 1 by 30 yrs out
Nearby sold comps map
Loading sold comps map…
Walkable amenities ~0.75 mi
Loading nearby amenities…
Taxation est. · year 1
- Rental income
- $34,891
- − Mortgage interest
- −$10,643
- − Property taxes
- −$1,706
- − Insurance
- −$950
- − Repairs & maintenance
- −$2,791
- − Management
- −$2,791
- − Depreciation
- −$5,527
- Taxable income
- $10,482
- Est. tax owed @ 24.0%
- −$2,516
- After-tax cash flow
- $10,436/yr
For passive investors: Depreciation is non-cash, so a rental often shows a tax loss while cash-flowing — sheltering income. Rental losses are passive: they offset passive income freely, and up to $25,000/yr can offset ordinary (W-2) income if you actively participate and your MAGI is under $100k (phasing out to $0 by $150k); unused losses carry forward. On sale, claimed depreciation is recaptured at up to 25%, and gains may owe capital-gains tax (a 1031 exchange can defer both). Figures are a year-1 estimate at your 24.0% rate — not tax advice; consult a CPA.
Schools (NCES district)
- District
- Broward
- NCES district ID
- 1200180
- Math proficiency
- 42% ▼ -18.00%
- Reading proficiency
- 53% ▼ -5.00%
- Median HH income
- $52,139
- Composite
- 40.88/100
- National rank
- #3621
- State rank
- #46 of 73 in FL
Livability — Dania Beach
- Score
- 77/100
- State rank
- #180
- US rank
- #2806
Category grades
Schools grade is shown separately in the Schools card above.
Census & demographics
- Census place
- Dania Beach, FL
- County
- Broward County · 1,963,430 people
- City population
- 17,094
- Metro
- Miami-Fort Lauderdale-Pompano Beach, FL
- Population (ZIP)
- 17,094
- Household income
- $52,574
- Rent vs Own
- Severe rent burden
- 1999.0
Population outlook (Broward County) Hauer SSP2
- Today (2025)
- 2,207,033 people
- By 2030
- 2,360,704 · +7.0%
- By 2040
- 2,661,208 · +20.6%
- By 2050
- 2,946,698 · +33.5%
- By 2075
- 3,602,273 · +63.2%
- By 2100
- 3,970,984 · +79.9%
Race, ethnicity, and origin ACS 2023
- Neighborhood character
- Diverse neighborhood (Simpson 0.68)
- Race & ethnicity
- White 42% Hispanic / Latino 28% Black 24% Two or more races 19% Asian 1%
- Hispanic origin (detail)
- Puerto Rican 5% Cuban 7% Dominican 3%
- Common ancestry
- Romanian 3% Lithuanian 2% Hispanic 2%
- Foreign-born
- 28% · Canada, Jamaica, China
- Languages at home
- 60% English-only · Spanish 25% Other Indo-European 4% French/Haitian/Cajun 4%
Political lean MEDSL · Broward
- 2024 margin
- D (+17.0) · D 58.0% · R 41.0%
- 2008→2024 swing
- -17.8pp toward R · 2008: 34.7pp · 2024: 17.0pp
- All cycles
- 2024: D+17.0 2020: D+29.8 2016: D+35.0 2012: D+34.9 2008: D+34.7
Not yet ingested
- Civics
- —
Market trends
- HPI YoY
- ▼ -377.03%
- Current HPI
- 335.6607
- Rent YoY
- ▼ -1.66%
- Metro
- Miami-Fort Lauderdale-Pompano Beach, FL
- State GDP YoY
- ▲ 3.28%
- F500 in state
- 36
Industry mix (Fortune 500 HQ in FL)
| Industry | F500 HQs | Revenue |
|---|---|---|
| Industrial Technology | 2 | $29B |
|
||
| Insurance | 2 | $17B |
|
||
| Retail | 1 | $60B |
|
||
| Technology Distribution | 1 | $58B |
|
||
| Homebuilding | 1 | $35B |
|
||
| Technology Manufacturing | 1 | $35B |
|
||
Price history
+1521.8% since first listed9 events — show timeline
- 2026-03-12 Pending — MARMLS
- 2026-03-06 Listing Removed — Beaches MLS
- 2026-02-20 Price Changed $424,900 Beaches MLS
- 2026-02-12 Listed $190,000 MARMLS
- 2026-02-11 Listed $489,500 Beaches MLS
- 2000-10-18 Sold (Public Records) $80,000 Public Records
- 1998-12-09 Sold (Public Records) $100,000 Public Records
- 1995-12-27 Sold (Public Records) $73,000 Public Records
- 1995-10-10 Sold (Public Records) $26,200 Public Records
Property tax history
-1.6%/yrLatest (2025): $1,706 · +5.7% YoY. Source: county tax records.
Cash-flow waterfall
monthlySold comps — $/sqft
last 12 mo · ≤1 miLoading sold comps…