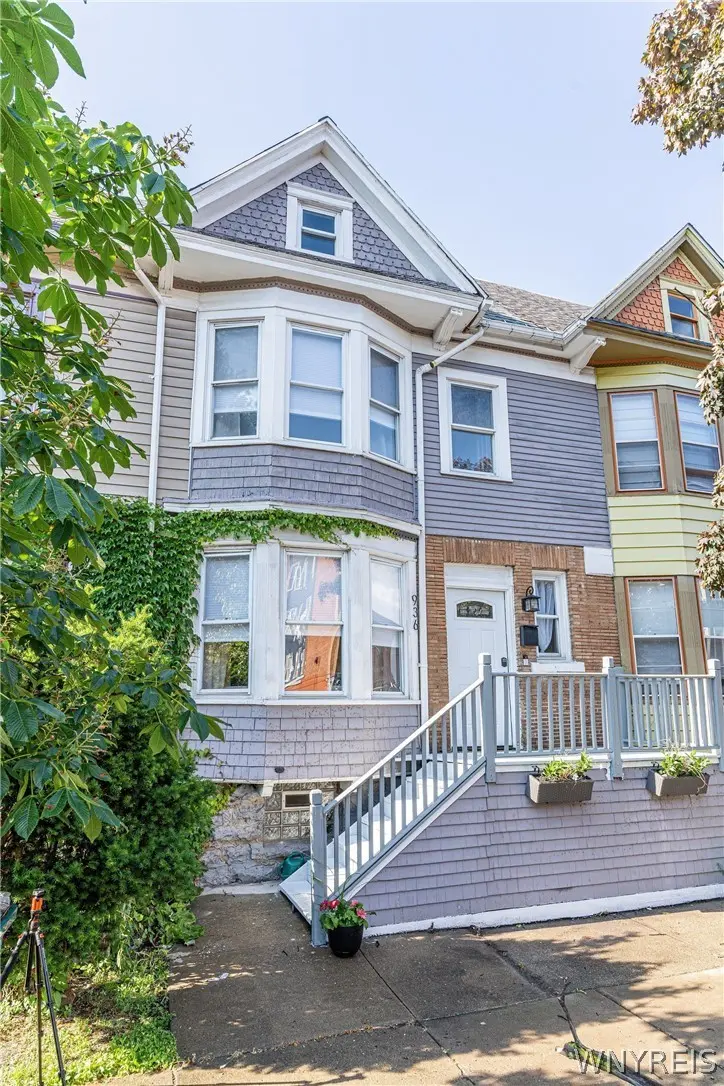
936 W Ferry St Unit N · Buffalo, NY
Flood risk 1/10 · Minimal
- FEMA flood zone
- X (unshaded)
- Chance of flooding over 30 yrs
- 0.0%
- Est. flood insurance / yr
- $473 – $860
Fire risk 1/10 · Minimal
- Est. fire insurance / yr
- $691 – $1,283
Heat risk 3/10 · Minor
- Hot days now (above 91°F)
- 7 days/yr
- Hot days in 30 yrs
- 15 days/yr
Wind risk 1/10 · Minimal
- Chance of severe wind over 30 yrs
- —
Air-quality risk 4/10 · Minor
- Unhealthy air days now
- 4 days/yr
- Unhealthy air days in 30 yrs
- 9 days/yr
Risk factors via First Street. Map © Google.
Why this score? — see what drove the C- grade
The composite is a weighted blend of 9 inputs, each scored 0–100. Each bar is that input's sub-score; the figure is the points it added to the 100-point composite (weight × sub-score).
- Cash flow +21.0/30.0
- DSCR +6.7/10.0
- Appreciation +5.9/10.0
- Rent growth +4.6/5.0
- 1% rule +4.5/10.0
- Livability +3.9/5.0
- Schools +3.3/10.0
- Condition / age +2.5/5.0
- ARV discount +0.0/15.0
$199,900
🖨 Deal sheet 📄 Offer letter ✓ Due diligence
Listing remarks
City Living at its best! This walkable row-style home combines charming character and modern touches. LTV flooring throughout the first floor. Tastefully renovated white kitchen w granite countertops and stainless steel appliances. Formal dining room, spacious living room with bay window and striking faux fireplace. Upstairs find 2 bedrooms and renovated bath with floating vanity and large format tile, tiled shower. Full basement with laundry. Available fully furnished! No HOA!
Key facts
- Formal dining room
- Bay window
- Granite countertops
Tags
Property features AI
Exterior
- Parking: No garage; No driveway
- Utilities: High-speed internet available; Public water (connected); Sewer connected; Electric with circuit breakers
- Home design: 2-story home; Existing construction
- Construction: Brick and shake siding; Asphalt roof; Stone foundation; Built (existing)
- Exterior features: Open porch; Rectangular lot; Near public transit; Lot dimensions approximately 19 x 30
Interior
- Kitchen: Gas oven; Gas range; Dishwasher; Refrigerator; Granite counters
- Flooring: Carpet; Luxury vinyl; Varies
- Bathrooms: 1 full bathroom
- Heating & cooling: Gas forced-air heating
- Interior features: Separate formal living room; Separate formal dining room; Granite counters; Natural woodwork; Full basement
- Laundry & utility: Washer and dryer; Laundry located in basement; Gas water heater
Neighborhood map
What this means for you Summary
Snapshot
- This is a 4-bed/1.0-bath townhouse listed at $200k.
Deal economics
- At list price, monthly cash flow is $282 ($3k/yr) — positive.
- The deal already cash-flows at list — no discount required.
- To meet the 1% rule (rent ≥ 1% of price), the offer needs to be $190k (5.2% below list).
- Recommended offer: $190k (5.2% below list) — sets the bar for 1% rule.
Location & tenants
- Location reads 77/100 on livability (#195 in NY, #3,011 nationally) — a middle-class / working-renter tenant base. Strengths: commute A+, housing A+, health & safety A+; Watch: crime F, employment D-.
- Buffalo City School District (urban): math 41% / reading 40% proficiency, ranked #535 of 590 in NY (top 91%) — families likely to look elsewhere, expect single-tenant / working-renter base with shorter leases; 75% free/reduced lunch — lower-income household profile, screen leases tightly.
- Market conditions: Rents rising fast (+8.5%/yr); 56 active listings in the ZIP; 33 comparable units currently listed for rent nearby; rentals at typical pace (median 24d on market — plan ~3-4 weeks tenant-placement turnaround); 1,244 units permitted in Erie County in 2024 (563 in 5+ unit buildings).
- At $1,896/mo this rent would consume 45% of the median local household income ($50k/yr) (locally 959% of renters already pay >50% of income on rent) — very limited rent-growth headroom before tenants either downsize or default.
Forward outlook
- In year one you build about $5k of equity ($1k loan paydown + $4k appreciation (1.9% local appreciation)).
- At projected returns (1.9% appreciation + 8.0% rent growth), your $56k cash investment doubles in ~5 years — after that, you're playing with house money.
- By year 7, paydown + projected appreciation supports a ~$33k cash-out refi (75% LTV) — recoverable capital for the next deal without selling this one.
Negotiation context
- It's been on market 30 days — a 2% lower offer ($197k) is reasonable based on typical stale-listing flexibility.
- 2 sale attempts with the ask held roughly flat each time — persistent listings suggest the price (not the market) is what's stuck; bring a comps-based counter.
- Current owner paid $155k; 29% above their basis — modest negotiation headroom, anchor on the comps not their cost.
Risks & watch-outs
- Watch-outs: built in 1910 — expect roof / HVAC / electrical / plumbing capex.
Questions for the listing agent
- Built in 1910 — when were the roof, HVAC, electrical panel, plumbing, and water heater last replaced?
- Is there a deadline driving the sale (1031 exchange, divorce, estate, relocation)? That informs how much negotiation room exists.
- Crime grade is F in this area — have there been break-ins, vandalism, or insurance claims at this property in the last 3 years? What carrier currently insures it and at what premium?
- What's the average days-on-market for RENTAL listings here right now (not sales)? A rising rental-DOM trend means longer vacancies and softer asking-rent achievability than the comps imply.
- What's the recent tenant-quality profile in this submarket — average credit score on applications, eviction rate, late-payment / NSF rate, and stable-employment percentage? A property-management company in the area should have these aggregated.
- How much new for-sale + rental construction is in the pipeline within 1–3 miles? Heavy new supply typically softens prices + rents 12–24 months out; constrained supply supports both.
Investment metrics
- 1% rule
- 0.95% ✗
- Cap rate
- 7.99%
- Cash-on-cash
- 6.06%
- DSCR
- 1.27
- GRM
- 8.8
CMA / ARV
- ARV (on-the-fly)
- $169,983
- Comps found
- 1
Show comp detail 1 sale within ~0.75 mi
| Address | Dist | Beds/Ba | Sqft | Sold | Price | $/sf | Match |
|---|---|---|---|---|---|---|---|
| 83 Bryant St Unit 7D | 0.49mi | 3/1.0 (-1) | 1,180 (+6%) | 2mo | $180,000 | $153 | 60 |
Match score weights: distance 35% · size 25% · config 20% · recency 20%. Top-matched comps best support the ARV.
Projected returns pro-forma
1.86% appreciation · 8.0% rent growth · sell at horizon
- IRR
- 13.0%
- Equity multiple
- 1.72×
- Total profit
- $40,248
- Equity at exit
- $77,364
- IRR
- 18.5%
- Equity multiple
- 3.72×
- Total profit
- $152,001
- Equity at exit
- $110,278
Cash invested: $55,972 (down + closing). Projections, not guarantees.
Landlord ↔ Tenant lean methodology
- Overall (STATE)
- 15 Strongly Tenant-Friendly
- State New York
- 15 Strongly Tenant-Friendly · D+10
- County
- — inherits STATE
- City
- — inherits STATE
ZIP-level market 14209
- Home prices YoY
- 0.4%
- Rents YoY
- 8.5%
- Active inventory
- 56
- Price-to-rent
- 8.8×
Monthly cashflow live
- Estimated rent
- $1,896 high interval (Pro) →
- Mortgage (P&I)
- −$1,048
- Tax from tax record
- −$84 /mo · $1,003/yr
- Insurance
- −$83
- HOA
- −$0
- Vacancy / Maint / Mgmt
- −$398
- Net cashflow
- $282
Break-even live
UW: 25.0% down · 7.5% · 30yr · 1.5% tax · 5.0% vac · 8.0% maint · 8.0% mgmt
Financing live
Cash to close
- Down payment
- $49,975
- Closing costs
- $5,997
- Reserves months
- —
- Total cash needed
- —
Loan-product check · same deal, 3 products live
Conventional
25% down · 7.5% · 30yr
- Down + closing
- —
- Monthly P&I
- —
- Monthly cashflow
- —
- DSCR
- —
- Eligible?
- —
Personal DTI + credit; lowest rate.
DSCR
20% down · 8.5% · 30yr
- Down + closing
- —
- Monthly P&I
- —
- Monthly cashflow
- —
- DSCR
- —
- Eligible?
- —
No personal income docs; deal must DSCR.
Hard money
10% down · 12.0% · 12mo
- Down + closing
- —
- Monthly P&I
- —
- Monthly cashflow
- —
- DSCR
- —
- Eligible?
- —
Short-term bridge; refi at stabilization.
Rent comps 33 comps
| Address | Beds | Baths | Sqft | Rent | $/sqft | DOM | Units | Dist |
|---|---|---|---|---|---|---|---|---|
| 76 Chester St Unit 1 Buffalo, NY | 3.0 | 1.0 | 1100 | $1,000 | $0.91 | 14d | 1 | 0.38mi |
| 88 W Utica St Unit 1 Buffalo, NY | 3.0 | 2.0 | 990 | $2,150 | $2.17 | 14d | 1 | 0.38mi |
| 88 W Utica St Unit 1 Buffalo, NY | 3.0 | 2.0 | 990 | $2,150 | $2.17 | 2d | 1 | 0.38mi |
| 238 Oxford Ave Unit Upper Buffalo, NY | 3.0 | 1.0 | 1100 | $1,600 | $1.45 | 23d | 1 | 0.42mi |
| 685 Auburn Ave Unit 2 Buffalo, NY | 3.0 | 1.0 | 1200 | $1,750 | $1.46 | 14d | 1 | 0.50mi |
| 102 Florida St Buffalo, NY | 3.0 | 1.0 | 1296 | $1,650 | $1.27 | 43d | 1 | 0.63mi |
| 1560 Delaware Ave Unit 1 Buffalo, NY | 3.0 | 1.0 | 1000 | $2,800 | $2.80 | 23d | 1 | 0.73mi |
| 1152 Main St Apt 3 Buffalo, NY | 3.0 | 1.0 | 1000 | $2,400 | $2.40 | 14d | 1 | 0.76mi |
| 825 Forest Ave Unit 1 Buffalo, NY | 3.0 | 1.0 | 1200 | $1,700 | $1.42 | 3d | 1 | 0.83mi |
| 825 Forest Ave Buffalo, NY | 3.0 | 1.0 | 1200 | $2,000 | $1.67 | 23d | 1 | 0.83mi |
| 118 Ashland Ave Buffalo, NY | 3.0 | 1.0 | 1326 | $1,850 | $1.40 | 14d | 1 | 0.86mi |
| 104 Butler Ave Buffalo, NY | 3.0 | 1.0 | 1000 | $1,400 | $1.40 | 43d | 1 | 0.90mi |
| 478 Breckenridge St Buffalo, NY | 3.0 | 1.0 | 1100 | $1,575 | $1.43 | 43d | 1 | 0.91mi |
| 31 Norwood Ave Unit 2 Buffalo, NY | 3.0 | 1.0 | 1000 | $1,950 | $1.95 | 11d | 1 | 1.00mi |
| 179 Donaldson Rd Buffalo, NY | 3.0 | 1.0 | 1152 | $1,350 | $1.17 | 3d | 1 | 1.04mi |
| 184 Butler Ave Unit 1545840P Buffalo, NY | 4.0 | 1.0 | 1496 | $3,226 | $2.16 | 14d | 1 | 1.05mi |
| 117 Humboldt Pkwy Unit A Buffalo, NY | 3.0 | 1.0 | 1105 | $2,300 | $2.08 | 43d | 1 | 1.09mi |
| 891 Richmond Ave Buffalo, NY | 3.0 | 1.0 | 1176 | $1,800 | $1.53 | 43d | 1 | 1.09mi |
| 161 16th St Buffalo, NY | 3.0 | 1.5 | 1500 | $2,000 | $1.33 | 23d | 1 | 1.10mi |
| 375 Hampshire St Buffalo, NY | 3.0 | 1.0 | 1200 | $1,100 | $0.92 | 43d | 1 | 1.15mi |
| 37 Abbottsford Pl Buffalo, NY | 3.0 | 1.0 | 1130 | $1,650 | $1.46 | 43d | 1 | 1.16mi |
| 374 Baynes St Buffalo, NY | 3.0 | 1.0 | 1126 | $1,550 | $1.38 | 43d | 1 | 1.18mi |
| 310 Hampshire St Apt 3 Buffalo, NY | 3.0 | 1.0 | 1200 | $1,500 | $1.25 | 43d | 1 | 1.26mi |
| 44 N Pearl St #5 Buffalo, NY | 3.0 | 1.0 | 1200 | $2,400 | $2.00 | 43d | 1 | 1.28mi |
| 309 Bird Ave Unit 1 Buffalo, NY | 3.0 | 1.0 | 1100 | $2,200 | $2.00 | 43d | 1 | 1.28mi |
| 305 Bird Ave Unit 3 Buffalo, NY | 3.0 | 1.5 | 1128 | $2,300 | $2.04 | 43d | 1 | 1.29mi |
| 17 N Pearl St Unit 3 Buffalo, NY | 3.0 | 2.0 | 1197 | $3,100 | $2.59 | 23d | 1 | 1.33mi |
| 67 Herkimer St Buffalo, NY | 3.0 | 1.0 | 1000 | $1,300 | $1.30 | 14d | 1 | 1.38mi |
| 311 Herkimer St #1 Buffalo, NY | 3.0 | 1.0 | 1272 | $1,400 | $1.10 | 14d | 1 | 1.39mi |
| 196 Auburn Ave Buffalo, NY | 3.0 | 1.0 | 1000 | $1,300 | $1.30 | 43d | 1 | 1.40mi |
| 21 College St Buffalo, NY | 3.0 | 1.0 | 1104 | $1,850 | $1.68 | 23d | 1 | 1.43mi |
| 408 Winslow Ave Unit 2 Buffalo, NY | 3.0 | 1.0 | 1000 | $1,050 | $1.05 | 14d | 1 | 1.45mi |
| 163 W Delavan Ave Buffalo, NY | 3.0 | 1.0 | 1000 | $1,500 | $1.50 | 23d | 1 | 1.45mi |
Listing history 17 events
-
2026-06-18days on market $199,900 Active 30 DOM
-
2026-06-17days on market $199,900 Active 29 DOM
-
2026-06-16days on market $199,900 Active 28 DOM
-
2026-06-15days on market $199,900 Active 27 DOM
-
2026-06-13days on market $199,900 Active 25 DOM
-
2026-06-13days on market $199,900 Active 24 DOM
-
2026-06-10days on market $199,900 Active 22 DOM
-
2026-06-09days on market $199,900 Active 21 DOM
-
2026-06-08days on market $199,900 Active 20 DOM
-
2026-06-07days on market $199,900 Active 19 DOM
-
2026-06-03days on market $199,900 Active 15 DOM
-
2026-06-02days on market $199,900 Active 14 DOM
-
2026-06-01days on market $199,900 Active 13 DOM
-
2026-05-31days on market $199,900 Active 12 DOM
-
2026-05-19$199,900 Active
-
2025-11-17$209,900 Active
-
2022-01-10soldstatus $155,200
ⓘ Source: listings_history table (triggers on properties + properties_extension) + one-shot
backfill from property_details.listing_events for pre-trigger history.
Tax reassessment forecast NY · Partial reset (capped growth)
- Current annual tax
- $1,003 · $84/mo
- Projected year-2 tax
- $2,191 · $183/mo
- Expected delta
- +$1,188/yr (+$99/mo · 118.4%)
ⓘ Screening estimate from a state-policy table — verify with the county assessor before closing.
Climate risk First Street
- Flood 1/10 Low FEMA zone X (unshaded) · 0% chance over 30 yrs
- Wildfire 1/10 Low
- Heat 3/10 Moderate 7 d/yr ≥91°F today · 15 d/yr by 30 yrs out
- Wind 1/10 Low
- Air quality 4/10 Moderate 4 unhealthy d/yr today · 9 by 30 yrs out
Nearby sold comps map
Loading sold comps map…
Walkable amenities ~0.75 mi
Loading nearby amenities…
Taxation est. · year 1
- Rental income
- $22,749
- − Mortgage interest
- −$11,198
- − Property taxes
- −$1,003
- − Insurance
- −$1,000
- − Repairs & maintenance
- −$1,820
- − Management
- −$1,820
- − Depreciation
- −$5,815
- Taxable income
- $94
- Est. tax owed @ 24.0%
- −$23
- After-tax cash flow
- $3,367/yr
For passive investors: Depreciation is non-cash, so a rental often shows a tax loss while cash-flowing — sheltering income. Rental losses are passive: they offset passive income freely, and up to $25,000/yr can offset ordinary (W-2) income if you actively participate and your MAGI is under $100k (phasing out to $0 by $150k); unused losses carry forward. On sale, claimed depreciation is recaptured at up to 25%, and gains may owe capital-gains tax (a 1031 exchange can defer both). Figures are a year-1 estimate at your 24.0% rate — not tax advice; consult a CPA.
Schools (NCES district)
- District
- Buffalo City School District
- NCES district ID
- 3605850
- Math proficiency
- 41% ▲ 11.00%
- Reading proficiency
- 40% ▲ 7.00%
- Median HH income
- $31,665
- Composite
- 33.17/100
- National rank
- #5544
- State rank
- #535 of 590 in NY
Livability — Buffalo
- Score
- 77/100
- State rank
- #195
- US rank
- #3011
Category grades
Schools grade is shown separately in the Schools card above.
Census & demographics
- Census place
- Buffalo, NY
- County
- Erie County · 714,559 people
- City population
- 440,021
- Metro
- Buffalo-Cheektowaga, NY
- Population (ZIP)
- 8,313
- Household income
- $50,046
- Rent vs Own
- Severe rent burden
- 959.0
Population outlook (Erie County) Hauer SSP2
- Today (2025)
- 933,037 people
- By 2030
- 935,181 · +0.2%
- By 2040
- 928,531 · -0.5%
- By 2050
- 905,725 · -2.9%
- By 2075
- 834,037 · -10.6%
- By 2100
- 708,033 · -24.1%
Race, ethnicity, and origin ACS 2023
- Neighborhood character
- Diverse neighborhood (Simpson 0.62)
- Race & ethnicity
- White 53% Black 30% Hispanic / Latino 11% Two or more races 5% Asian 3%
- Hispanic origin (detail)
- Puerto Rican 6% Dominican 1%
- Common ancestry
- Romanian 6% Lithuanian 2% Scotch-Irish 2%
- Foreign-born
- 9% · Canada, Dominican Republic, China
- Languages at home
- 88% English-only · Spanish 5% Other Indo-European 2% French/Haitian/Cajun 2%
Political lean MEDSL · Erie
- 2024 margin
- Lean D (+9.7) · D 54.8% · R 45.2%
- 2008→2024 swing
- -7.9pp toward R · 2008: 17.5pp · 2024: 9.7pp
- All cycles
- 2024: D+9.7 2020: D+14.7 2016: D+4.8 2012: D+15.6 2008: D+17.5
Not yet ingested
- Civics
- —
Market trends
- HPI YoY
- ▲ 1.86%
- Current HPI
- 443.9414
- Rent YoY
- ▲ 8.53%
- Metro
- Buffalo-Cheektowaga, NY
- State GDP YoY
- ▲ 2.60%
- F500 in state
- 92
Industry mix (Fortune 500 HQ in NY)
| Industry | F500 HQs | Revenue |
|---|---|---|
| Financial Services | 10 | $950B |
|
||
| Consumer Goods | 9 | $162B |
|
||
| Insurance | 4 | $225B |
|
||
| Telecommunications | 2 | $144B |
|
||
| Pharmaceuticals | 2 | $112B |
|
||
| Media / Entertainment | 2 | $69B |
|
||
Price history
+28.8% since first listed3 events — show timeline
- 2026-05-19 Listed $199,900 WNYREIS
- 2025-11-17 Listed $209,900 WNYREIS
- 2022-01-10 Sold (Public Records) $155,200 Public Records
Property tax history
+23.5%/yrLatest (2025): $1,003 · +0.0% YoY. Source: county tax records.
Cash-flow waterfall
monthlySold comps — $/sqft
last 12 mo · ≤1 miLoading sold comps…