 Duplex
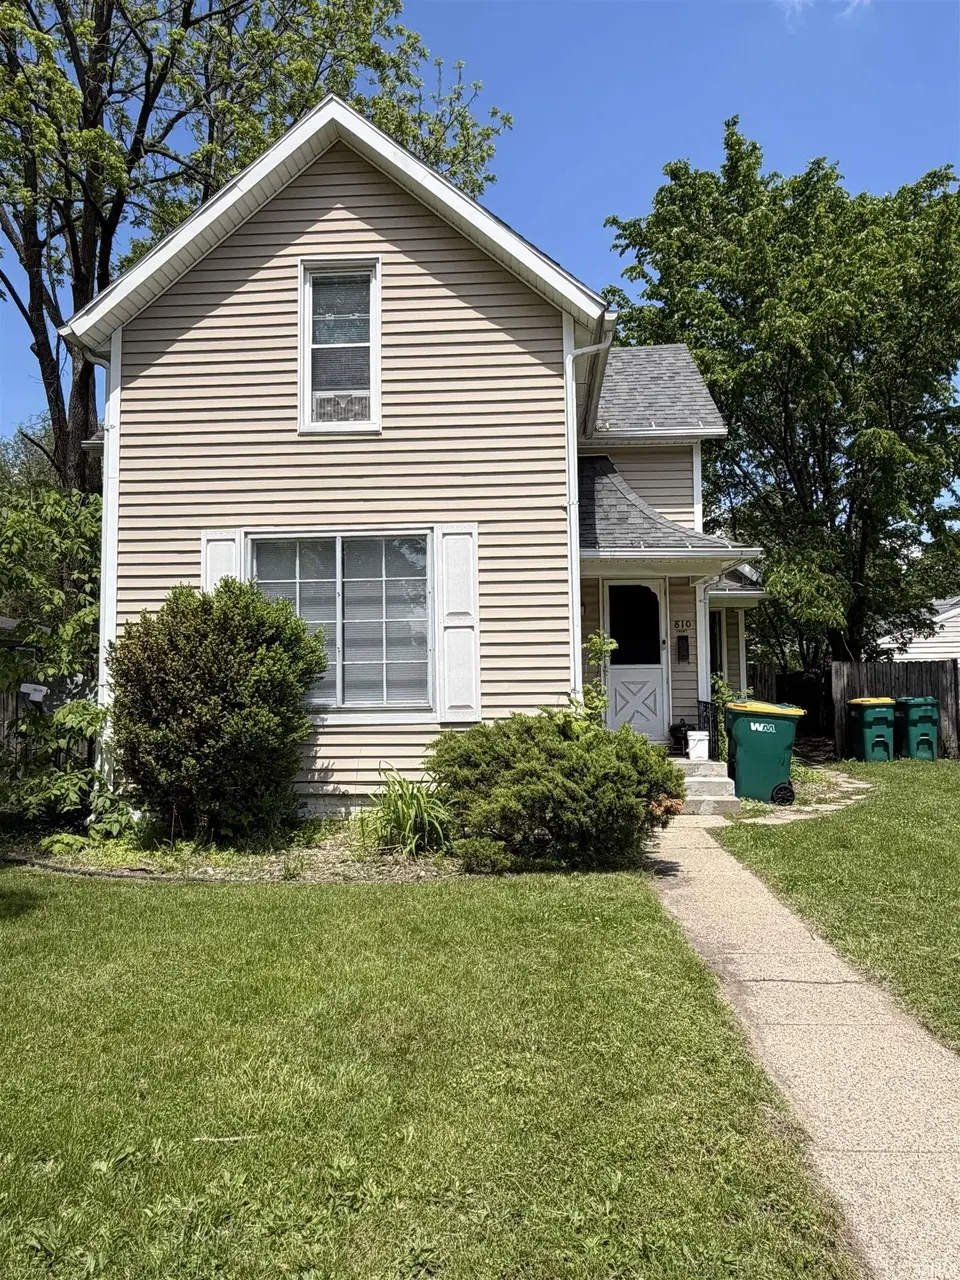
810 E 3rd St · Mishawaka, IN
Flood risk 4/10 · Minor
- FEMA flood zone
- X (unshaded)
- Chance of flooding over 30 yrs
- 0.22%
- Est. flood insurance / yr
- $473 – $860
Fire risk 1/10 · Minimal
- Est. fire insurance / yr
- $717 – $1,331
Heat risk 3/10 · Minor
- Hot days now (above 100°F)
- 7 days/yr
- Hot days in 30 yrs
- 16 days/yr
Wind risk 2/10 · Minimal
- Chance of severe wind over 30 yrs
- —
Air-quality risk 3/10 · Minor
- Unhealthy air days now
- 2 days/yr
- Unhealthy air days in 30 yrs
- 3 days/yr
Risk factors via First Street. Map © Google.
Why this score? — see what drove the C grade
The composite is a weighted blend of 9 inputs, each scored 0–100. Each bar is that input's sub-score; the figure is the points it added to the 100-point composite (weight × sub-score).
- Cash flow +25.3/30.0
- DSCR +8.3/10.0
- 1% rule +6.6/10.0
- ARV discount +5.2/15.0
- Rent growth +4.8/5.0
- Livability +3.8/5.0
- Condition / age +2.5/5.0
- Schools +2.2/10.0
- Appreciation +0.0/10.0
$220,000
🖨 Deal sheet (PDF) 📄 Offer letter ✓ Due diligence
Multi-family units
County records classify this as Multi-Family (2-4 Unit). Listing-text estimate: 2 units. confirmed
Listing remarks MLS
Nice duplex located in Mishawaka! The first unit has the living room, dining area, and kitchen on the first floor, 2 bedrooms and 1 bathroom on the second floor. The first unit has street parking only. The front unit is rented for $750.00. The lease ends 8/31/2021. The second unit has living room, dining area, kitchen, 2 bedrooms and 1 bathroom all on the main level. This unit has access to a fenced in yard, off street parking, and a 2 car garage. This unit is rented for $785.00. The lease ends 8/31/2021. Buyer to check all information, schools and all measurements. Bedroom measurements are not accurate. Rented, need 48 hour notice to show!
Key facts
- Functional layouts
- Strong rental appeal
- 7,405 sq ft lot
Tags
Property features AI
Finance
- Other: Pets allowed
Exterior
- Parking: 2 open parking spaces
- Utilities: Public water; Public sewer
- Home design: Duplex (Residential Income); 2 stories; Vinyl siding
- Construction: Vinyl siding construction
- Exterior features: Level lot
Interior
- Kitchen: Range; Refrigerator
- Flooring: Carpet; Laminate
- Bathrooms: 2 full bathrooms; 4 main-level bathrooms
- Heating & cooling: Forced air heating
- Interior features: Washer hookup; Full basement
- Laundry & utility: Washer; Dryer
Neighborhood map
What this means for you Summary
Snapshot
- This is a 2 × 2-bed/1.0-bath units multifamily listed at $220k.
Deal economics
- At list price, monthly cash flow is $497 ($6k/yr) — positive. Per door: $248/mo.
- The deal already cash-flows at list — no discount required.
- Meets the 1% rule at list price ($3k rent vs $220k).
- Cap rate 9.0% vs local median 5.3% in Mishawaka — top-decile yield for the area; either an underpriced asset or a hidden risk that comps aren't pricing in. Stress-test before assuming the spread holds.
Location & tenants
- Location reads 76/100 on livability (#53 in IN, #3,586 nationally) — a middle-class / working-renter tenant base. Strengths: cost of living A+, housing A+, health & safety B; Watch: amenities F, employment F.
- School City Of Mishawaka (urban): math 23% / reading 30% proficiency, ranked #260 of 301 in IN (top 86%) — low school quality limits family demand, transient renter base, plan for 1-2y turnover.
- Zoned schools: Beiger Elementary School (math 30% / reading 28%, grade F, #725 of 994 statewide, top 73%, 546 students, 67% FRL); John J Young Middle School (math 17% / reading 30%, grade F, #257 of 330 statewide, top 79%, 735 students, 74% FRL); Mishawaka High School (math 24% / reading 60%, grade F, #197 of 369 statewide, top 57%, 1,488 students, 65% FRL).
- Market conditions: Rents rising fast (+9.1%/yr); 141 active listings in the ZIP; 2 comparable units currently listed for rent nearby; 754 units permitted in St. Joseph County in 2024 (460 in 5+ unit buildings).
- At $2,558/mo this rent would consume 52% of the median local household income ($59k/yr) (locally 685% of renters already pay >50% of income on rent) — very limited rent-growth headroom before tenants either downsize or default.
Forward outlook
- Local home prices are declining (-3.0%/yr); year-one equity from $2k of loan paydown is wiped out by about $7k of value loss. Plan a longer hold.
- At projected returns (-3.0% appreciation + 8.0% rent growth), your $62k cash investment doubles in ~8 years — after that, you're playing with house money.
Negotiation context
- Only 1 days on market — expect competitive offers; lowballing is unlikely to land.
- 4 sale attempts since 6y ago with the ask held roughly flat each time — persistent listings suggest the price (not the market) is what's stuck; bring a comps-based counter.
- Current owner paid $115k; list at $220k implies a 91% gain — meaningful room to come down on a strong offer.
Risks & watch-outs
- Watch-outs: built in 1890 — expect roof / HVAC / electrical / plumbing capex.
Questions for the listing agent
- Can we see the unit-by-unit rent roll, current vacancy, and any below-market leases? What's the average tenancy length?
- What capital expenditures (roof, boiler, parking lot, exteriors) have been made in the last 5 years, and what's planned in the next 2?
- Built in 1890 — when were the roof, HVAC, electrical panel, plumbing, and water heater last replaced?
- Is there a deadline driving the sale (1031 exchange, divorce, estate, relocation)? That informs how much negotiation room exists.
- What's the average days-on-market for RENTAL listings here right now (not sales)? A rising rental-DOM trend means longer vacancies and softer asking-rent achievability than the comps imply.
- What's the recent tenant-quality profile in this submarket — average credit score on applications, eviction rate, late-payment / NSF rate, and stable-employment percentage? A property-management company in the area should have these aggregated.
- How much new apartment / multifamily construction is in the pipeline within 1–3 miles? Heavy new supply (>2% of stock underway) typically softens rents 12–24 months out; light construction supports rent growth.
Investment metrics
- 1% rule
- 1.16% ✓
- Cap rate
- 9.00%
- Cash-on-cash
- 9.68%
- DSCR
- 1.43
- GRM
- 7.2
CMA / ARV
- ARV (on-the-fly)
- $209,088
- Comps found
- 1
Show comp detail 1 sale within ~0.75 mi
| Address | Dist | Beds/Ba | Sqft | Sold | Price | $/sf | Match |
|---|---|---|---|---|---|---|---|
| 114 E 8th St | 0.65mi | 6/3.0 (+1) | 2,298 (+6%) | 8mo | $220,000 | $96 | 44 |
Match score weights: distance 35% · size 25% · config 20% · recency 20%. Top-matched comps best support the ARV.
Projected returns pro-forma
-3.0% appreciation · 8.0% rent growth · sell at horizon
- IRR
- 3.8%
- Equity multiple
- 1.16×
- Total profit
- $9,557
- Equity at exit
- $32,803
- IRR
- 17.6%
- Equity multiple
- 2.80×
- Total profit
- $110,767
- Equity at exit
- $19,022
Cash invested: $61,600 (down + closing). Projections, not guarantees.
Landlord ↔ Tenant lean methodology
- Overall (STATE)
- 90 Strongly Landlord-Friendly
- State Indiana
- 90 Strongly Landlord-Friendly · R+11
- County
- — inherits STATE
- City
- — inherits STATE
ZIP-level market 46544
- Rents YoY
- 9.1%
- Active inventory
- 141
- Price-to-rent
- 14.3×
Monthly cashflow live
- Estimated rent
- $2,558 high interval (Pro) →
- Mortgage (P&I)
- −$1,154
- Tax from tax record
- −$279 /mo · $3,343/yr
- Insurance
- −$92
- HOA
- −$0
- Lot rent
- −$0
- Vacancy / Maint / Mgmt
- −$537
- Net cashflow
- $497
Break-even live
Sensitivity live
| Price | -10% $621 | -5% $559 | +0% $497 | +5% $435 | +10% $372 |
|---|---|---|---|---|---|
| Rent | -10% $295 | -5% $396 | +0% $497 | +5% $598 | +10% $699 |
| Rate | -1.0pp $608 | -0.5pp $553 | base $497 | +0.5pp $440 | +1.0pp $382 |
2-unit breakdown (identical units grouped — click to expand)
| Units | Beds | Baths | Est. rent |
|---|---|---|---|
| 2× units | 2 | 1 | $2,558 |
| #1 | 2 | 1 | $1,279 |
| #2 | 2 | 1 | $1,279 |
| Total (2 units) | $2,558 | ||
UW: 25.0% down · 7.5% · 30yr · 1.5% tax · 5.0% vac · 8.0% maint · 8.0% mgmt
Financing live
Cash to close
- Down payment
- $55,000
- Closing costs
- $6,600
- Reserves months
- —
- Total cash needed
- —
Loan-product check · same deal, 3 products live
Conventional
25% down · 7.5% · 30yr
- Down + closing
- —
- Monthly P&I
- —
- Monthly cashflow
- —
- DSCR
- —
- Eligible?
- —
Personal DTI + credit; lowest rate.
DSCR
20% down · 8.5% · 30yr
- Down + closing
- —
- Monthly P&I
- —
- Monthly cashflow
- —
- DSCR
- —
- Eligible?
- —
No personal income docs; deal must DSCR.
Hard money
10% down · 12.0% · 12mo
- Down + closing
- —
- Monthly P&I
- —
- Monthly cashflow
- —
- DSCR
- —
- Eligible?
- —
Short-term bridge; refi at stabilization.
Rent comps 2 comps
| Address | Beds | Baths | Sqft | Rent | $/sqft | DOM | Units | Dist |
|---|---|---|---|---|---|---|---|---|
| 103 E 7th St Mishawaka, IN | 4.0 | 2.0 | 2300 | $1,750 | $0.76 | 15d | 1 | 0.65mi |
| 211 Columbia St Mishawaka, IN | 4.0 | 2.5 | 1500 | $1,795 | $1.20 | 23d | 1 | 1.39mi |
Listing history 7 events
-
2026-05-20status Pending
-
2026-05-19$220,000 Active
-
2025-05-23historical $1,050
-
2025-05-01$1,050
-
2021-02-26soldstatus $115,000 655-char remark
Show marketing remark (655 chars)
Nice duplex located in Mishawaka! The first unit has the living room, dining area, and kitchen on the first floor, 2 bedrooms and 1 bathroom on the second floor. The first unit has street parking only. The front unit is rented for $750.00. The lease ends 8/31/2021. The second unit has living room, dining area, kitchen, 2 bedrooms and 1 bathroom all on the main level. This unit has access to a fenced in yard, off street parking, and a 2 car garage. This unit is rented for $785.00. The lease ends 8/31/2021. Buyer to check all information, schools and all measurements. Bedroom measurements are not accurate. Rented, need 48 hour notice to show!
-
2021-01-27$115,000 655-char remark
Show marketing remark (655 chars)
Nice duplex located in Mishawaka! The first unit has the living room, dining area, and kitchen on the first floor, 2 bedrooms and 1 bathroom on the second floor. The first unit has street parking only. The front unit is rented for $750.00. The lease ends 8/31/2021. The second unit has living room, dining area, kitchen, 2 bedrooms and 1 bathroom all on the main level. This unit has access to a fenced in yard, off street parking, and a 2 car garage. This unit is rented for $785.00. The lease ends 8/31/2021. Buyer to check all information, schools and all measurements. Bedroom measurements are not accurate. Rented, need 48 hour notice to show!
-
2020-03-18$115,000
ⓘ Source: listings_history table (triggers on properties + properties_extension) + one-shot
backfill from property_details.listing_events for pre-trigger history.
Tax reassessment forecast IN · Partial reset (capped growth)
- Current annual tax
- $3,343 · $279/mo
- Projected year-2 tax
- $3,343 · $279/mo
- Expected delta
- $0/yr ($0/mo · 0.0%)
ⓘ Screening estimate from a state-policy table — verify with the county assessor before closing.
Climate risk First Street
- Flood 4/10 Moderate FEMA zone X (unshaded) · 22% chance over 30 yrs
- Wildfire 1/10 Low
- Heat 3/10 Moderate 7 d/yr ≥100°F today · 16 d/yr by 30 yrs out
- Wind 2/10 Low
- Air quality 3/10 Moderate 2 unhealthy d/yr today · 3 by 30 yrs out
Nearby sold comps map
Loading sold comps map…
Walkable amenities ~0.75 mi
Loading nearby amenities…
Taxation est. · year 1
- Rental income
- $30,696
- − Mortgage interest
- −$12,323
- − Property taxes
- −$3,343
- − Insurance
- −$1,100
- − Repairs & maintenance
- −$2,456
- − Management
- −$2,456
- − Depreciation
- −$6,400
- Taxable income
- $2,619
- Est. tax owed @ 24.0%
- −$628
- After-tax cash flow
- $5,334/yr
For passive investors: Depreciation is non-cash, so a rental often shows a tax loss while cash-flowing — sheltering income. Rental losses are passive: they offset passive income freely, and up to $25,000/yr can offset ordinary (W-2) income if you actively participate and your MAGI is under $100k (phasing out to $0 by $150k); unused losses carry forward. On sale, claimed depreciation is recaptured at up to 25%, and gains may owe capital-gains tax (a 1031 exchange can defer both). Figures are a year-1 estimate at your 24.0% rate — not tax advice; consult a CPA.
Schools (NCES district)
- District
- School City Of Mishawaka
- NCES district ID
- 1806840
- Math proficiency
- 23% ▼ -9.00%
- Reading proficiency
- 30% ▼ -7.00%
- Median HH income
- $39,290
- Composite
- 22.26/100
- National rank
- #8143
- State rank
- #260 of 301 in IN
Livability — Mishawaka
- Score
- 76/100
- State rank
- #53
- US rank
- #3586
Category grades
Schools grade is shown separately in the Schools card above.
Census & demographics
- Census place
- Mishawaka, IN
- County
- Saint Joseph County · 189,048 people
- City population
- 57,683
- Metro
- South Bend-Mishawaka, IN-MI
- Population (ZIP)
- 31,077
- Household income
- $58,829
- Rent vs Own
- Severe rent burden
- 685.0
Population outlook (St. Joseph County) Hauer SSP2
- Today (2025)
- 273,186 people
- By 2030
- 273,594 · +0.1%
- By 2040
- 271,641 · -0.6%
- By 2050
- 269,187 · -1.5%
- By 2075
- 263,136 · -3.7%
- By 2100
- 245,659 · -10.1%
Race, ethnicity, and origin ACS 2023
- Neighborhood character
- Predominantly White (79%)
- Race & ethnicity
- White 79% Black 9% Two or more races 7% Hispanic / Latino 6% Asian 1%
- Hispanic origin (detail)
- Mexican 5%
- Common ancestry
- Romanian 7% English 3% Lithuanian 2%
- Foreign-born
- 4% · Canada, Vietnam
- Languages at home
- 94% English-only · Spanish 3%
Political lean MEDSL · St. Joseph
- 2024 margin
- Toss-up / Even · D 50.0% · R 48.5% · Other 1.5%
- 2008→2024 swing
- -15.6pp toward R · 2008: 17.1pp · 2024: 1.5pp
- All cycles
- 2024: D+1.5 2020: D+5.8 2016: D+0.2 2012: D+3.5 2008: D+17.1
Not yet ingested
- Civics
- —
Market trends
- HPI YoY
- ▼ -116.74%
- Current HPI
- 188.9996
- Rent YoY
- ▲ 9.10%
- Metro
- South Bend-Mishawaka, IN-MI
- State GDP YoY
- ▲ 2.90%
- F500 in state
- 18
Industry mix (Fortune 500 HQ in IN)
| Industry | F500 HQs | Revenue |
|---|---|---|
| Industrial Machinery | 2 | $37B |
|
||
| Healthcare | 1 | $177B |
|
||
| Pharmaceuticals | 1 | $45B |
|
||
| Metals / Steel | 1 | $18B |
|
||
| Agriculture | 1 | $17B |
|
||
| Packaging | 1 | $12B |
|
||
Price history
+91.3% since first listed7 events — show timeline
- 2026-05-20 Pending — IRMLS
- 2026-05-19 Listed $220,000 IRMLS
- 2025-05-23 Rental Removed $1,050 TENANTTURNER2
- 2025-05-01 Listed for Rent $1,050 TENANTTURNER2
- 2021-02-26 Sold (MLS) $115,000 IRMLS
- 2021-01-27 Listed $115,000 IRMLS
- 2020-03-18 Listed $115,000 IRMLS
Property tax history
+2.1%/yrLatest (2023): $3,343 · +0.6% YoY. Source: county tax records.
Cash-flow waterfall
monthlySold comps — $/sqft
last 12 mo · ≤1 miLoading sold comps…