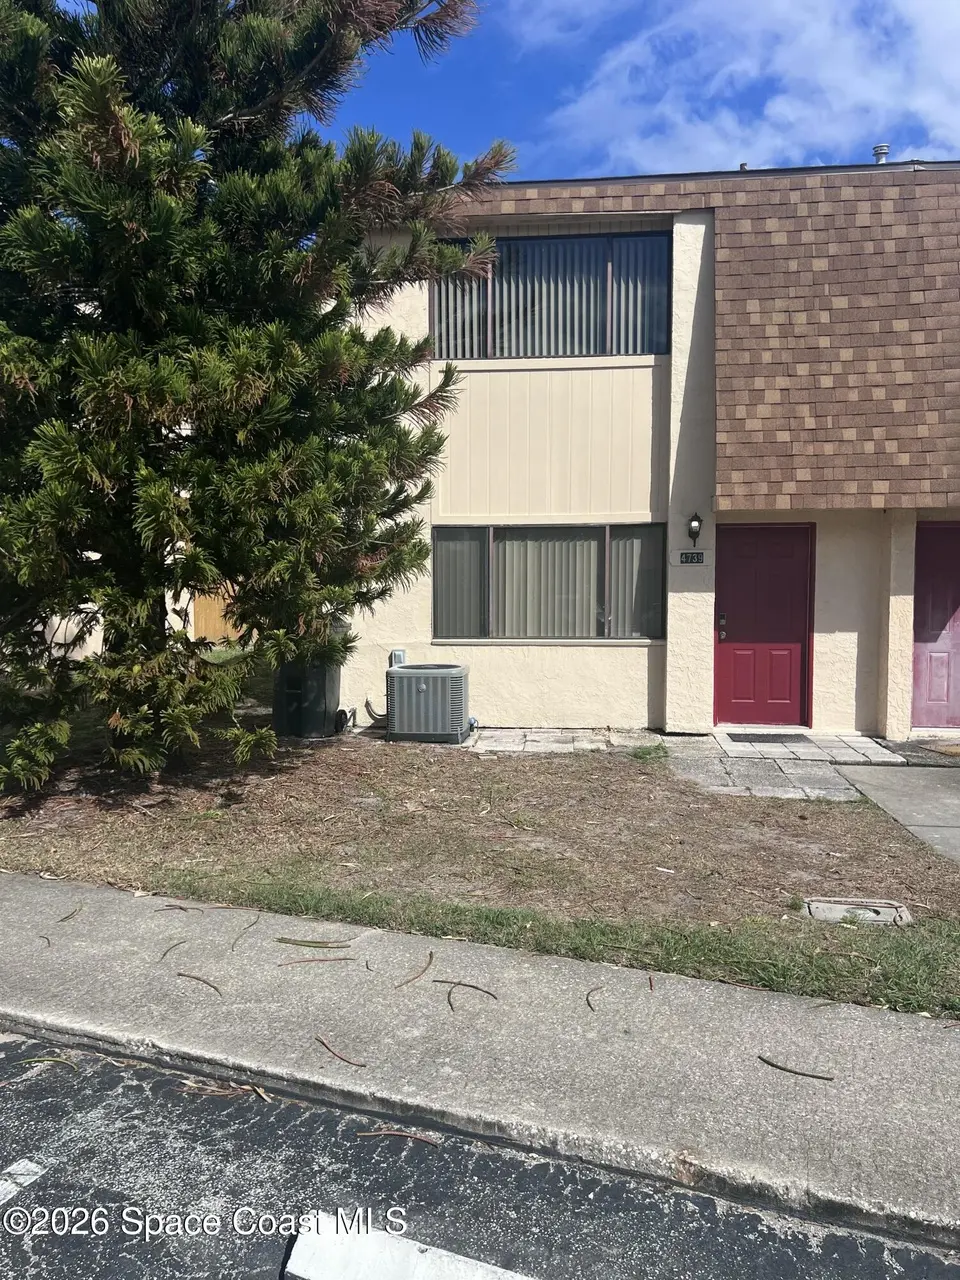
4739 Sisson Rd · Titusville, FL
Flood risk 1/10 · Minimal
- FEMA flood zone
- X (unshaded)
- Chance of flooding over 30 yrs
- 0.0%
- Est. flood insurance / yr
- $507 – $1,088
Fire risk 4/10 · Minor
- Est. fire insurance / yr
- $947 – $1,759
Heat risk 10/10 · Severe
- Hot days now (above 107°F)
- 7 days/yr
- Hot days in 30 yrs
- 23 days/yr
Wind risk 10/10 · Severe
- Chance of severe wind over 30 yrs
- 99.0%
Air-quality risk 1/10 · Minimal
- Unhealthy air days now
- 0 days/yr
- Unhealthy air days in 30 yrs
- 0 days/yr
Risk factors via First Street. Map © Google.
Why this score? — see what drove the C grade
The composite is a weighted blend of 9 inputs, each scored 0–100. Each bar is that input's sub-score; the figure is the points it added to the 100-point composite (weight × sub-score).
- Cash flow +21.7/30.0
- ARV discount +7.5/15.0
- DSCR +6.9/10.0
- 1% rule +6.2/10.0
- Schools +4.7/10.0
- Livability +4.2/5.0
- Rent growth +2.8/5.0
- Condition / age +2.5/5.0
- Appreciation +0.0/10.0
$165,000
🖨 Deal sheet 📄 Offer letter ✓ Due diligence
Listing remarks
Fresh, updated, and move-in ready! This Titusville home at 4739 Sisson Road features a NEWER ROOF, upgraded electrical panel, new luxury vinyl flooring upstairs, fresh interior paint, and brand-new appliances--giving you peace of mind and modern comfort from day one. Enjoy a functional layout with bright living spaces and a spacious lot offering room to relax, entertain, or expand. Whether you're a first-time buyer, investor, or looking for a low-maintenance Florida property, this one checks all the boxes. Conveniently located near shopping, dining, and just minutes from the Space Coast and Kennedy Space Center. Act fast--homes with this many upgrades at this price point don't last!
Key facts
- Brand new appliances
- Newer roof
- Functional layout
Tags
Neighborhood map
What this means for you Summary
Snapshot
- This is a 3-bed/3.0-bath townhouse listed at $165k.
Deal economics
- At list price, monthly cash flow is $253 ($3k/yr) — positive.
- The deal already cash-flows at list — no discount required.
- Meets the 1% rule at list price ($2k rent vs $165k).
- Recommended offer: $163k (1.5% below list) — sets the bar for market timing.
Location & tenants
- Location reads 84/100 on livability (#42 in FL, #668 nationally) — a professional / high-income tenant draw. Strengths: commute A+, cost of living A+, housing A+; Watch: crime D, employment D.
- Brevard (suburban): math 53% / reading 57% proficiency, ranked #19 of 73 in FL (top 26%) — acceptable for families but not a draw, mixed tenant base, ~2y average lease.
- Zoned schools: Imperial Estates Elementary School (math 46% / reading 50%, grade D, #1,171 of 2,144 statewide, top 55%, 658 students, 58% FRL); Andrew Jackson Middle School (math 52% / reading 47%, grade C, #259 of 571 statewide, top 46%, 551 students, 58% FRL); Titusville High School (math 33% / reading 52%, grade F, #264 of 667 statewide, top 41%, 1,314 students, 55% FRL).
- Market conditions: Rents rising (+1.3%/yr); 462 active listings in the ZIP; 17 comparable units currently listed for rent nearby; rentals at typical pace (median 24d on market — plan ~3-4 weeks tenant-placement turnaround); 4,602 units permitted in Brevard County in 2024 (702 in 5+ unit buildings).
- This rent runs 33% of the median local income ($68k/yr) — at the standard rent-burdened threshold; future hikes will face affordability resistance.
Forward outlook
- Local home prices are declining (-3.0%/yr); year-one equity from $1k of loan paydown is wiped out by about $5k of value loss. Plan a longer hold.
- Brevard County population projected at +15% by 2050 — modest demand growth; plan on rents tracking national, not racing it.
Negotiation context
- It's been on market 18 days — a 2% lower offer ($163k) is reasonable based on typical stale-listing flexibility.
- Current owner paid $40k; list at $165k implies a 312% gain — meaningful room to come down on a strong offer.
Risks & watch-outs
- Climate carrying-cost: severe wind risk, 99% chance of damaging wind over 30y; extreme-heat days projected 7→23/yr by 2055 (HVAC capex compounding) — expect insurance premiums to compound above CPI over the hold.
Questions for the listing agent
- What does the HOA fee cover, when was the last increase, and are there any pending special assessments or reserve-fund shortfalls?
- Is there a deadline driving the sale (1031 exchange, divorce, estate, relocation)? That informs how much negotiation room exists.
- Crime grade is D in this area — have there been break-ins, vandalism, or insurance claims at this property in the last 3 years? What carrier currently insures it and at what premium?
- What's the average days-on-market for RENTAL listings here right now (not sales)? A rising rental-DOM trend means longer vacancies and softer asking-rent achievability than the comps imply.
- What's the recent tenant-quality profile in this submarket — average credit score on applications, eviction rate, late-payment / NSF rate, and stable-employment percentage? A property-management company in the area should have these aggregated.
- How much new for-sale + rental construction is in the pipeline within 1–3 miles? Heavy new supply typically softens prices + rents 12–24 months out; constrained supply supports both.
Investment metrics
- 1% rule
- 1.12% ✓
- Cap rate
- 8.13%
- Cash-on-cash
- 6.57%
- DSCR
- 1.29
- GRM
- 7.4
CMA / ARV
No comps found within radius.
Projected returns pro-forma
-3.0% appreciation · 1.29% rent growth · sell at horizon
- IRR
- -8.2%
- Equity multiple
- 0.70×
- Total profit
- $-13,706
- Equity at exit
- $24,602
- IRR
- -1.2%
- Equity multiple
- 0.93×
- Total profit
- $-3,358
- Equity at exit
- $14,266
Cash invested: $46,200 (down + closing). Projections, not guarantees.
Landlord ↔ Tenant lean methodology
- Overall (STATE)
- 87 Strongly Landlord-Friendly
- State Florida
- 87 Strongly Landlord-Friendly · R+3
- County
- — inherits STATE
- City
- — inherits STATE
ZIP-level market 32780
- Rents YoY
- 1.3%
- Active inventory
- 462
- Price-to-rent
- 7.4×
Monthly cashflow live
- Estimated rent
- $1,856 high interval (Pro) →
- Mortgage (P&I)
- −$865
- Tax from tax record
- −$154 /mo · $1,852/yr
- Insurance
- −$69
- HOA
- −$125
- Vacancy / Maint / Mgmt
- −$390
- Net cashflow
- $253
Break-even live
UW: 25.0% down · 7.5% · 30yr · 1.5% tax · 5.0% vac · 8.0% maint · 8.0% mgmt
Financing live
Cash to close
- Down payment
- $41,250
- Closing costs
- $4,950
- Reserves months
- —
- Total cash needed
- —
Loan-product check · same deal, 3 products live
Conventional
25% down · 7.5% · 30yr
- Down + closing
- —
- Monthly P&I
- —
- Monthly cashflow
- —
- DSCR
- —
- Eligible?
- —
Personal DTI + credit; lowest rate.
DSCR
20% down · 8.5% · 30yr
- Down + closing
- —
- Monthly P&I
- —
- Monthly cashflow
- —
- DSCR
- —
- Eligible?
- —
No personal income docs; deal must DSCR.
Hard money
10% down · 12.0% · 12mo
- Down + closing
- —
- Monthly P&I
- —
- Monthly cashflow
- —
- DSCR
- —
- Eligible?
- —
Short-term bridge; refi at stabilization.
Rent comps 17 comps
| Address | Beds | Baths | Sqft | Rent | $/sqft | DOM | Units | Dist |
|---|---|---|---|---|---|---|---|---|
| 4749 Sisson Rd Titusville, FL | 2.0 | 1.5 | 1140 | $1,550 | $1.36 | 23d | 1 | 0.02mi |
| 4793 Sisson Rd Titusville, FL | 2.0 | 1.5 | 1140 | $1,450 | $1.27 | 23d | 1 | 0.05mi |
| 583 Hollow Glen Dr Titusville, FL | 4.0 | 2.0 | 1980 | $2,295 | $1.16 | 23d | 1 | 0.19mi |
| 605 Key Largo Dr S Titusville, FL | 3.0 | 2.0 | 1416 | $1,800 | $1.27 | 23d | 1 | 0.42mi |
| 4225 Abbott Ave Titusville, FL | 3.0 | 1.0 | 1176 | $1,600 | $1.36 | 23d | 1 | 0.53mi |
| 4005 Mount Sterling Ave Titusville, FL | 3.0 | 2.0 | 1520 | $1,736 | $1.14 | 23d | 1 | 0.83mi |
| 628 Timber Trace Ln Titusville, FL | 2.0–3.0 | 2.0 | 1104 | $1,467 | $1.33 | 23d | 1 | 0.83mi |
| 345 Newcastle Ct Titusville, FL | 3.0 | 2.0 | 1978 | $2,475 | $1.25 | 23d | 1 | 0.91mi |
| 890 Cynthia Dr Titusville, FL | 3.0 | 2.0 | 1290 | $2,165 | $1.68 | 14d | 1 | 0.95mi |
| 190 E Olmstead Dr Titusville, FL | 2.0–3.0 | 1.0–2.0 | 1091 | $1,800 | $1.65 | 23d | 5 | 0.99mi |
| 412 Waterside Cir Titusville, FL | 3.0 | 2.0 | 1923 | $2,575 | $1.34 | 14d | 1 | 1.09mi |
| 631 Waterside Cir Titusville, FL | 3.0 | 2.0 | 1935 | $2,700 | $1.40 | 23d | 1 | 1.09mi |
| 5305 S Washington Ave Titusville, FL | 2.0–3.0 | 2.0 | 1927 | $2,909 | $1.51 | 14d | 11 | 1.11mi |
| 3945 Trinidad Ave Titusville, FL | 4.0 | 2.0 | 1602 | $1,900 | $1.19 | 14d | 1 | 1.11mi |
| 1635 Nassau St Titusville, FL | 3.0 | 2.0 | 1161 | $1,900 | $1.64 | 19d | 1 | 1.14mi |
| 1081 Solamere Dr Titusville, FL | 1.0–3.0 | 1.0–2.0 | 1331 | $2,101 | $1.58 | 14d | 17 | 1.35mi |
| 4795 Pasco Ave Titusville, FL | 3.0 | 2.0 | 1700 | $1,995 | $1.17 | 23d | 1 | 1.38mi |
HOA detail
- Monthly dues
- $125 · $1,500/yr
- Likely covers
- electric
Listing history 8 events
-
2026-04-06status Pending
-
2026-03-19$165,000 Active
-
1993-09-10soldstatus $40,000
-
1993-04-26soldstatus $1,000
-
1988-02-28soldstatus $24,000
-
1988-02-01soldstatus $24,000
-
1984-10-01soldstatus $45,000
-
1981-03-01soldstatus $46,900
ⓘ Source: listings_history table (triggers on properties + properties_extension) + one-shot
backfill from property_details.listing_events for pre-trigger history.
Tax reassessment forecast FL · Resets to sale price
- Current annual tax
- $1,852 · $154/mo
- Projected year-2 tax
- $1,852 · $154/mo
- Expected delta
- $0/yr ($0/mo · 0.0%)
ⓘ Screening estimate from a state-policy table — verify with the county assessor before closing.
Climate risk First Street
- Flood 1/10 Low FEMA zone X (unshaded) · 0% chance over 30 yrs
- Wildfire 4/10 Moderate
- Heat 10/10 Extreme 7 d/yr ≥107°F today · 23 d/yr by 30 yrs out
- Wind 10/10 Extreme 99% chance of damaging wind over 30 yrs
- Air quality 1/10 Low 0 unhealthy d/yr today · 0 by 30 yrs out
Nearby sold comps map
Loading sold comps map…
Walkable amenities ~0.75 mi
Loading nearby amenities…
Taxation est. · year 1
- Rental income
- $22,270
- − Mortgage interest
- −$9,243
- − Property taxes
- −$1,852
- − Insurance
- −$825
- − Repairs & maintenance
- −$1,782
- − Management
- −$1,782
- − HOA
- −$1,500
- − Depreciation
- −$4,800
- Taxable income
- $487
- Est. tax owed @ 24.0%
- −$117
- After-tax cash flow
- $2,916/yr
For passive investors: Depreciation is non-cash, so a rental often shows a tax loss while cash-flowing — sheltering income. Rental losses are passive: they offset passive income freely, and up to $25,000/yr can offset ordinary (W-2) income if you actively participate and your MAGI is under $100k (phasing out to $0 by $150k); unused losses carry forward. On sale, claimed depreciation is recaptured at up to 25%, and gains may owe capital-gains tax (a 1031 exchange can defer both). Figures are a year-1 estimate at your 24.0% rate — not tax advice; consult a CPA.
Schools (NCES district)
- District
- Brevard
- NCES district ID
- 1200150
- Math proficiency
- 53% ▼ -9.00%
- Reading proficiency
- 57% ▼ -4.00%
- Median HH income
- $49,426
- Composite
- 46.86/100
- National rank
- #2370
- State rank
- #19 of 73 in FL
Livability — Titusville
- Score
- 84/100
- State rank
- #42
- US rank
- #668
Category grades
Schools grade is shown separately in the Schools card above.
Census & demographics
- Census place
- Titusville, FL
- County
- Brevard County · 602,871 people
- City population
- 60,286
- Metro
- Palm Bay-Melbourne-Titusville, FL
- Population (ZIP)
- 40,064
- Household income
- $67,690
- Rent vs Own
- Severe rent burden
- 1141.0
Population outlook (Brevard County) Hauer SSP2
- Today (2025)
- 623,254 people
- By 2030
- 648,420 · +4.0%
- By 2040
- 690,009 · +10.7%
- By 2050
- 715,669 · +14.8%
- By 2075
- 775,744 · +24.5%
- By 2100
- 776,687 · +24.6%
Race, ethnicity, and origin ACS 2023
- Neighborhood character
- Predominantly White (70%)
- Race & ethnicity
- White 70% Black 13% Hispanic / Latino 8% Two or more races 8% Asian 3%
- Hispanic origin (detail)
- Mexican 1% Puerto Rican 4% Cuban 1%
- Common ancestry
- Romanian 2% Slovak 2% Lithuanian 2%
- Foreign-born
- 8% · Canada, China
- Languages at home
- 89% English-only · Spanish 6% Other Indo-European 1% German/W. Germanic 1%
Political lean MEDSL · Brevard
- 2024 margin
- Strong R (+20.8) · D 39.1% · R 59.9% · Other 1.0%
- 2008→2024 swing
- -10.4pp toward R · 2008: -10.4pp · 2024: -20.8pp
- All cycles
- 2024: R+20.8 2020: R+16.4 2016: R+19.8 2012: R+12.7 2008: R+10.4
Not yet ingested
- Civics
- —
Market trends
- HPI YoY
- ▼ -162.54%
- Current HPI
- 297.151
- Rent YoY
- ▲ 1.29%
- Metro
- Palm Bay-Melbourne-Titusville, FL
- State GDP YoY
- ▲ 3.28%
- F500 in state
- 36
Industry mix (Fortune 500 HQ in FL)
| Industry | F500 HQs | Revenue |
|---|---|---|
| Industrial Technology | 2 | $29B |
|
||
| Insurance | 2 | $17B |
|
||
| Retail | 1 | $60B |
|
||
| Technology Distribution | 1 | $58B |
|
||
| Homebuilding | 1 | $35B |
|
||
| Technology Manufacturing | 1 | $35B |
|
||
Price history
+251.8% since first listed8 events — show timeline
- 2026-04-06 Pending — SCMLS
- 2026-03-19 Listed $165,000 SCMLS
- 1993-09-10 Sold (Public Records) $40,000 Public Records
- 1993-04-26 Sold (Public Records) $1,000 Public Records
- 1988-02-28 Sold (Public Records) $24,000 Public Records
- 1988-02-01 Sold (Public Records) $24,000 Public Records
- 1984-10-01 Sold (Public Records) $45,000 Public Records
- 1981-03-01 Sold (Public Records) $46,900 Public Records
Property tax history
+6.0%/yrLatest (2025): $1,852 · -4.7% YoY. Source: county tax records.
Cash-flow waterfall
monthlySold comps — $/sqft
last 12 mo · ≤1 miLoading sold comps…