1201 Destrier St · Ranson, WV
Flood risk 1/10 · Minimal
- FEMA flood zone
- X (unshaded)
- Chance of flooding over 30 yrs
- 0.0%
- Est. flood insurance / yr
- $473 – $860
Fire risk 3/10 · Minor
- Est. fire insurance / yr
- $787 – $1,461
Heat risk 5/10 · Moderate
- Hot days now (above 102°F)
- 7 days/yr
- Hot days in 30 yrs
- 16 days/yr
Wind risk 2/10 · Minimal
- Chance of severe wind over 30 yrs
- 3.0%
Air-quality risk 2/10 · Minimal
- Unhealthy air days now
- 1 days/yr
- Unhealthy air days in 30 yrs
- 1 days/yr
Risk factors via First Street. Map © Google.
Why this score? — see what drove the D+ grade
The composite is a weighted blend of 9 inputs, each scored 0–100. Each bar is that input's sub-score; the figure is the points it added to the 100-point composite (weight × sub-score).
- ARV discount +13.8/15.0
- Appreciation +10.0/10.0
- Cash flow +6.7/30.0
- Condition / age +4.0/5.0
- Schools +3.4/10.0
- Livability +3.3/5.0
- Rent growth +2.5/5.0
- 1% rule +2.0/10.0
- DSCR +1.0/10.0
$309,990
🖨 Deal sheet 📄 Offer letter ✓ Due diligence
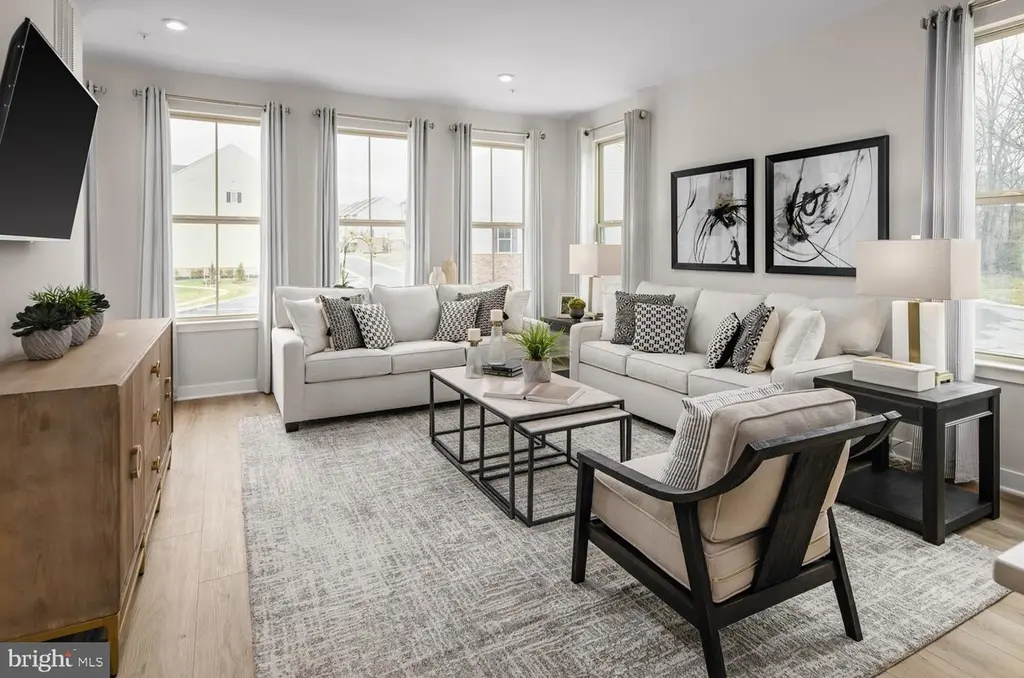
Listing remarks
Madison Greens — where space, style, and convenience come together. Introducing the to‑be‑built Cadence floorplan, a luxury townhome designed to live like a single‑family home, complete with a backyard and an unbeatable walkable location in the heart of Ranson, WV. Step inside and feel the difference- A welcoming foyer leads to a spacious lower‑level recreation room, perfect for movie nights, game days, or hosting friends. With the option to add a full bath, this level easily transforms into a private guest suite or home office. Enjoy a true open‑concept main level where the expansive great room flows into a stunning gourmet kitchen featuring a large center island, walk‑in pantry, and
Key facts
- Large center island
- Gourmet kitchen
- Owner's suite
Tags
Property features AI
Finance
- HOA & community: Monthly HOA fee of $75; HOA covers lawn maintenance, trash, and common area maintenance; Community amenities include basketball courts and a tot lot/playground
Exterior
- Parking: Attached front-entry garage with garage door opener and additional storage area; One garage space plus two driveway spaces (three total parking spaces); Asphalt driveway
- Utilities: Public water; Public sewer
- Home design: Interior townhouse/rowhouse; Built by RYAN HOMES; Fee simple ownership; Property condition listed as excellent
- Construction: Mixed construction materials; Slab foundation; Above-grade structure; Construction not completed (per listing)
- Exterior features: Level lot with a rear yard; Walkout-level fully finished basement with front entrance
Interior
- Kitchen: Dishwasher; Disposal; Microwave; Electric range/oven; Refrigerator; Stainless steel appliances; Energy-efficient appliances
- Bedrooms: Three bedrooms on the upper level
- Bathrooms: Two full bathrooms on the upper level; One half bathroom on the main level; Two full bathrooms total, one half bathroom total
- Heating & cooling: Forced air heating (electric); Central air conditioning (electric); Electric hot water
- Interior features: Open floor plan; Kitchen island; Pantry; Recessed lighting; Walk-in closets; Primary suite with private bath
- Laundry & utility: Upper-floor laundry hookups
Neighborhood map
What this means for you Summary
Snapshot
- This is a 3-bed/2.5-bath townhouse listed at $310k. Condition is rated good.
Deal economics
- At list price, monthly cash flow is $-492 ($-6k/yr) — negative.
- To cash-flow at today's rent, offer at most $239k (23.0% below list).
- To meet the 1% rule (rent ≥ 1% of price), the offer needs to be $218k (29.6% below list).
- Recommended offer: $218k (29.6% below list) — sets the bar for 1% rule.
Location & tenants
- Location reads 66/100 on livability (#100 in WV) — a middle-class / working-renter tenant base. Strengths: crime A+, housing A+, cost of living A-; Watch: amenities F, commute F, health & safety F.
- Jefferson County Schools (rural): math 29% / reading 46% proficiency, ranked #6 of 55 in WV (top 11%) — families likely to look elsewhere, expect single-tenant / working-renter base with shorter leases.
- Zoned schools: Wildwood Middle School (math 15% / reading 40%, grade F, #70 of 109 statewide, top 65%, 425 students, 0% FRL); Jefferson High School (math 30% / reading 62%, grade D-, #9 of 110 statewide, top 7%, 1,444 students, 0% FRL) — zoned schools average 0% FRL vs 33% district-wide (33 pts lower); this property's tenant base skews higher-income than the district average.
- Market conditions: 311 active listings in the ZIP; 13 comparable units currently listed for rent nearby; rentals leasing fast (median 5d on market — plan ~1-2 weeks tenant-placement turnaround); solid renter incomes; 1,162 units permitted in Jefferson County in 2024 (360 in 5+ unit buildings).
- This rent runs 32% of the median local income ($82k/yr) — at the standard rent-burdened threshold; future hikes will face affordability resistance.
Forward outlook
- In year one you build about $33k of equity ($2k loan paydown + $31k appreciation (10.0% local appreciation)).
- Jefferson County population projected at +13% by 2050 — modest demand growth; plan on rents tracking national, not racing it.
- By year 2, paydown + projected appreciation supports a ~$53k cash-out refi (75% LTV) — recoverable capital for the next deal without selling this one.
Negotiation context
- It's been on market 34 days — a 3% lower offer ($301k) is reasonable based on typical stale-listing flexibility.
Risks & watch-outs
- Climate carrying-cost: extreme-heat days projected 7→16/yr by 2055 (HVAC capex compounding) — expect insurance premiums to compound above CPI over the hold.
Questions for the listing agent
- What do current leases actually rent for vs. the listed asking? Can we see a recent rent roll and the last 12 months of T-12 income?
- It's been on market 34 days. Have you received any prior offers? Is the seller open to a 30% concession, seller financing, or rate buy-down credit?
- What does the HOA fee cover, when was the last increase, and are there any pending special assessments or reserve-fund shortfalls?
- Is there a deadline driving the sale (1031 exchange, divorce, estate, relocation)? That informs how much negotiation room exists.
- Schools are F-rated, which usually means shorter tenancies and higher turnover. Who's the typical renter profile here, and what's been the actual vacancy rate?
- The area grade is low — what's the realistic commute time and amenity access for the typical tenant pool here? Any planned neighborhood developments (good or bad) we should know about?
- What's the average days-on-market for RENTAL listings here right now (not sales)? A rising rental-DOM trend means longer vacancies and softer asking-rent achievability than the comps imply.
- What's the recent tenant-quality profile in this submarket — average credit score on applications, eviction rate, late-payment / NSF rate, and stable-employment percentage? A property-management company in the area should have these aggregated.
- How much new for-sale + rental construction is in the pipeline within 1–3 miles? Heavy new supply typically softens prices + rents 12–24 months out; constrained supply supports both.
Investment metrics
- 1% rule
- 0.70% ✗
- Cap rate
- 4.39%
- Cash-on-cash
- -6.81%
- DSCR
- 0.70
- GRM
- 11.8
CMA / ARV
- ARV (on-the-fly)
- $360,192
- Comps found
- 12
Show comp detail 12 sales within ~0.75 mi
| Address | Dist | Beds/Ba | Sqft | Sold | Price | $/sf | Match |
|---|---|---|---|---|---|---|---|
| 1737 Destrier St | 0.09mi | 3/3.0 | 2,144 (0%) | 2mo | $365,990 | $171 | 92 |
| 1725 Destrier St | 0.09mi | 4/3.5 (+1) | 2,144 (0%) | 1mo | $359,990 | $168 | 86 |
| 1313 Steed St | 0.17mi | 3/2.0 | 2,216 (+3%) | 4mo | $270,000 | $122 | 81 |
| 1353 Mare St | 0.23mi | 3/2.5 | 2,100 (-2%) | 6mo | $300,000 | $143 | 80 |
| 1327 Mare St | 0.22mi | 3/3.0 | 2,322 (+8%) | 0mo | $327,000 | $141 | 74 |
| 1233 Mare St | 0.23mi | 4/2.5 (+1) | 2,347 (+10%) | 8mo | $304,500 | $130 | 62 |
| 1226 Steed St | 0.22mi | 2/3.5 (-1) | 2,380 (+11%) | 10mo | $275,000 | $116 | 55 |
| 348 Anthem St #442 | 0.72mi | 3/2.5 | 1,891 (-12%) | 0mo | $344,990 | $182 | 46 |
| 376 Anthem St #449 | 0.73mi | 3/2.5 | 1,891 (-12%) | 0mo | $344,990 | $182 | 46 |
| 344 Anthem St #441 | 0.72mi | 3/2.5 | 1,891 (-12%) | 2mo | $350,000 | $185 | 45 |
| 316 Anthem St | 0.71mi | 3/2.5 | 1,891 (-12%) | 3mo | $359,990 | $190 | 45 |
| 200 Huntwell West Ave | 0.73mi | 4/3.5 (+1) | 1,989 (-7%) | 1mo | $319,500 | $161 | 44 |
Match score weights: distance 35% · size 25% · config 20% · recency 20%. Top-matched comps best support the ARV.
Projected returns pro-forma
10.0% appreciation · 3.0% rent growth · sell at horizon
- IRR
- 19.5%
- Equity multiple
- 2.58×
- Total profit
- $137,547
- Equity at exit
- $279,264
- IRR
- 17.9%
- Equity multiple
- 5.95×
- Total profit
- $429,872
- Equity at exit
- $602,242
Cash invested: $86,797 (down + closing). Projections, not guarantees.
Landlord ↔ Tenant lean methodology
- Overall (STATE)
- 83 Strongly Landlord-Friendly
- State West Virginia
- 83 Strongly Landlord-Friendly · R+22
- County
- — inherits STATE
- City
- — inherits STATE
ZIP-level market 25438
- Home prices YoY
- 10.3%
- Active inventory
- 311
- Price-to-rent
- 11.8×
Monthly cashflow live
- Estimated rent
- $2,183 high interval (Pro) →
- Mortgage (P&I)
- −$1,626
- Tax est. 1.5%
- −$387 /mo · $4,650/yr
- Insurance
- −$129
- HOA
- −$75
- Vacancy / Maint / Mgmt
- −$459
- Net cashflow
- $-492
Break-even live
UW: 25.0% down · 7.5% · 30yr · 1.5% tax · 5.0% vac · 8.0% maint · 8.0% mgmt
Financing live
Cash to close
- Down payment
- $77,498
- Closing costs
- $9,300
- Reserves months
- —
- Total cash needed
- —
Loan-product check · same deal, 3 products live
Conventional
25% down · 7.5% · 30yr
- Down + closing
- —
- Monthly P&I
- —
- Monthly cashflow
- —
- DSCR
- —
- Eligible?
- —
Personal DTI + credit; lowest rate.
DSCR
20% down · 8.5% · 30yr
- Down + closing
- —
- Monthly P&I
- —
- Monthly cashflow
- —
- DSCR
- —
- Eligible?
- —
No personal income docs; deal must DSCR.
Hard money
10% down · 12.0% · 12mo
- Down + closing
- —
- Monthly P&I
- —
- Monthly cashflow
- —
- DSCR
- —
- Eligible?
- —
Short-term bridge; refi at stabilization.
Rent comps 13 comps
| Address | Beds | Baths | Sqft | Rent | $/sqft | DOM | Units | Dist |
|---|---|---|---|---|---|---|---|---|
| 452 18th Ave Ranson, WV | 3.0 | 2.5 | 1726 | $1,995 | $1.16 | 4d | 1 | 0.08mi |
| 1344 Red Clover Ln Ranson, WV | 3.0 | 2.5 | 1723 | $2,099 | $1.22 | 12d | 1 | 0.12mi |
| 405 17th Ave Ranson, WV | 3.0 | 2.5 | 1725 | $2,150 | $1.25 | 5d | 1 | 0.16mi |
| 415 17th Ave Ranson, WV | 3.0 | 2.5 | 1521 | $1,990 | $1.31 | 24d | 1 | 0.16mi |
| 1247 Mare St Ranson, WV | 3.0 | 2.5 | 1985 | $2,080 | $1.05 | 24d | 1 | 0.23mi |
| 1130 Stallion St Ranson, WV | 3.0 | 2.5 | 1648 | $1,900 | $1.15 | 5d | 1 | 0.26mi |
| 300 Presidents Pointe Ave Ranson, WV | 3.0 | 2.5 | 1731 | $2,200 | $1.27 | 18d | 1 | 0.63mi |
| 112 Cecily Way Unit 112 Ranson, WV | 3.0 | 4.0 | 1905 | $2,100 | $1.10 | 5d | 1 | 0.73mi |
| 406 Freeman St Ranson, WV | 3.0 | 2.5 | 1906 | $2,600 | $1.36 | 3d | 1 | 0.77mi |
| 51 Cecily Way Ranson, WV | 3.0 | 2.5 | 1998 | $2,000 | $1.00 | 12d | 1 | 0.79mi |
| 37 Cecily Way Ranson, WV | 3.0 | 2.5 | 2540 | $2,100 | $0.83 | 24d | 1 | 0.80mi |
| 35 Short Branch Dr Ranson, WV | 3.0 | 2.5 | 1940 | $2,200 | $1.13 | 4d | 1 | 0.96mi |
| 271 Swan Field Ave Charles Town, WV | 3.0 | 2.5 | 1786 | $2,100 | $1.18 | 4d | 1 | 1.27mi |
HOA detail
- Monthly dues
- $75 · $900/yr
Listing history 9 events
-
2026-06-09days on market $309,990 Active 34 DOM
-
2026-06-08days on market $309,990 Active 33 DOM
-
2026-06-07days on market $309,990 Active 32 DOM
-
2026-06-04days on market $309,990 Active 29 DOM
-
2026-06-03days on market $309,990 Active 28 DOM
-
2026-06-02days on market $309,990 Active 27 DOM
-
2026-06-01days on market $309,990 Active 26 DOM
-
2026-05-31days on market $309,990 Active 25 DOM
-
2026-05-06$309,990 Active
ⓘ Source: listings_history table (triggers on properties + properties_extension) + one-shot
backfill from property_details.listing_events for pre-trigger history.
Climate risk First Street
- Flood 1/10 Low FEMA zone X (unshaded) · 0% chance over 30 yrs
- Wildfire 3/10 Moderate
- Heat 5/10 Major 7 d/yr ≥102°F today · 16 d/yr by 30 yrs out
- Wind 2/10 Low 3% chance of damaging wind over 30 yrs
- Air quality 2/10 Low 1 unhealthy d/yr today · 1 by 30 yrs out
Nearby sold comps map
Loading sold comps map…
Walkable amenities ~0.75 mi
Loading nearby amenities…
Taxation est. · year 1
- Rental income
- $26,201
- − Mortgage interest
- −$17,364
- − Property taxes
- −$4,650
- − Insurance
- −$1,550
- − Repairs & maintenance
- −$2,096
- − Management
- −$2,096
- − HOA
- −$900
- − Depreciation
- −$9,018
- Taxable loss
- −$11,473
- Est. tax savings @ 24.0%
- +$2,754
- After-tax cash flow
- $-3,155/yr
For passive investors: Depreciation is non-cash, so a rental often shows a tax loss while cash-flowing — sheltering income. Rental losses are passive: they offset passive income freely, and up to $25,000/yr can offset ordinary (W-2) income if you actively participate and your MAGI is under $100k (phasing out to $0 by $150k); unused losses carry forward. On sale, claimed depreciation is recaptured at up to 25%, and gains may owe capital-gains tax (a 1031 exchange can defer both). Figures are a year-1 estimate at your 24.0% rate — not tax advice; consult a CPA.
Condition & rehab AI · 1 photo
This townhouse is in excellent condition with no visible repairs needed. It offers a good return on investment with updates that can significantly enhance its resale and rental value.
Value-add opportunities
- Both Painting — Fresh paint can enhance curb appeal and interior aesthetics
- Both Lighting — Upgrading lighting fixtures can improve the ambiance and energy efficiency
- Both Window treatments — New window treatments can enhance privacy and energy efficiency
- Both Flooring — Replacing worn-out flooring can improve the overall look and feel of the home
Renovation cost estimate screening
Value-add ROI direction
- Both Painting — Fresh paint can enhance curb appeal and interior aesthetics ↑
- Both Lighting — Upgrading lighting fixtures can improve the ambiance and energy efficiency ↑
- Both Window treatments — New window treatments can enhance privacy and energy efficiency ↑
- Both Flooring — Replacing worn-out flooring can improve the overall look and feel of the home ↑
ⓘ Cost ranges are severity-bucket heuristics (US national rule-of-thumb). Get contractor quotes + a written scope before underwriting a rehab budget.
Schools (NCES district)
- District
- Jefferson County Schools
- NCES district ID
- 5400570
- Math proficiency
- 29% ▼ -13.00%
- Reading proficiency
- 46% ▼ -7.00%
- Median HH income
- $67,038
- Composite
- 33.98/100
- National rank
- #5322
- State rank
- #6 of 55 in WV
Livability — Ranson
- Score
- 66/100
- State rank
- #100
- US rank
- #11255
Category grades
Schools grade is shown separately in the Schools card above.
Census & demographics
- Census place
- Ranson, WV
- County
- Jefferson County · 28,403 people
- City population
- 7,330
- Metro
- Washington-Arlington-Alexandria, DC-VA-MD-WV
- Population (ZIP)
- 7,330
- Household income
- $81,875
- Rent vs Own
- Severe rent burden
- 90.0
Population outlook (Jefferson County) Hauer SSP2
- Today (2025)
- 61,715 people
- By 2030
- 64,052 · +3.8%
- By 2040
- 67,713 · +9.7%
- By 2050
- 69,843 · +13.2%
- By 2075
- 72,679 · +17.8%
- By 2100
- 71,872 · +16.5%
Race, ethnicity, and origin ACS 2023
- Neighborhood character
- Predominantly White (72%)
- Race & ethnicity
- White 72% Hispanic / Latino 14% Two or more races 7% Black 7% Asian 3%
- Hispanic origin (detail)
- Mexican 3% Puerto Rican 4%
- Common ancestry
- Serbian 4% Italian 2% Romanian 2%
- Foreign-born
- 7% · Canada, Philippines
- Languages at home
- 87% English-only · Spanish 9% Other Asian/Pacific 3%
Political lean MEDSL · Jefferson
- 2024 margin
- R (+15.8) · D 41.0% · R 56.8% · Other 2.1%
- 2008→2024 swing
- -20.6pp toward R · 2008: 4.8pp · 2024: -15.8pp
- All cycles
- 2024: R+15.8 2020: R+10.5 2016: R+15.3 2012: R+4.0 2008: D+4.8
Not yet ingested
- Civics
- —
Market trends
- HPI YoY
- ▲ 32.87%
- Current HPI
- 352.707
- Rent YoY
- —
- Metro
- Washington-Arlington-Alexandria, DC-VA-MD-WV
- State GDP YoY
- —
- F500 in state
- 0
Price history
1 event — show timeline
- 2026-05-06 Listed $309,990 BRIGHT MLS
Cash-flow waterfall
monthlySold comps — $/sqft
last 12 mo · ≤1 miLoading sold comps…