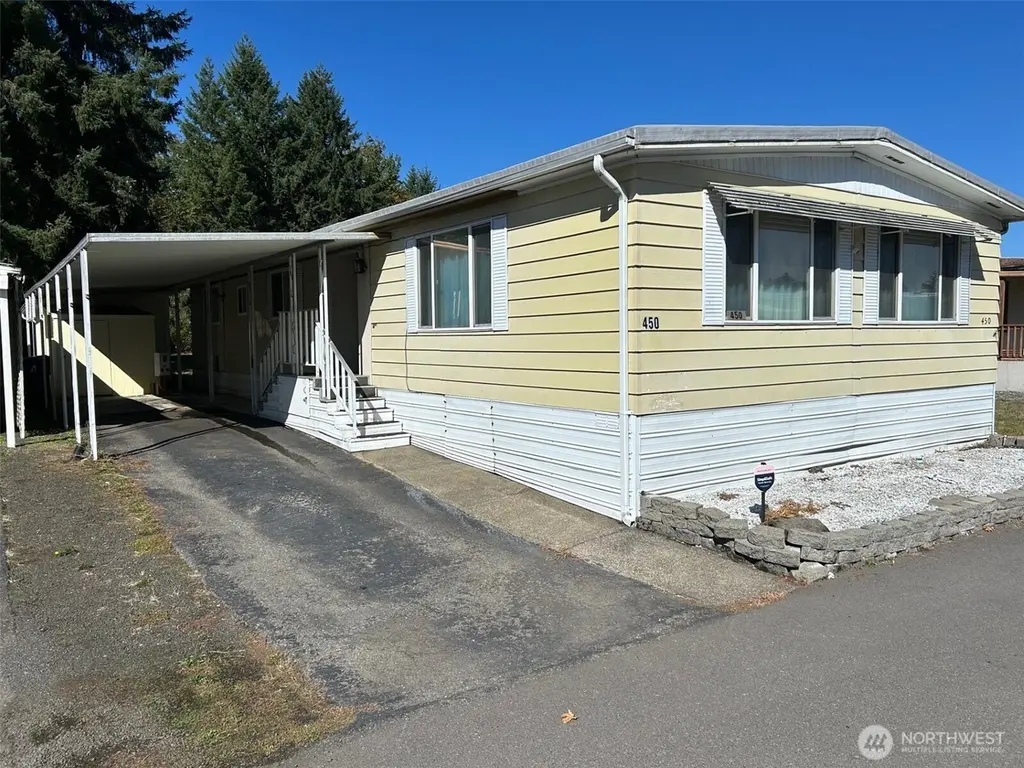
1111 Archwood Dr SW #450 · Olympia, WA
Flood risk No data
- FEMA flood zone
- —
- Chance of flooding over 30 yrs
- —
- Est. flood insurance / yr
- —
Fire risk No data
- Est. fire insurance / yr
- —
Heat risk No data
- Hot days now (above threshold)
- —
- Hot days in 30 yrs
- —
Wind risk No data
- Chance of severe wind over 30 yrs
- —
Air-quality risk No data
- Unhealthy air days now
- —
- Unhealthy air days in 30 yrs
- —
Risk factors via First Street. Map © Google.
Why this score? — see what drove the C grade
The composite is a weighted blend of 9 inputs, each scored 0–100. Each bar is that input's sub-score; the figure is the points it added to the 100-point composite (weight × sub-score).
- Cash flow +15.0/30.0
- Appreciation +10.0/10.0
- ARV discount +7.5/15.0
- Schools +6.2/10.0
- 1% rule +5.0/10.0
- DSCR +5.0/10.0
- Livability +4.2/5.0
- Rent growth +3.3/5.0
- Condition / age +2.5/5.0
$24,900
🖨 Deal sheet 📄 Offer letter ✓ Due diligence
Listing remarks
A Home That Blends Comfort, Community, and Convenience. Enjoy this well-maintained home tucked away on a quiet street in the 55+ community of Friendly Ridge. Take advantage of the updated clubhouse and its many amenities, or simply relax at home in one of your many rooms. There's bamboo flooring in the main living area, custom cabinetry in the formal dining room, carpeting in the bedrooms, new water heater and new flooring in utility room. Ample interior storage is complemented by two secure outdoor sheds. The kitchen opens to a generous covered patio which is perfect for year-round enjoyment. An efficient heat pump ensures comfort in every season, while the backyard offers privacy with it
Key facts
- Custom cabinetry
- Updated clubhouse
- Covered patio
Tags
Neighborhood map
What this means for you Summary
Snapshot
- This is a 3-bed/2.0-bath manufactured listed at $25k.
Deal economics
- At list price, monthly cash flow is $2k ($19k/yr) — positive.
- The deal already cash-flows at list — no discount required.
- Meets the 1% rule at list price ($2k rent vs $25k).
- Recommended offer: $22k (12.0% below list) — sets the bar for market timing.
- Cap rate 80.6% vs local median 2.4% in Olympia — top-decile yield for the area; either an underpriced asset or a hidden risk that comps aren't pricing in. Stress-test before assuming the spread holds.
Location & tenants
- Location reads 83/100 on livability (#58 in WA, #1,036 nationally) — a professional / high-income tenant draw. Strengths: amenities A+, commute A+, health & safety A+; Watch: crime F, cost of living D-.
- Olympia School District (urban): math 66% / reading 75% proficiency, ranked #17 of 291 in WA (top 6%) — strong family-tenant draw, lease renewals of 3-5y typical.
- Market conditions: Rents rising (+3.2%/yr); 304 active listings in the ZIP; 22 comparable units currently listed for rent nearby; rentals leasing fast (median 14d on market — plan ~1-2 weeks tenant-placement turnaround); solid renter incomes; 1,222 units permitted in Thurston County in 2024 (508 in 5+ unit buildings).
Forward outlook
- In year one you build about $3k of equity ($172 loan paydown + $2k appreciation (10.0% local appreciation)).
- Thurston County population projected at +27% by 2050 — long-run rental-demand tailwind backs the buy-and-hold thesis.
- At projected returns (10.0% appreciation + 3.2% rent growth), your $7k cash investment doubles in ~1 year — after that, you're playing with house money.
- By year 10, paydown + projected appreciation supports a ~$32k cash-out refi (75% LTV) — recoverable capital for the next deal without selling this one.
Negotiation context
- It's been on market 223 days — a 12% lower offer ($22k) is reasonable based on typical stale-listing flexibility.
- 6 sale attempts since 23y ago; this cycle's ask has dropped $38k (60%) from the opening price — seller is motivated, your offer sets the floor, not the list.
Questions for the listing agent
- It's been on market 223 days. Have you received any prior offers? Is the seller open to a 12% concession, seller financing, or rate buy-down credit?
- Built in 1976 — when were the roof, HVAC, electrical panel, plumbing, and water heater last replaced?
- Why hasn't it sold? Are there any deal-killer items the seller is aware of (foundation, flood, title, zoning, code violations)?
- Is there a deadline driving the sale (1031 exchange, divorce, estate, relocation)? That informs how much negotiation room exists.
- Schools are A-rated — typically a magnet for longer-tenancy family renters. What's the average tenant stay here, and is there a school-zone premium baked into asking?
- Crime grade is F in this area — have there been break-ins, vandalism, or insurance claims at this property in the last 3 years? What carrier currently insures it and at what premium?
- What's the average days-on-market for RENTAL listings here right now (not sales)? A rising rental-DOM trend means longer vacancies and softer asking-rent achievability than the comps imply.
- What's the recent tenant-quality profile in this submarket — average credit score on applications, eviction rate, late-payment / NSF rate, and stable-employment percentage? A property-management company in the area should have these aggregated.
- How much new for-sale + rental construction is in the pipeline within 1–3 miles? Heavy new supply typically softens prices + rents 12–24 months out; constrained supply supports both.
Investment metrics
- 1% rule
- 8.79% ✓
- Cap rate
- 80.61%
- Cash-on-cash
- 265.43%
- DSCR
- 12.81
- GRM
- 0.9
CMA / ARV
- ARV (median comp)
- $77,565
- List price
- $24,900
- Delta
- -67.90%
- Verdict
- UNDERPRICED
- Comps
- 10 within 1.0 mi
Show comp detail 12 sales within ~0.75 mi
| Address | Dist | Beds/Ba | Sqft | Sold | Price | $/sf | Match |
|---|---|---|---|---|---|---|---|
| 1111 Archwood Dr SW #204 | 0.11mi | 2/2.0 (-1) | 1,440 (0%) | 7mo | $95,000 | $66 | 84 |
| 1111 Archwood Dr SW #418 | 0.07mi | 3/2.0 | 1,344 (-7%) | 2mo | $22,000 | $16 | 84 |
| 1111 Archwood Dr SW #285 | 0.23mi | 2/2.0 (-1) | 1,431 (-1%) | 1mo | $105,000 | $73 | 83 |
| 1111 Archwood Dr SW #200 | 0.07mi | 2/2.0 (-1) | 1,344 (-7%) | 1mo | $60,000 | $45 | 80 |
| 1111 Archwood Dr SW #327 | 0.24mi | 3/2.0 | 1,404 (-2%) | 8mo | $215,000 | $153 | 78 |
| 1111 Archwood Dr SW #429 | 0.06mi | 3/2.0 | 1,528 (+6%) | 10mo | $75,000 | $49 | 78 |
| 1111 Archwood Dr SW #242 | 0.17mi | 3/2.0 | 1,372 (-5%) | 16mo | $145,950 | $106 | 71 |
| 1111 Archwood Dr SW #306 | 0.23mi | 3/2.0 | 1,568 (+9%) | 4mo | $75,000 | $48 | 71 |
| 1111 Archwood Dr SW #202 | 0.09mi | 3/2.0 | 1,568 (+9%) | 14mo | $110,000 | $70 | 69 |
| 1111 Archwood Dr SW #263 | 0.17mi | 2/2.0 (-1) | 1,320 (-8%) | 7mo | $85,000 | $64 | 67 |
| 1111 Archwood Dr SW #447 | 0.03mi | 3/2.0 | 1,248 (-13%) | 11mo | $79,500 | $64 | 67 |
| 1111 Archwood Dr SW #213 | 0.20mi | 3/2.0 | 1,568 (+9%) | 14mo | $150,000 | $96 | 64 |
Match score weights: distance 35% · size 25% · config 20% · recency 20%. Top-matched comps best support the ARV.
Projected returns pro-forma
10.0% appreciation · 3.16% rent growth · sell at horizon
- IRR
- —
- Equity multiple
- 17.09×
- Total profit
- $112,177
- Equity at exit
- $22,432
- IRR
- —
- Equity multiple
- 37.42×
- Total profit
- $253,905
- Equity at exit
- $48,375
Cash invested: $6,972 (down + closing). Projections, not guarantees.
Landlord ↔ Tenant lean methodology
- Overall (STATE)
- 28 Tenant-Leaning
- State Washington
- 28 Tenant-Leaning · D+8
- County
- — inherits STATE
- City
- — inherits STATE
ZIP-level market 98502
- Home prices YoY
- 1.8%
- Rents YoY
- 3.2%
- Active inventory
- 304
- Price-to-rent
- 0.9×
Monthly cashflow live
- Estimated rent
- $2,188 high interval (Pro) →
- Mortgage (P&I)
- −$131
- Tax from tax record
- −$45 /mo · $542/yr
- Insurance
- −$10
- HOA
- −$0
- Vacancy / Maint / Mgmt
- −$459
- Net cashflow
- $1,542
Break-even live
UW: 25.0% down · 7.5% · 30yr · 1.5% tax · 5.0% vac · 8.0% maint · 8.0% mgmt
Financing live
Cash to close
- Down payment
- $6,225
- Closing costs
- $747
- Reserves months
- —
- Total cash needed
- —
Loan-product check · same deal, 3 products live
Conventional
25% down · 7.5% · 30yr
- Down + closing
- —
- Monthly P&I
- —
- Monthly cashflow
- —
- DSCR
- —
- Eligible?
- —
Personal DTI + credit; lowest rate.
DSCR
20% down · 8.5% · 30yr
- Down + closing
- —
- Monthly P&I
- —
- Monthly cashflow
- —
- DSCR
- —
- Eligible?
- —
No personal income docs; deal must DSCR.
Hard money
10% down · 12.0% · 12mo
- Down + closing
- —
- Monthly P&I
- —
- Monthly cashflow
- —
- DSCR
- —
- Eligible?
- —
Short-term bridge; refi at stabilization.
Rent comps 22 comps
| Address | Beds | Baths | Sqft | Rent | $/sqft | DOM | Units | Dist |
|---|---|---|---|---|---|---|---|---|
| 3311 6th Ave SW Olympia, WA | 1.0–3.0 | 1.0–2.0 | 888 | $2,470 | $2.78 | 13d | 16 | 0.26mi |
| 800 Yauger Way SW Olympia, WA | 1.0–2.0 | 1.0–2.0 | 1034 | $2,131 | $2.06 | 13d | 13 | 0.27mi |
| 1900 Black Lake Blvd SW Olympia, WA | 1.0–3.0 | 1.0–2.0 | 925 | $2,137 | $2.31 | 13d | 13 | 0.60mi |
| 1309 Fern St SW Olympia, WA | 1.0–3.0 | 1.0–2.0 | 802 | $2,206 | $2.75 | 13d | 2 | 0.68mi |
| 1220 Fern St SW Olympia, WA | 2.0 | 2.0 | 900 | $1,850 | $2.06 | 43d | 2 | 0.79mi |
| 1000 Fern St SW Olympia, WA | 1.0–2.0 | 1.0–2.0 | 892 | $2,281 | $2.56 | 13d | 8 | 0.85mi |
| 4611 Greenwood Dr SW Olympia, WA | 3.0 | 3.0 | 1448 | $2,495 | $1.72 | 43d | 1 | 0.87mi |
| 2800 Limited Ln NW Olympia, WA | 1.0–2.0 | 1.0–2.0 | 775 | $1,503 | $1.94 | 13d | 4 | 0.90mi |
| 2010 8th Ct SW Olympia, WA | 2.0 | 2.0 | 1072 | $2,295 | $2.14 | 21d | 1 | 0.91mi |
| 300 Kenyon St NW Olympia, WA | 1.0–2.0 | 1.0–2.0 | 878 | $1,995 | $2.27 | 13d | 6 | 0.97mi |
| 600 Black Lake Blvd SW Olympia, WA | 1.0–2.0 | 1.0 | 851 | $1,600 | $1.88 | 13d | 23 | 0.98mi |
| 121 Decatur St NW Olympia, WA | 2.0 | 1.0 | 1000 | $1,695 | $1.70 | 21d | 1 | 1.19mi |
| 125 Decatur St NW Olympia, WA | 2.0 | 1.0 | 980 | $1,900 | $1.94 | 21d | 1 | 1.20mi |
| 5004 4th Way SW Olympia, WA | 2.0–3.0 | 2.0–2.5 | 1271 | $2,645 | $2.08 | 13d | 5 | 1.26mi |
| 2137 Conger Ave NW Unit C Olympia, WA | 3.0 | 2.0 | 1248 | $1,895 | $1.52 | 43d | 1 | 1.27mi |
| 2137 Conger Ave NW Unit A Olympia, WA | 3.0 | 2.0 | 1248 | $1,995 | $1.60 | 43d | 1 | 1.27mi |
| 1221 Evergreen Park Dr SW Olympia, WA | 2.0 | 1.0 | 880 | $1,749 | $1.99 | 13d | 2 | 1.33mi |
| 1415 Evergreen Park Dr SW Olympia, WA | 2.0 | 2.0 | 1050 | $1,735 | $1.65 | 13d | 1 | 1.36mi |
| 1626 Madison Ave NW Olympia, WA | 2.0 | 2.0 | 1064 | $2,100 | $1.97 | 13d | 1 | 1.41mi |
| 2820 Tuscany Ln SW Unit 411 Tumwater, WA | 2.0 | 1.0 | 915 | $1,635 | $1.79 | 43d | 1 | 1.46mi |
| 2820 Tuscany Ln SW Unit 714 Tumwater, WA | 2.0 | 2.0 | 1030 | $1,725 | $1.67 | 21d | 1 | 1.46mi |
| 2820 Tuscany Ln SW Tumwater, WA | 1.0–2.0 | 1.0–2.0 | 915 | $1,775 | $1.94 | 13d | 8 | 1.46mi |
Listing history 16 events
-
2026-04-22price $24,900
-
2026-04-12status Active
-
2026-03-04price $32,000
-
2026-01-13price $39,900
-
2025-12-19price $45,700
-
2025-11-23price $50,700
-
2025-10-05$62,700 Active
-
2024-06-17soldstatus $47,500 Closed
-
2024-06-05status Pending
-
2024-05-06status Active
-
2024-04-25status Pending
-
2024-04-17$60,000 Active
-
2011-11-04soldstatus $7,900 Sold
-
2011-08-04$14,790 Active
-
2003-08-14soldstatus $29,900
-
2003-05-04$29,900
ⓘ Source: listings_history table (triggers on properties + properties_extension) + one-shot
backfill from property_details.listing_events for pre-trigger history.
Tax reassessment forecast WA · Resets to sale price
- Current annual tax
- $542 · $45/mo
- Projected year-2 tax
- $542 · $45/mo
- Expected delta
- $0/yr ($0/mo · 0.0%)
ⓘ Screening estimate from a state-policy table — verify with the county assessor before closing.
Nearby sold comps map
Loading sold comps map…
Walkable amenities ~0.75 mi
Loading nearby amenities…
Taxation est. · year 1
- Rental income
- $26,252
- − Mortgage interest
- −$1,395
- − Property taxes
- −$542
- − Insurance
- −$124
- − Repairs & maintenance
- −$2,100
- − Management
- −$2,100
- − Depreciation
- −$724
- Taxable income
- $19,266
- Est. tax owed @ 24.0%
- −$4,624
- After-tax cash flow
- $13,882/yr
For passive investors: Depreciation is non-cash, so a rental often shows a tax loss while cash-flowing — sheltering income. Rental losses are passive: they offset passive income freely, and up to $25,000/yr can offset ordinary (W-2) income if you actively participate and your MAGI is under $100k (phasing out to $0 by $150k); unused losses carry forward. On sale, claimed depreciation is recaptured at up to 25%, and gains may owe capital-gains tax (a 1031 exchange can defer both). Figures are a year-1 estimate at your 24.0% rate — not tax advice; consult a CPA.
Schools (NCES district)
- District
- Olympia School District
- NCES district ID
- 5306180
- Math proficiency
- 66% ▼ -2.00%
- Reading proficiency
- 75% ▼ -2.00%
- Median HH income
- $63,852
- Composite
- 62.27/100
- National rank
- #1438
- State rank
- #17 of 291 in WA
Livability — Olympia
- Score
- 83/100
- State rank
- #58
- US rank
- #1036
Category grades
Schools grade is shown separately in the Schools card above.
Census & demographics
- Census place
- Olympia, WA
- County
- Thurston County · 269,345 people
- City population
- 98,428
- Metro
- Olympia-Lacey-Tumwater, WA
- Population (ZIP)
- 35,398
- Household income
- $92,207
- Rent vs Own
- Severe rent burden
- 1811.0
Population outlook (Thurston County) Hauer SSP2
- Today (2025)
- 308,239 people
- By 2030
- 326,483 · +5.9%
- By 2040
- 359,890 · +16.8%
- By 2050
- 391,800 · +27.1%
- By 2075
- 468,024 · +51.8%
- By 2100
- 519,890 · +68.7%
Race, ethnicity, and origin ACS 2023
- Neighborhood character
- Predominantly White (71%)
- Race & ethnicity
- White 71% Two or more races 13% Hispanic / Latino 11% Asian 6% Black 3% Native American 1%
- Hispanic origin (detail)
- Mexican 3% Puerto Rican 4%
- Common ancestry
- Italian 5% Portuguese 4% Iranian 3%
- Foreign-born
- 8% · Vietnam, Canada, China
- Languages at home
- 90% English-only · Spanish 3% Vietnamese 2% Other Asian/Pacific 1%
Political lean MEDSL · Thurston
- 2024 margin
- Strong D (+20.4) · D 58.5% · R 38.1% · Other 3.5%
- 2008→2024 swing
- -1.3pp toward R · 2008: 21.7pp · 2024: 20.4pp
- All cycles
- 2024: D+20.4 2020: D+18.6 2016: D+15.4 2012: D+19.0 2008: D+21.7
Not yet ingested
- Civics
- —
Market trends
- HPI YoY
- ▲ 18.49%
- Current HPI
- 1056.49
- Rent YoY
- ▲ 3.16%
- Metro
- Olympia-Lacey-Tumwater, WA
- State GDP YoY
- ▲ 4.65%
- F500 in state
- 22
Industry mix (Fortune 500 HQ in WA)
| Industry | F500 HQs | Revenue |
|---|---|---|
| Retail | 2 | $269B |
|
||
| Technology / Retail | 1 | $638B |
|
||
| Technology | 1 | $245B |
|
||
| Telecommunications | 1 | $38B |
|
||
| Food / Beverage | 1 | $36B |
|
||
| Automotive / Trucks | 1 | $34B |
|
||
Price history
-16.7% since first listed16 events — show timeline
- 2026-04-22 Price Changed $24,900 NWMLS as Distributed by MLS Grid
- 2026-04-12 Relisted — NWMLS as Distributed by MLS Grid
- 2026-03-04 Price Changed $32,000 NWMLS as Distributed by MLS Grid
- 2026-01-13 Price Changed $39,900 NWMLS as Distributed by MLS Grid
- 2025-12-19 Price Changed $45,700 NWMLS as Distributed by MLS Grid
- 2025-11-23 Price Changed $50,700 NWMLS as Distributed by MLS Grid
- 2025-10-05 Listed $62,700 NWMLS as Distributed by MLS Grid
- 2024-06-17 Sold (MLS) $47,500 NWMLS as Distributed by MLS Grid
- 2024-06-05 Pending — NWMLS as Distributed by MLS Grid
- 2024-05-06 Relisted — NWMLS as Distributed by MLS Grid
- 2024-04-25 Pending — NWMLS as Distributed by MLS Grid
- 2024-04-17 Listed $60,000 NWMLS as Distributed by MLS Grid
- 2011-11-04 Sold (MLS) $7,900 NWMLS as Distributed by MLS Grid
- 2011-08-04 Listed $14,790 NWMLS as Distributed by MLS Grid
- 2003-08-14 Sold (MLS) $29,900 NWMLS as Distributed by MLS Grid
- 2003-05-04 Listed $29,900 NWMLS as Distributed by MLS Grid
Property tax history
+4.3%/yrLatest (2026): $542 · +12.3% YoY. Source: county tax records.
Cash-flow waterfall
monthlySold comps — $/sqft
last 12 mo · ≤1 miLoading sold comps…