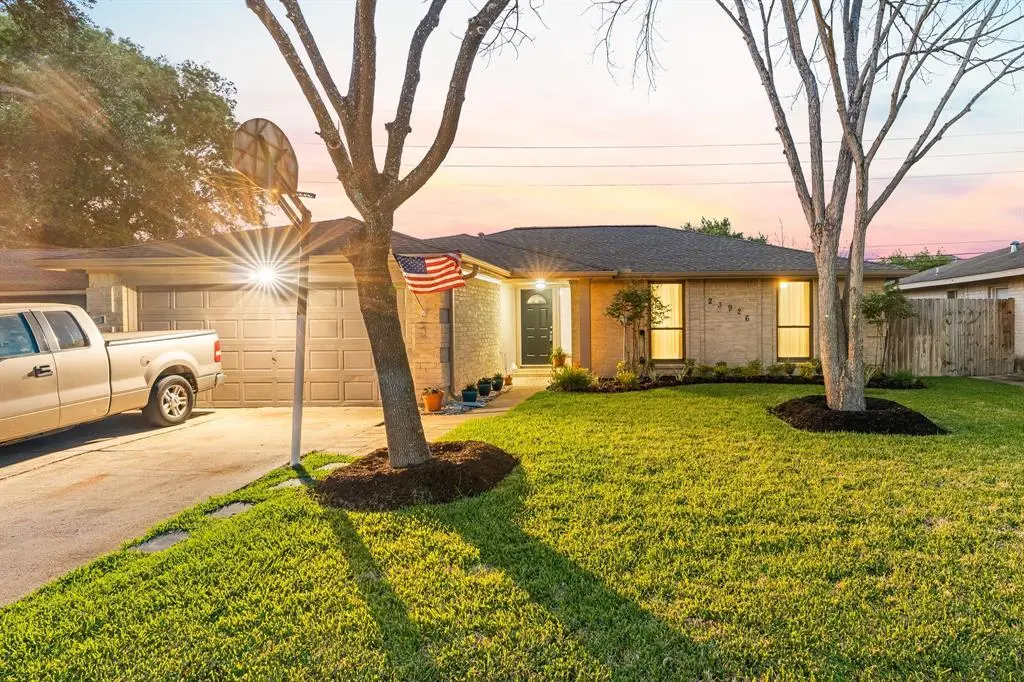
23926 Wassail Way · Houston, TX
Flood risk 4/10 · Minor
- FEMA flood zone
- X (unshaded)
- Chance of flooding over 30 yrs
- 0.22%
- Est. flood insurance / yr
- $507 – $1,088
Fire risk 4/10 · Minor
- Est. fire insurance / yr
- $1,222 – $2,270
Heat risk 9/10 · Severe
- Hot days now (above 111°F)
- 7 days/yr
- Hot days in 30 yrs
- 23 days/yr
Wind risk 9/10 · Severe
- Chance of severe wind over 30 yrs
- 99.0%
Air-quality risk 2/10 · Minimal
- Unhealthy air days now
- 1 days/yr
- Unhealthy air days in 30 yrs
- 2 days/yr
Risk factors via First Street. Map © Google.
Why this score? — see what drove the D- grade
The composite is a weighted blend of 9 inputs, each scored 0–100. Each bar is that input's sub-score; the figure is the points it added to the 100-point composite (weight × sub-score).
- Cash flow +11.6/30.0
- ARV discount +6.5/15.0
- Schools +5.7/10.0
- 1% rule +4.1/10.0
- Livability +3.7/5.0
- DSCR +3.4/10.0
- Condition / age +2.5/5.0
- Rent growth +2.3/5.0
- Appreciation +0.0/10.0
$269,900
🖨 Deal sheet 📄 Offer letter ✓ Due diligence
Listing remarks MLS
Welcome home! Pride in ownership shows in this 4 bedroom home that includes many upgrades and updated finishes. The entire home has beautiful new Anderson replacement windows and heavy duty sliding door that presents an abundance of natural light and back yard view. New light fixtures and lighting along with new crown molding offer nice finishes. Tile floors allow for easy maintenance. Other considerations are the newly installed roof, water heater, soffits, gutter guards, HOA award winning yard and fresh landscaping, full irrigation system and fencing. For your evening pleasure and or entertaining, don't miss the back yard oasis. The water feature is soft and relaxing and if you need more storage, the storage building is included. Call now for your private showing!
Key facts
- 6,899 sq ft lot
- 2 garage spots
- Community pool
Neighborhood map
What this means for you Summary
Snapshot
- This is a 4-bed/2.0-bath single-family listed at $270k.
Deal economics
- At list price, monthly cash flow is $-82 ($-983/yr) — negative.
- To cash-flow at today's rent, offer at most $255k (5.4% below list).
- To meet the 1% rule (rent ≥ 1% of price), the offer needs to be $244k (9.5% below list).
- Recommended offer: $244k (9.5% below list) — sets the bar for 1% rule.
- Cap rate 5.9% vs local median 3.2% in Houston — top-decile yield for the area; either an underpriced asset or a hidden risk that comps aren't pricing in. Stress-test before assuming the spread holds.
Location & tenants
- Location reads 74/100 on livability (#184 in TX, #4,771 nationally) — a middle-class / working-renter tenant base. Strengths: amenities A+, cost of living A+, housing A+; Watch: crime F.
- Katy ISD (suburban): math 61% / reading 63% proficiency, ranked #29 of 826 in TX (top 4%) — acceptable for families but not a draw, mixed tenant base, ~2y average lease.
- Zoned schools: Morton Ranch H S (math 31% / reading 55%, grade F, #713 of 1,632 statewide, top 44%, 2,718 students, 72% FRL) — zoned schools average 72% FRL vs 27% district-wide (45 pts higher); higher-poverty schools than district average — tighter screening recommended.
- Zoned-school proficiency averages 43% at this address vs 62% district-wide (-19 pts) — the specific schools serving this property underperform the Katy ISD average; the district grade overstates school quality for this exact location.
- Market conditions: Rents soft (-0.8%/yr); 2696 active listings in the ZIP; 29 comparable units currently listed for rent nearby; rentals leasing fast (median 10d on market — plan ~1-2 weeks tenant-placement turnaround); high-income renter base; 29,883 units permitted in Harris County in 2024 (8,621 in 5+ unit buildings).
Forward outlook
- Local home prices are declining (-3.0%/yr); year-one equity from $2k of loan paydown is wiped out by about $8k of value loss. Plan a longer hold.
- Harris County population projected at +47% by 2050 — long-run rental-demand tailwind backs the buy-and-hold thesis.
Negotiation context
- Only 14 days on market — expect competitive offers; lowballing is unlikely to land.
- 3 sale attempts since 3y ago with the ask held roughly flat each time — persistent listings suggest the price (not the market) is what's stuck; bring a comps-based counter.
Risks & watch-outs
- Climate carrying-cost: severe wind risk, 99% chance of damaging wind over 30y; extreme-heat days projected 7→23/yr by 2055 (HVAC capex compounding) — expect insurance premiums to compound above CPI over the hold.
Questions for the listing agent
- What do current leases actually rent for vs. the listed asking? Can we see a recent rent roll and the last 12 months of T-12 income?
- Built in 1978 — when were the roof, HVAC, electrical panel, plumbing, and water heater last replaced?
- What does the HOA fee cover, when was the last increase, and are there any pending special assessments or reserve-fund shortfalls?
- Is there a deadline driving the sale (1031 exchange, divorce, estate, relocation)? That informs how much negotiation room exists.
- Schools are D-rated, which usually means shorter tenancies and higher turnover. Who's the typical renter profile here, and what's been the actual vacancy rate?
- Crime grade is F in this area — have there been break-ins, vandalism, or insurance claims at this property in the last 3 years? What carrier currently insures it and at what premium?
- The area grade is low — what's the realistic commute time and amenity access for the typical tenant pool here? Any planned neighborhood developments (good or bad) we should know about?
- What's the average days-on-market for RENTAL listings here right now (not sales)? A rising rental-DOM trend means longer vacancies and softer asking-rent achievability than the comps imply.
- What's the recent tenant-quality profile in this submarket — average credit score on applications, eviction rate, late-payment / NSF rate, and stable-employment percentage? A property-management company in the area should have these aggregated.
- How much new for-sale + rental construction is in the pipeline within 1–3 miles? Heavy new supply typically softens prices + rents 12–24 months out; constrained supply supports both.
Investment metrics
- 1% rule
- 0.91% ✗
- Cap rate
- 5.93%
- Cash-on-cash
- -1.30%
- DSCR
- 0.94
- GRM
- 9.2
CMA / ARV
- ARV (on-the-fly)
- $264,040
- Comps found
- 12
Show comp detail 12 sales within ~0.75 mi
| Address | Dist | Beds/Ba | Sqft | Sold | Price | $/sf | Match |
|---|---|---|---|---|---|---|---|
| 23907 Pepperrell Place St | 0.12mi | 3/2.0 (-1) | 1,684 (+5%) | 13mo | $269,500 | $160 | 71 |
| 1915 Tarpley Ct | 0.07mi | 3/2.0 (-1) | 1,496 (-7%) | 13mo | $284,900 | $190 | 69 |
| 24126 Whitefield Ln | 0.44mi | 3/2.0 (-1) | 1,581 (-2%) | 9mo | $224,900 | $142 | 64 |
| 2518 Trotter Dr | 0.50mi | 3/2.0 (-1) | 1,548 (-4%) | 5mo | $258,000 | $167 | 62 |
| 24011 Tayloe House Ln | 0.28mi | 3/2.0 (-1) | 1,435 (-11%) | 5mo | $225,000 | $157 | 60 |
| 1951 Kings Arms Way | 0.13mi | 3/2.0 (-1) | 1,413 (-12%) | 12mo | $249,900 | $177 | 58 |
| 2039 Wigmaker Dr | 0.42mi | 3/2.0 (-1) | 1,540 (-4%) | 12mo | $235,000 | $153 | 58 |
| 24134 Griffin House Ln | 0.45mi | 3/2.0 (-1) | 1,522 (-6%) | 9mo | $250,000 | $164 | 58 |
| 24107 Bassett Hall Ln | 0.19mi | 3/2.5 (-1) | 1,851 (+15%) | 5mo | $255,000 | $138 | 55 |
| 24314 Schivener House | 0.50mi | 3/2.0 (-1) | 1,753 (+9%) | 6mo | $270,000 | $154 | 52 |
| 24414 Leachwood Dr | 0.61mi | 4/2.0 | 1,701 (+6%) | 14mo | $280,000 | $165 | 50 |
| 24006 Scrivener Ln | 0.47mi | 3/2.0 (-1) | 1,445 (-10%) | 12mo | $279,900 | $194 | 46 |
Match score weights: distance 35% · size 25% · config 20% · recency 20%. Top-matched comps best support the ARV.
Projected returns pro-forma
-3.0% appreciation · 0.0% rent growth · sell at horizon
- IRR
- -22.1%
- Equity multiple
- 0.26×
- Total profit
- $-55,988
- Equity at exit
- $40,243
- IRR
- -27.0%
- Equity multiple
- -0.09×
- Total profit
- $-82,634
- Equity at exit
- $23,336
Cash invested: $75,572 (down + closing). Projections, not guarantees.
Landlord ↔ Tenant lean methodology
- Overall (STATE)
- 87 Strongly Landlord-Friendly
- State Texas
- 87 Strongly Landlord-Friendly · R+5
- County
- — inherits STATE
- City
- — inherits STATE
ZIP-level market 77493
- Rents YoY
- -0.8%
- Active inventory
- 2696
- Price-to-rent
- 9.2×
Monthly cashflow live
- Estimated rent
- $2,444 high interval (Pro) →
- Mortgage (P&I)
- −$1,415
- Tax from tax record
- −$445 /mo · $5,337/yr
- Insurance
- −$112
- HOA
- −$40
- Vacancy / Maint / Mgmt
- −$513
- Net cashflow
- $-82
Break-even live
UW: 25.0% down · 7.5% · 30yr · 1.5% tax · 5.0% vac · 8.0% maint · 8.0% mgmt
Financing live
Cash to close
- Down payment
- $67,475
- Closing costs
- $8,097
- Reserves months
- —
- Total cash needed
- —
Loan-product check · same deal, 3 products live
Conventional
25% down · 7.5% · 30yr
- Down + closing
- —
- Monthly P&I
- —
- Monthly cashflow
- —
- DSCR
- —
- Eligible?
- —
Personal DTI + credit; lowest rate.
DSCR
20% down · 8.5% · 30yr
- Down + closing
- —
- Monthly P&I
- —
- Monthly cashflow
- —
- DSCR
- —
- Eligible?
- —
No personal income docs; deal must DSCR.
Hard money
10% down · 12.0% · 12mo
- Down + closing
- —
- Monthly P&I
- —
- Monthly cashflow
- —
- DSCR
- —
- Eligible?
- —
Short-term bridge; refi at stabilization.
Rent comps 29 comps
| Address | Beds | Baths | Sqft | Rent | $/sqft | DOM | Units | Dist |
|---|---|---|---|---|---|---|---|---|
| 2031 Wigmaker Dr Katy, TX | 3.0 | 2.0 | 1430 | $1,800 | $1.26 | 5d | 1 | 0.40mi |
| 1724 Partnership Way Katy, TX | 3.0 | 1.0–3.5 | 1536 | $3,340 | $2.17 | 1d | 86 | 0.56mi |
| 24414 Leachwood Dr Katy, TX | 4.0 | 2.0 | 1701 | $2,195 | $1.29 | 18d | 1 | 0.60mi |
| 1616 Partnership Way Katy, TX | 3.0 | 1.0–3.0 | 1283 | $2,995 | $2.33 | 5d | 47 | 0.67mi |
| 23223 First Park Dr Unit 23256 Katy, TX | 3.0 | 2.0 | 1403 | $2,283 | $1.63 | 43d | 1 | 0.75mi |
| 23223 First Park Dr Unit 3174 Katy, TX | 3.0 | 2.0 | 1403 | $2,272 | $1.62 | 10d | 1 | 0.75mi |
| 23223 First Park Dr Unit 3187 Katy, TX | 3.0 | 2.0 | 1403 | $2,240 | $1.60 | 2d | 1 | 0.75mi |
| 24002 Colonial Pkwy Katy, TX | 1.0–3.0 | 1.0–2.0 | 1072 | $2,262 | $2.11 | 1d | 32 | 0.75mi |
| 22819 Carter Moir Ln Katy, TX | 3.0 | 2.0 | 1650 | $1,895 | $1.15 | 16d | 1 | 0.88mi |
| 1508 Colonial Gorge Dr Katy, TX | 4.0 | 2.5 | 1904 | $2,650 | $1.39 | 16d | 1 | 0.94mi |
| 1330 Park West Green Dr Unit 1363 Katy, TX | 3.0 | 2.0 | 1451 | $2,212 | $1.52 | 15d | 1 | 0.96mi |
| 22822 Capitol Landing Ln Katy, TX | 3.0 | 2.0 | 1702 | $1,399 | $0.82 | 21d | 1 | 0.98mi |
| 1330 W Park Green Dr Katy, TX | 1.0–3.0 | 1.0–2.0 | 1058 | $2,222 | $2.10 | 43d | 16 | 0.99mi |
| 1330 W Park Green Dr Katy, TX | 1.0–3.0 | 1.0–2.0 | 1058 | $2,297 | $2.17 | 2d | 17 | 0.99mi |
| 23050 Morton Ranch Rd Katy, TX | 1.0–3.0 | 1.0–2.0 | 1109 | $2,609 | $2.35 | 1d | 31 | 1.14mi |
| 2150 Katy Fort Bend Rd Unit 2183 Katy, TX | 3.0 | 2.0 | 1272 | $1,821 | $1.43 | 43d | 1 | 1.18mi |
| 2150 Katy Fort Bend Rd Unit 3174 Katy, TX | 3.0 | 2.0 | 1272 | $1,856 | $1.46 | 2d | 1 | 1.18mi |
| 1700 Katy Fort Bend Rd Katy, TX | 1.0–3.0 | 1.0–2.0 | 1094 | $2,415 | $2.21 | 1d | 33 | 1.20mi |
| 22510 Leedstown Ln Katy, TX | 3.0 | 2.0 | 1282 | $1,649 | $1.29 | 5d | 1 | 1.22mi |
| 3031 Bugatti Dr Katy, TX | 3.0 | 2.5 | 2100 | $1,700 | $0.81 | 24d | 1 | 1.24mi |
| 150 Cobia Dr Unit 3187 Katy, TX | 3.0 | 2.0 | 1454 | $1,962 | $1.35 | 2d | 1 | 1.35mi |
| 150 Cobia Dr Unit 3174 Katy, TX | 3.0 | 2.0 | 1454 | $1,994 | $1.37 | 10d | 1 | 1.35mi |
| 150 Cobia Dr Unit 183 Katy, TX | 3.0 | 2.0 | 1454 | $2,005 | $1.38 | 43d | 1 | 1.35mi |
| 24151 Bella Dolce Ln Unit 24184 Katy, TX | 3.0 | 2.0 | 1509 | $2,496 | $1.65 | 43d | 1 | 1.41mi |
| 24151 Bella Dolce Ln Unit 1 Katy, TX | 3.0 | 2.5 | 1509 | $2,313 | $1.53 | 43d | 1 | 1.41mi |
| 24151 Bella Dolce Ln Unit 3174 Katy, TX | 3.0 | 2.0 | 1509 | $2,254 | $1.49 | 10d | 1 | 1.41mi |
| 24151 Bella Dolce Ln Unit 3112 Katy, TX | 3.0 | 2.0 | 1509 | $2,222 | $1.47 | 2d | 1 | 1.41mi |
| 23615 Western Centre Dr Katy, TX | 1.0–3.0 | 1.0–2.0 | 1011 | $2,230 | $2.20 | 1d | 30 | 1.44mi |
| 3206 Peek Rd Katy, TX | 3.0 | 2.0 | 1535 | $2,279 | $1.48 | 43d | 1 | 1.45mi |
HOA detail
- Monthly dues
- $40 · $480/yr
- Likely covers
- waterlandscaping
Listing history 8 events
-
2026-06-18days on market $269,900 Coming Soon 14 DOM
-
2026-06-17days on market $269,900 Coming Soon 13 DOM
-
2026-06-16days on market $269,900 Coming Soon 12 DOM
-
2026-06-15days on market $269,900 Coming Soon 11 DOM
-
2026-06-13days on market $269,900 Coming Soon 9 DOM
-
2026-06-09days on market $269,900 Coming Soon 5 DOM
-
2026-06-08days on market $269,900 Coming Soon 4 DOM
-
2026-06-07$269,900 Coming Soon 3 DOM
ⓘ Source: listings_history table (triggers on properties + properties_extension) + one-shot
backfill from property_details.listing_events for pre-trigger history.
Tax reassessment forecast TX · Resets to sale price
- Current annual tax
- $5,337 · $445/mo
- Projected year-2 tax
- $5,337 · $445/mo
- Expected delta
- $0/yr ($0/mo · 0.0%)
ⓘ Screening estimate from a state-policy table — verify with the county assessor before closing.
Climate risk First Street
- Flood 4/10 Moderate FEMA zone X (unshaded) · 22% chance over 30 yrs
- Wildfire 4/10 Moderate
- Heat 9/10 Extreme 7 d/yr ≥111°F today · 23 d/yr by 30 yrs out
- Wind 9/10 Extreme 99% chance of damaging wind over 30 yrs
- Air quality 2/10 Low 1 unhealthy d/yr today · 2 by 30 yrs out
Nearby sold comps map
Loading sold comps map…
Walkable amenities ~0.75 mi
Loading nearby amenities…
Taxation est. · year 1
- Rental income
- $29,326
- − Mortgage interest
- −$15,119
- − Property taxes
- −$5,337
- − Insurance
- −$1,350
- − Repairs & maintenance
- −$2,346
- − Management
- −$2,346
- − HOA
- −$480
- − Depreciation
- −$7,852
- Taxable loss
- −$5,503
- Est. tax savings @ 24.0%
- +$1,321
- After-tax cash flow
- $337/yr
For passive investors: Depreciation is non-cash, so a rental often shows a tax loss while cash-flowing — sheltering income. Rental losses are passive: they offset passive income freely, and up to $25,000/yr can offset ordinary (W-2) income if you actively participate and your MAGI is under $100k (phasing out to $0 by $150k); unused losses carry forward. On sale, claimed depreciation is recaptured at up to 25%, and gains may owe capital-gains tax (a 1031 exchange can defer both). Figures are a year-1 estimate at your 24.0% rate — not tax advice; consult a CPA.
Schools (NCES district)
- District
- Katy ISD
- NCES district ID
- 4825170
- Math proficiency
- 61% ▼ -7.00%
- Reading proficiency
- 63% ▼ -3.00%
- Median HH income
- $90,312
- Composite
- 56.59/100
- National rank
- #1146
- State rank
- #29 of 826 in TX
Livability — Houston
- Score
- 74/100
- State rank
- #184
- US rank
- #4771
Category grades
Schools grade is shown separately in the Schools card above.
Census & demographics
- County
- Harris County · 4,702,590 people
- City population
- 413,575
- Metro
- Houston-The Woodlands-Sugar Land, TX
- Population (ZIP)
- 71,484
- Household income
- $118,464
- Rent vs Own
- Severe rent burden
- 913.0
Population outlook (Harris County) Hauer SSP2
- Today (2025)
- 5,571,493 people
- By 2030
- 6,089,821 · +9.3%
- By 2040
- 7,142,806 · +28.2%
- By 2050
- 8,185,864 · +46.9%
- By 2075
- 10,574,329 · +89.8%
- By 2100
- 12,109,958 · +117.4%
Race, ethnicity, and origin ACS 2023
- Neighborhood character
- Highly diverse neighborhood (Simpson 0.73)
- Race & ethnicity
- White 36% Hispanic / Latino 33% Two or more races 16% Black 15% Asian 12%
- Hispanic origin (detail)
- Mexican 20%
- Common ancestry
- Lithuanian 2% Slovak 1% Italian 1%
- Foreign-born
- 21% · Canada, Vietnam, Jamaica
- Languages at home
- 64% English-only · Spanish 22% Vietnamese 5% French/Haitian/Cajun 4%
Political lean MEDSL · Harris
- 2024 margin
- Lean D (+5.5) · D 52.0% · R 46.4% · Other 1.6%
- 2008→2024 swing
- +3.9pp toward D · 2008: 1.6pp · 2024: 5.5pp
- All cycles
- 2024: D+5.5 2020: D+13.3 2016: D+12.4 2012: D+0.1 2008: D+1.6
Not yet ingested
- Civics
- —
Market trends
- HPI YoY
- ▼ -140.65%
- Current HPI
- 233.1683
- Rent YoY
- ▼ -0.80%
- Metro
- Houston-The Woodlands-Sugar Land, TX
- State GDP YoY
- ▲ 3.95%
- F500 in state
- 110
Industry mix (Fortune 500 HQ in TX)
| Industry | F500 HQs | Revenue |
|---|---|---|
| Energy | 16 | $1,198B |
|
||
| Technology | 5 | $198B |
|
||
| Engineering / Construction | 4 | $72B |
|
||
| Energy Services | 3 | $60B |
|
||
| Utilities | 3 | $41B |
|
||
| Healthcare | 2 | $330B |
|
||
Price history
+0.4% since first listed12 events — show timeline
- 2026-06-04 Coming Soon $269,900 HARMLS
- 2023-06-22 Sold (Public Records) — Public Records
- 2023-06-22 Sold (MLS) — HARMLS
- 2023-05-28 Pending — HARMLS
- 2023-05-22 Pending — HARMLS
- 2023-05-17 Relisted — HARMLS
- 2023-05-12 Pending — HARMLS
- 2023-04-11 Relisted — HARMLS
- 2023-04-03 Pending — HARMLS
- 2023-03-29 Listed $268,870 HARMLS
- 2023-03-28 Coming Soon $268,870 HARMLS
- 1988-08-27 Sold (Public Records) — Public Records
Property tax history
+4.5%/yrLatest (2025): $5,337 · -6.2% YoY. Source: county tax records.
Cash-flow waterfall
monthlySold comps — $/sqft
last 12 mo · ≤1 miLoading sold comps…