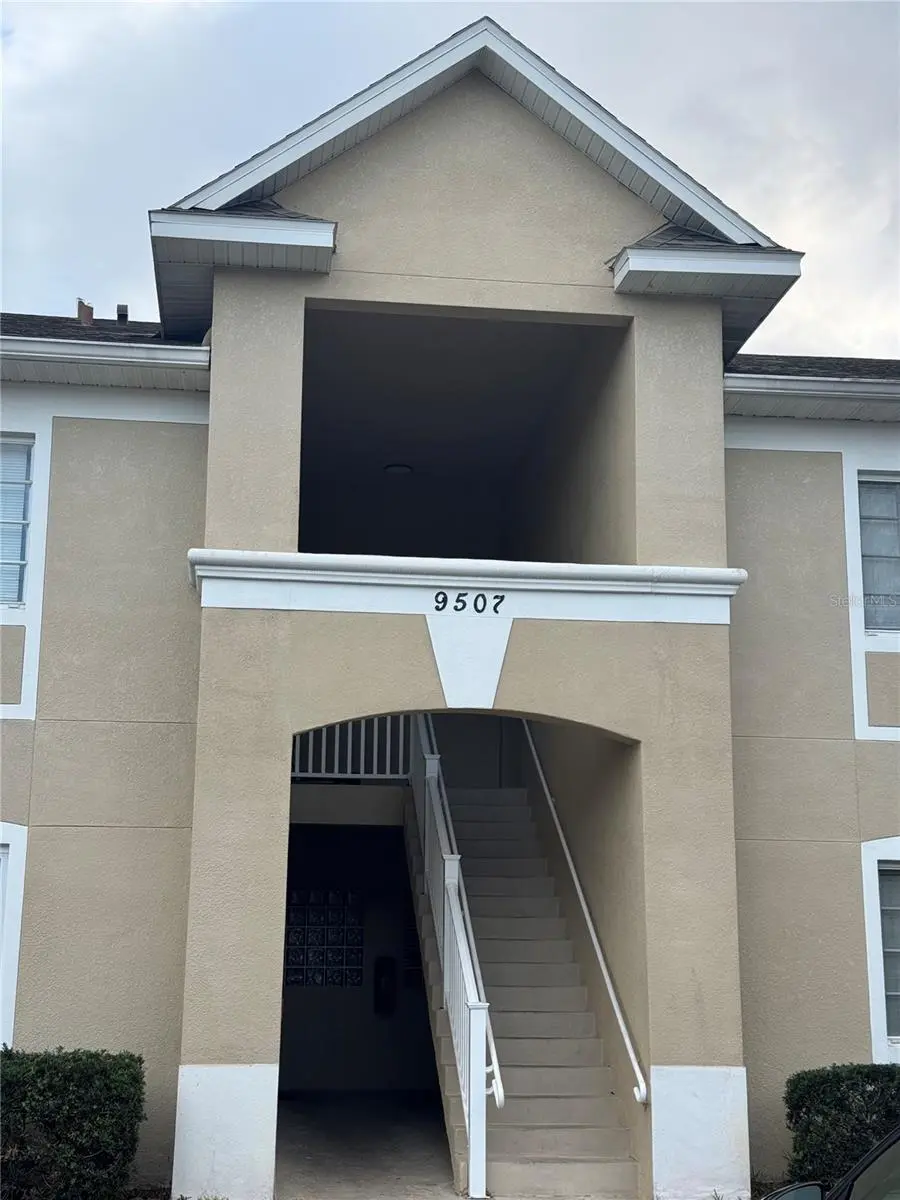
9507 Amberdale Ct #201 · Riverview, FL
Flood risk 1/10 · Minimal
- FEMA flood zone
- X (unshaded)
- Chance of flooding over 30 yrs
- 0.0%
- Est. flood insurance / yr
- $507 – $1,088
Fire risk 2/10 · Minimal
- Est. fire insurance / yr
- $947 – $1,759
Heat risk 10/10 · Severe
- Hot days now (above 109°F)
- 7 days/yr
- Hot days in 30 yrs
- 27 days/yr
Wind risk 9/10 · Severe
- Chance of severe wind over 30 yrs
- 99.0%
Air-quality risk 4/10 · Minor
- Unhealthy air days now
- 4 days/yr
- Unhealthy air days in 30 yrs
- 5 days/yr
Risk factors via First Street. Map © Google.
Why this score? — see what drove the D grade
The composite is a weighted blend of 9 inputs, each scored 0–100. Each bar is that input's sub-score; the figure is the points it added to the 100-point composite (weight × sub-score).
- Cash flow +10.0/30.0
- ARV discount +7.5/15.0
- 1% rule +7.3/10.0
- Schools +4.2/10.0
- Livability +4.0/5.0
- DSCR +2.8/10.0
- Condition / age +2.5/5.0
- Rent growth +2.3/5.0
- Appreciation +0.0/10.0
$165,000
🖨 Deal sheet (PDF) 📄 Offer letter ✓ Due diligence
Listing remarks MLS
Welcome to this stunning condo located on the desirable top floor of a secure, gated community in Riverview. This spacious 3-bedroom, 2 bathroom unit features an open floor plan with no carpet - enjoy beautiful hardwood flooring throughout. Relax on your private balcony or enjoy the resort-style community amenities, including a pool, fitness center, playground, and clubhouse. Perfectly situated near I-75 and US-301, you are minutes away from top-tier shopping, dining, and an easy commute to downtown Tampa and Tampa International Airport. Schedule your showing today!
Key facts
- Gated community
- Fitness center
- Private balcony
Tags
Neighborhood map
What this means for you Summary
Snapshot
- This is a 3-bed/2.0-bath condo listed at $165k.
Deal economics
- At list price, monthly cash flow is $-101 ($-1k/yr) — negative.
- To cash-flow at today's rent, offer at most $147k (10.8% below list).
- Meets the 1% rule at list price ($2k rent vs $165k).
- Recommended offer: $147k (10.8% below list) — sets the bar for cash-flow.
Location & tenants
- Location reads 79/100 on livability (#134 in FL, #2,000 nationally) — a middle-class / working-renter tenant base. Strengths: housing A+, health & safety A+, employment B+; Watch: amenities F.
- Hillsborough (suburban): math 47% / reading 50% proficiency, ranked #41 of 73 in FL (top 56%) — families likely to look elsewhere, expect single-tenant / working-renter base with shorter leases.
- Zoned schools: Ippolito Elementary School (math 35% / reading 34%, grade F, #1,709 of 2,144 statewide, top 81%, 553 students, 70% FRL); Giunta Middle School (math 22% / reading 28%, grade F, #517 of 571 statewide, top 91%, 857 students, 74% FRL); Spoto High School (math 25% / reading 36%, grade F, #434 of 667 statewide, top 66%, 1,823 students, 57% FRL).
- Zoned-school proficiency averages 30% at this address vs 48% district-wide (-18 pts) — the specific schools serving this property underperform the Hillsborough average; the district grade overstates school quality for this exact location.
- Market conditions: Rents soft (-0.9%/yr); 572 active listings in the ZIP; 40 comparable units currently listed for rent nearby; rentals at typical pace (median 17d on market — plan ~3-4 weeks tenant-placement turnaround); solid renter incomes; 9,053 units permitted in Hillsborough County in 2024 (4,555 in 5+ unit buildings).
Forward outlook
- Local home prices are declining (-3.0%/yr); year-one equity from $1k of loan paydown is wiped out by about $5k of value loss. Plan a longer hold.
- Hillsborough County population projected at +37% by 2050 — long-run rental-demand tailwind backs the buy-and-hold thesis.
Negotiation context
- It's been on market 100 days — a 9% lower offer ($150k) is reasonable based on typical stale-listing flexibility.
- 10 sale attempts since 18y ago with the ask held roughly flat each time — persistent listings suggest the price (not the market) is what's stuck; bring a comps-based counter.
Risks & watch-outs
- Watch-outs: HOA is 22% of rent.
- Climate carrying-cost: severe wind risk, 99% chance of damaging wind over 30y; extreme-heat days projected 7→27/yr by 2055 (HVAC capex compounding) — expect insurance premiums to compound above CPI over the hold.
Questions for the listing agent
- What do current leases actually rent for vs. the listed asking? Can we see a recent rent roll and the last 12 months of T-12 income?
- It's been on market 100 days. Have you received any prior offers? Is the seller open to a 11% concession, seller financing, or rate buy-down credit?
- What does the HOA fee cover, when was the last increase, and are there any pending special assessments or reserve-fund shortfalls?
- Any open or pending special assessments — roof, HVAC, plumbing, elevator, façade? What's the per-unit balance and payoff schedule, and is the seller paying it off at close or rolling it to the buyer?
- Why hasn't it sold? Are there any deal-killer items the seller is aware of (foundation, flood, title, zoning, code violations)?
- Is there a deadline driving the sale (1031 exchange, divorce, estate, relocation)? That informs how much negotiation room exists.
- Schools are B-rated — typically a magnet for longer-tenancy family renters. What's the average tenant stay here, and is there a school-zone premium baked into asking?
- The area grade is low — what's the realistic commute time and amenity access for the typical tenant pool here? Any planned neighborhood developments (good or bad) we should know about?
- What's the average days-on-market for RENTAL listings here right now (not sales)? A rising rental-DOM trend means longer vacancies and softer asking-rent achievability than the comps imply.
- What's the recent tenant-quality profile in this submarket — average credit score on applications, eviction rate, late-payment / NSF rate, and stable-employment percentage? A property-management company in the area should have these aggregated.
- How much new apartment / multifamily construction is in the pipeline within 1–3 miles? Heavy new supply (>2% of stock underway) typically softens rents 12–24 months out; light construction supports rent growth.
Investment metrics
- 1% rule
- 1.23% ✓
- Cap rate
- 5.56%
- Cash-on-cash
- -2.62%
- DSCR
- 0.88
- GRM
- 6.7
CMA / ARV
No comps found within radius.
Projected returns pro-forma
-3.0% appreciation · 0.0% rent growth · sell at horizon
- IRR
- -25.7%
- Equity multiple
- 0.16×
- Total profit
- $-38,747
- Equity at exit
- $24,602
- IRR
- -49.5%
- Equity multiple
- -0.38×
- Total profit
- $-63,533
- Equity at exit
- $14,266
Cash invested: $46,200 (down + closing). Projections, not guarantees.
Landlord ↔ Tenant lean methodology
- Overall (STATE)
- 87 Strongly Landlord-Friendly
- State Florida
- 87 Strongly Landlord-Friendly · R+3
- County
- — inherits STATE
- City
- — inherits STATE
ZIP-level market 33578
- Home prices YoY
- -12.9%
- Rents YoY
- -0.9%
- Active inventory
- 572
- Price-to-rent
- 6.7×
Monthly cashflow live
- Estimated rent
- $2,037 high interval (Pro) →
- Mortgage (P&I)
- −$865
- Tax from tax record
- −$337 /mo · $4,046/yr
- Insurance
- −$69
- HOA
- −$439
- Vacancy / Maint / Mgmt
- −$428
- Net cashflow
- $-101
Break-even live
Sensitivity live
| Price | -10% $-7 | -5% $-54 | +0% $-101 | +5% $-148 | +10% $-194 |
|---|---|---|---|---|---|
| Rent | -10% $-262 | -5% $-181 | +0% $-101 | +5% $-20 | +10% $60 |
| Rate | -1.0pp $-18 | -0.5pp $-59 | base $-101 | +0.5pp $-144 | +1.0pp $-187 |
UW: 25.0% down · 7.5% · 30yr · 1.5% tax · 5.0% vac · 8.0% maint · 8.0% mgmt
Financing live
Cash to close
- Down payment
- $41,250
- Closing costs
- $4,950
- Reserves months
- —
- Total cash needed
- —
Loan-product check · same deal, 3 products live
Conventional
25% down · 7.5% · 30yr
- Down + closing
- —
- Monthly P&I
- —
- Monthly cashflow
- —
- DSCR
- —
- Eligible?
- —
Personal DTI + credit; lowest rate.
DSCR
20% down · 8.5% · 30yr
- Down + closing
- —
- Monthly P&I
- —
- Monthly cashflow
- —
- DSCR
- —
- Eligible?
- —
No personal income docs; deal must DSCR.
Hard money
10% down · 12.0% · 12mo
- Down + closing
- —
- Monthly P&I
- —
- Monthly cashflow
- —
- DSCR
- —
- Eligible?
- —
Short-term bridge; refi at stabilization.
Rent comps 40 comps
| Address | Beds | Baths | Sqft | Rent | $/sqft | DOM | Units | Dist |
|---|---|---|---|---|---|---|---|---|
| 9515 Grovedale Cir #101 Riverview, FL | 3.0 | 2.0 | 1151 | $1,800 | $1.56 | 26d | 1 | 0.07mi |
| 9520 Amberdale Ct #101 Riverview, FL | 3.0 | 2.0 | 1151 | $2,150 | $1.87 | 7d | 1 | 0.08mi |
| 6425 Cypressdale Dr #101 Riverview, FL | 3.0 | 2.0 | 1151 | $1,950 | $1.69 | 26d | 1 | 0.19mi |
| 9538 Newdale Way #101 Riverview, FL | 3.0 | 2.0 | 1151 | $1,895 | $1.65 | 26d | 1 | 0.31mi |
| 9519 Newdale Way #201 Riverview, FL | 3.0 | 2.0 | 1151 | $1,650 | $1.43 | 26d | 1 | 0.32mi |
| 9520 Newdale Way Riverview, FL | 3.0 | 2.0 | 1151 | $1,700 | $1.48 | 3d | 1 | 0.34mi |
| 9122 Moonlit Meadows Loop Unit 1 Riverview, FL | 2.0 | 2.0 | 1018 | $1,800 | $1.77 | 0d | 1 | 0.44mi |
| 9120 Moonlit Meadows Loop Riverview, FL | 2.0 | 2.5 | 1260 | $1,850 | $1.47 | 26d | 1 | 0.44mi |
| 9621 Lakedale Way #202 Riverview, FL | 3.0 | 2.0 | 1151 | $1,900 | $1.65 | 26d | 1 | 0.45mi |
| 9092 Moonlit Meadows Loop Riverview, FL | 2.0 | 2.0 | 1018 | $1,850 | $1.82 | 15d | 1 | 0.45mi |
| 6022 Portsdale Pl #102 Riverview, FL | 3.0 | 2.0 | 1151 | $1,679 | $1.46 | 26d | 1 | 0.47mi |
| 6007 Skydale Way #202 Riverview, FL | 3.0 | 2.0 | 1151 | $1,595 | $1.39 | 26d | 1 | 0.48mi |
| 6014 Portsdale Pl #102 Riverview, FL | 3.0 | 2.0 | 1151 | $1,800 | $1.56 | 26d | 1 | 0.50mi |
| 6004 Portsdale Pl #101 Riverview, FL | 3.0 | 2.0 | 1151 | $1,700 | $1.48 | 26d | 1 | 0.53mi |
| 6768 Breezy Palm Dr Riverview, FL | 2.0 | 2.0 | 1298 | $1,800 | $1.39 | 22d | 1 | 0.60mi |
| 9707 Tranquility Lake Cir Riverview, FL | 1.0–3.0 | 1.0–2.0 | 940 | $2,138 | $2.27 | 0d | 37 | 0.62mi |
| 5611 Legacy Crescent Pl #304 Riverview, FL | 2.0 | 2.0 | 1068 | $1,500 | $1.40 | 16d | 1 | 0.67mi |
| 5501 Legacy Crescent Pl Riverview, FL | 1.0–2.0 | 1.0–2.0 | 1006 | $1,797 | $1.79 | 1d | 9 | 0.72mi |
| 9104 Canopy Oak Ln Riverview, FL | 1.0–3.0 | 1.0–2.0 | 1029 | $2,086 | $2.03 | 0d | 18 | 0.73mi |
| 5703 Legacy Crescent Pl #304 Riverview, FL | 2.0 | 1.0 | 927 | $1,500 | $1.62 | 24d | 1 | 0.73mi |
| 5817 Legacy Crescent Pl #302 Riverview, FL | 2.0 | 1.0 | 927 | $1,575 | $1.70 | 26d | 1 | 0.75mi |
| 9303 Cobalt Dr Riverview, FL | 1.0–3.0 | 1.0–2.0 | 1085 | $2,510 | $2.31 | 1d | 47 | 0.78mi |
| 6215 Cannoli Pl Riverview, FL | 3.0 | 2.0 | 1208 | $2,090 | $1.73 | 4d | 1 | 0.79mi |
| 6101 Innovation Way Tampa, FL | 1.0–3.0 | 1.0–2.0 | 1089 | $2,250 | $2.07 | 6d | 12 | 0.79mi |
| 9246 Headwaters Ave Riverview, FL | 1.0–3.0 | 1.0–3.0 | 1014 | $2,727 | $2.69 | 0d | 28 | 0.80mi |
| 5905 Trace Meadow Loop Riverview, FL | 1.0–3.0 | 1.0–2.0 | 1030 | $2,590 | $2.51 | 0d | 13 | 0.85mi |
| 6925 Towering Spruce Dr Riverview, FL | 2.0 | 2.5 | 1176 | $1,795 | $1.53 | 16d | 1 | 0.90mi |
| 6925 Towering Spruce Dr Unit 1 Riverview, FL | 2.0 | 2.5 | 1176 | $1,895 | $1.61 | 26d | 1 | 0.90mi |
| 5959 Bandera Springs Cir Riverview, FL | 3.0 | 1.0–2.0 | 1007 | $2,291 | $2.27 | 0d | 22 | 0.96mi |
| 6705 Holly Heath Dr Riverview, FL | 3.0 | 2.5 | 1420 | $2,150 | $1.51 | 16d | 1 | 0.98mi |
| 6959 Towne Lake Rd Riverview, FL | 3.0 | 2.5 | 1400 | $2,050 | $1.46 | 0d | 1 | 1.03mi |
| 10103 Sherwood Ln Riverview, FL | 2.0 | 1.0–2.0 | 650 | $1,614 | $2.48 | 1d | 26 | 1.04mi |
| 7007 Towne Lake Rd Riverview, FL | 3.0 | 2.5 | 1400 | $3,800 | $2.71 | 26d | 1 | 1.06mi |
| 6824 Holly Heath Dr Riverview, FL | 3.0 | 2.5 | 1400 | $2,095 | $1.50 | 1d | 1 | 1.10mi |
| 8220 Midnight Sun Ct Riverview, FL | 3.0 | 2.0 | 1275 | $1,900 | $1.49 | 26d | 1 | 1.10mi |
| 4836 Chatterton Way Riverview, FL | 2.0 | 2.5 | 1280 | $1,850 | $1.45 | 26d | 1 | 1.15mi |
| 6229 Osprey Lake Cir Riverview, FL | 3.0 | 3.0 | 1412 | $2,000 | $1.42 | 26d | 1 | 1.16mi |
| 6252 Osprey Lake Cir Riverview, FL | 3.0 | 3.0 | 1412 | $1,699 | $1.20 | 7d | 1 | 1.18mi |
| 6252 Osprey Lake Cir Riverview, FL | 3.0 | 3.0 | 1412 | $1,700 | $1.20 | 1d | 1 | 1.18mi |
| 10305 Zackary Cir Riverview, FL | 2.0–3.0 | 2.0 | 1025 | $1,507 | $1.47 | 26d | 8 | 1.19mi |
HOA detail condo
- Monthly dues
- $439 · $5,268/yr
- Likely covers
- poolgymsecurity
- Assessments
- None detected in remarks — confirm with the listing agent.
Listing history 42 events
-
2026-06-21days on market $165,000 Active 100 DOM
-
2026-06-18days on market $165,000 Active 97 DOM
-
2026-06-17days on market $165,000 Active 96 DOM
-
2026-06-16days on market $165,000 Active 95 DOM
-
2026-06-15days on market $165,000 Active 94 DOM
-
2026-06-13days on market $165,000 Active 92 DOM
-
2026-06-13days on market $165,000 Active 91 DOM
-
2026-06-09days on market $165,000 Active 88 DOM
-
2026-06-08days on market $165,000 Active 87 DOM
-
2026-06-07days on market $165,000 Active 86 DOM
-
2026-06-04days on market $165,000 Active 83 DOM
-
2026-06-03days on market $165,000 Active 82 DOM
-
2026-06-02days on market $165,000 Active 81 DOM
-
2026-06-01days on market $165,000 Active 80 DOM
-
2026-05-31days on market $165,000 Active 79 DOM
-
2026-03-13$165,000 Active 572-char remark
Show marketing remark (572 chars)
Welcome to this stunning condo located on the desirable top floor of a secure, gated community in Riverview. This spacious 3-bedroom, 2 bathroom unit features an open floor plan with no carpet - enjoy beautiful hardwood flooring throughout. Relax on your private balcony or enjoy the resort-style community amenities, including a pool, fitness center, playground, and clubhouse. Perfectly situated near I-75 and US-301, you are minutes away from top-tier shopping, dining, and an easy commute to downtown Tampa and Tampa International Airport. Schedule your showing today!
-
2025-04-23historical $1,700
-
2025-04-03$1,700
-
2025-03-29historical $1,700
-
2025-03-27price $1,700
-
2025-03-05price $1,800
-
2025-02-21$1,700
-
2021-08-13soldstatus $148,000
-
2021-08-12soldstatus $148,000 Closed 263-char remark
Show marketing remark (263 chars)
Welcome to this beautiful and well maintained 3 bedroom 2 bathroom Condo in a gated community! Newer kitchen cabinets and countertops. Easy access to highway, shopping center and restaurant. Move in ready or income producing property! Schedule your showing today!
-
2021-07-27status Pending 263-char remark
Show marketing remark (263 chars)
Welcome to this beautiful and well maintained 3 bedroom 2 bathroom Condo in a gated community! Newer kitchen cabinets and countertops. Easy access to highway, shopping center and restaurant. Move in ready or income producing property! Schedule your showing today!
-
2021-07-21$145,000 Active 263-char remark
Show marketing remark (263 chars)
Welcome to this beautiful and well maintained 3 bedroom 2 bathroom Condo in a gated community! Newer kitchen cabinets and countertops. Easy access to highway, shopping center and restaurant. Move in ready or income producing property! Schedule your showing today!
-
2020-06-07status Pending
-
2020-06-05historical
-
2020-05-12status Active
-
2020-05-07status Pending
-
2020-04-09$101,000 Active
-
2019-05-31soldstatus $86,500
-
2019-05-17soldstatus $86,500 Sold
-
2019-05-02status Pending
-
2019-04-30price $89,995
-
2019-04-18$90,695 Active
-
2011-02-16soldstatus $33,000
-
2010-12-16$23,500
-
2010-08-30historical
-
2010-05-03$25,000
-
2010-04-19historical
-
2008-07-28$50,000
ⓘ Source: listings_history table (triggers on properties + properties_extension) + one-shot
backfill from property_details.listing_events for pre-trigger history.
Tax reassessment forecast FL · Resets to sale price
- Current annual tax
- $4,046 · $337/mo
- Projected year-2 tax
- $4,046 · $337/mo
- Expected delta
- $0/yr ($0/mo · -0.0%)
ⓘ Screening estimate from a state-policy table — verify with the county assessor before closing.
Climate risk First Street
- Flood 1/10 Low FEMA zone X (unshaded) · 0% chance over 30 yrs
- Wildfire 2/10 Low
- Heat 10/10 Extreme 7 d/yr ≥109°F today · 27 d/yr by 30 yrs out
- Wind 9/10 Extreme 99% chance of damaging wind over 30 yrs
- Air quality 4/10 Moderate 4 unhealthy d/yr today · 5 by 30 yrs out
Nearby sold comps map
Loading sold comps map…
Walkable amenities ~0.75 mi
Loading nearby amenities…
Taxation est. · year 1
- Rental income
- $24,447
- − Mortgage interest
- −$9,243
- − Property taxes
- −$4,046
- − Insurance
- −$825
- − Repairs & maintenance
- −$1,956
- − Management
- −$1,956
- − HOA
- −$5,268
- − Depreciation
- −$4,800
- Taxable loss
- −$3,647
- Est. tax savings @ 24.0%
- +$875
- After-tax cash flow
- $-335/yr
For passive investors: Depreciation is non-cash, so a rental often shows a tax loss while cash-flowing — sheltering income. Rental losses are passive: they offset passive income freely, and up to $25,000/yr can offset ordinary (W-2) income if you actively participate and your MAGI is under $100k (phasing out to $0 by $150k); unused losses carry forward. On sale, claimed depreciation is recaptured at up to 25%, and gains may owe capital-gains tax (a 1031 exchange can defer both). Figures are a year-1 estimate at your 24.0% rate — not tax advice; consult a CPA.
Schools (NCES district)
- District
- Hillsborough
- NCES district ID
- 1200870
- Math proficiency
- 47% ▼ -8.00%
- Reading proficiency
- 50% ▼ -4.00%
- Median HH income
- $50,622
- Composite
- 41.6/100
- National rank
- #3435
- State rank
- #41 of 73 in FL
Livability — Riverview
- Score
- 79/100
- State rank
- #134
- US rank
- #2000
Category grades
Schools grade is shown separately in the Schools card above.
Census & demographics
- Census place
- Riverview, FL
- County
- Hillsborough County · 1,540,968 people
- City population
- 137,988
- Metro
- Tampa-St. Petersburg-Clearwater, FL
- Population (ZIP)
- 60,651
- Household income
- $85,921
- Rent vs Own
- Severe rent burden
- 3063.0
Population outlook (Hillsborough County) Hauer SSP2
- Today (2025)
- 1,607,022 people
- By 2030
- 1,733,968 · +7.9%
- By 2040
- 1,979,565 · +23.2%
- By 2050
- 2,203,427 · +37.1%
- By 2075
- 2,667,893 · +66.0%
- By 2100
- 2,891,558 · +79.9%
Race, ethnicity, and origin ACS 2023
- Neighborhood character
- Diverse neighborhood (Simpson 0.69)
- Race & ethnicity
- White 43% Hispanic / Latino 26% Black 23% Two or more races 17% Asian 3%
- Hispanic origin (detail)
- Mexican 4% Puerto Rican 8% Cuban 3% Dominican 4%
- Common ancestry
- Romanian 3% Hispanic 3% Lithuanian 2%
- Foreign-born
- 14% · Canada, Jamaica, China
- Languages at home
- 73% English-only · Spanish 19% French/Haitian/Cajun 3% Other Indo-European 2%
Political lean MEDSL · Hillsborough
- 2024 margin
- Toss-up / Even · D 47.8% · R 50.9% · Other 1.3%
- 2008→2024 swing
- -10.2pp toward R · 2008: 7.1pp · 2024: -3.1pp
- All cycles
- 2024: R+3.1 2020: D+6.9 2016: D+6.8 2012: D+6.7 2008: D+7.1
Not yet ingested
- Civics
- —
Market trends
- HPI YoY
- ▼ -48.42%
- Current HPI
- 326.0368
- Rent YoY
- ▼ -0.95%
- Metro
- Tampa-St. Petersburg-Clearwater, FL
- State GDP YoY
- ▲ 3.28%
- F500 in state
- 36
Industry mix (Fortune 500 HQ in FL)
| Industry | F500 HQs | Revenue |
|---|---|---|
| Industrial Technology | 2 | $29B |
|
||
| Insurance | 2 | $17B |
|
||
| Retail | 1 | $60B |
|
||
| Technology Distribution | 1 | $58B |
|
||
| Homebuilding | 1 | $35B |
|
||
| Technology Manufacturing | 1 | $35B |
|
||
Price history
+230.0% since first listed27 events — show timeline
- 2026-03-13 Listed $165,000 Stellar MLS as Distributed by MLS Grid
- 2025-04-23 Rental Removed $1,700 STELLARMLS
- 2025-04-03 Listed for Rent $1,700 STELLARMLS
- 2025-03-29 Rental Removed $1,700 STELLARMLS
- 2025-03-27 Price Changed $1,700 STELLARMLS
- 2025-03-05 Price Changed $1,800 STELLARMLS
- 2025-02-21 Listed for Rent $1,700 STELLARMLS
- 2021-08-13 Sold (Public Records) $148,000 Public Records
- 2021-08-12 Sold (MLS) $148,000 Stellar MLS as Distributed by MLS Grid
- 2021-07-27 Pending — Stellar MLS as Distributed by MLS Grid
- 2021-07-21 Listed $145,000 Stellar MLS as Distributed by MLS Grid
- 2020-06-07 Pending — Stellar MLS as Distributed by MLS Grid
- 2020-06-05 Listing Removed — Stellar MLS as Distributed by MLS Grid
- 2020-05-12 Relisted — Stellar MLS as Distributed by MLS Grid
- 2020-05-07 Pending — Stellar MLS as Distributed by MLS Grid
- 2020-04-09 Listed $101,000 Stellar MLS as Distributed by MLS Grid
- 2019-05-31 Sold (Public Records) $86,500 Public Records
- 2019-05-17 Sold (MLS) $86,500 Stellar MLS as Distributed by MLS Grid
- 2019-05-02 Pending — Stellar MLS as Distributed by MLS Grid
- 2019-04-30 Price Changed $89,995 Stellar MLS as Distributed by MLS Grid
- 2019-04-18 Listed $90,695 Stellar MLS as Distributed by MLS Grid
- 2011-02-16 Sold (MLS) $33,000 Stellar MLS as Distributed by MLS Grid
- 2010-12-16 Listed $23,500 Stellar MLS as Distributed by MLS Grid
- 2010-08-30 Listing Removed — Stellar MLS as Distributed by MLS Grid
- 2010-05-03 Listed $25,000 Stellar MLS as Distributed by MLS Grid
- 2010-04-19 Listing Removed — Stellar MLS as Distributed by MLS Grid
- 2008-07-28 Listed $50,000 Stellar MLS as Distributed by MLS Grid
Property tax history
+5.5%/yrLatest (2025): $4,046 · +6.0% YoY. Source: county tax records.
Cash-flow waterfall
monthlySold comps — $/sqft
last 12 mo · ≤1 miLoading sold comps…