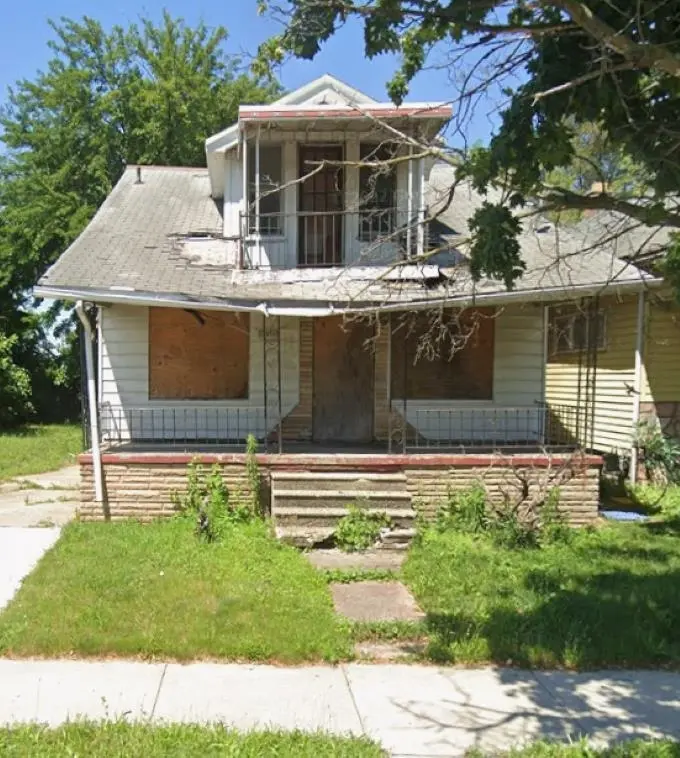
15469 Wildemere St · Detroit, MI
Flood risk 1/10 · Minimal
- FEMA flood zone
- X (unshaded)
- Chance of flooding over 30 yrs
- 0.0%
- Est. flood insurance / yr
- $473 – $860
Fire risk 1/10 · Minimal
- Est. fire insurance / yr
- $784 – $1,456
Heat risk 3/10 · Minor
- Hot days now (above 97°F)
- 7 days/yr
- Hot days in 30 yrs
- 14 days/yr
Wind risk 2/10 · Minimal
- Chance of severe wind over 30 yrs
- —
Air-quality risk 4/10 · Minor
- Unhealthy air days now
- 4 days/yr
- Unhealthy air days in 30 yrs
- 6 days/yr
Risk factors via First Street. Map © Google.
Why this score? — see what drove the D grade
The composite is a weighted blend of 9 inputs, each scored 0–100. Each bar is that input's sub-score; the figure is the points it added to the 100-point composite (weight × sub-score).
- Cash flow +15.0/30.0
- ARV discount +7.5/15.0
- 1% rule +5.0/10.0
- DSCR +5.0/10.0
- Rent growth +4.0/5.0
- Livability +3.7/5.0
- Condition / age +2.5/5.0
- Schools +1.3/10.0
- Appreciation +0.0/10.0
$11,000
🖨 Deal sheet (PDF) 📄 Offer letter ✓ Due diligence
Listing remarks MLS
Sold As Is. Cash Only. Great potential for investors or rehabbers looking to add value. Property is being sold in its current condition with no repairs or warranties provided by the seller. Serious cash buyers only.
Key facts
- 3,049 sq ft lot
- Built 1923
- Listed 38 days
Property features AI
Finance
- Other: Residential property
- HOA & community: Homeowners association present
Exterior
- Utilities: Public water; Public sewer
- Home design: Single family residence; One and one-half stories
- Construction: Asphalt construction materials
- Exterior features: Lot in Ford Plains Subdivision; Lot dimensions approximately 3,049; Lot size about 0.07 acres; Cross street: John C. Lodge Fwy and Dexter Ave
Interior
- Bathrooms: One full bathroom
- Heating & cooling: Forced air heating; Natural gas heating; No cooling system
- Interior features: Has basement; Two rooms total
Neighborhood map
What this means for you Summary
Snapshot
- This is a 2-bed/1.0-bath single-family listed at $11k.
Deal economics
- At list price, monthly cash flow is $907 ($11k/yr) — positive.
- The deal already cash-flows at list — no discount required.
- Meets the 1% rule at list price ($1k rent vs $11k).
- Recommended offer: $11k (3.0% below list) — sets the bar for market timing.
- Cap rate 105.2% vs local median 10.2% in Detroit — top-decile yield for the area; either an underpriced asset or a hidden risk that comps aren't pricing in. Stress-test before assuming the spread holds.
Location & tenants
- Location reads 73/100 on livability (#218 in MI) — a middle-class / working-renter tenant base. Strengths: amenities A+, commute A+, cost of living A+; Watch: schools F, crime F, employment F.
- Detroit Public Schools Community District (urban): math 10% / reading 24% proficiency, ranked #499 of 540 in MI (top 92%) — low school quality limits family demand, transient renter base, plan for 1-2y turnover; 90% free/reduced lunch — lower-income household profile, screen leases tightly.
- Market conditions: Rents rising fast (+6.1%/yr); 346 active listings in the ZIP; 40 comparable units currently listed for rent nearby; rentals at typical pace (median 25d on market — plan ~3-4 weeks tenant-placement turnaround); 40% of comp listings sitting > 30 days — soft ceiling on asking rent; lower-income renter base — watch delinquency; 2,639 units permitted in Wayne County in 2024 (1,216 in 5+ unit buildings).
- This rent runs 45% of the median local income ($33k/yr) — at the standard rent-burdened threshold; future hikes will face affordability resistance.
Forward outlook
- Local home prices are declining (-3.0%/yr); year-one equity from $76 of loan paydown is wiped out by about $330 of value loss. Plan a longer hold.
- Wayne County population projected at -17% by 2050 — secular population decline; favor cash flow + early exit over multi-decade hold.
- At projected returns (-3.0% appreciation + 6.1% rent growth), your $3k cash investment doubles in ~1 year — after that, you're playing with house money.
Negotiation context
- It's been on market 38 days — a 3% lower offer ($11k) is reasonable based on typical stale-listing flexibility.
- 2 sale attempts; this cycle's ask is 22% above the opening price — seller raised mid-cycle; expect resistance to lowballs.
Risks & watch-outs
- Watch-outs: built in 1923 — expect roof / HVAC / electrical / plumbing capex.
Questions for the listing agent
- It's been on market 38 days. Have you received any prior offers? Is the seller open to a 3% concession, seller financing, or rate buy-down credit?
- Built in 1923 — when were the roof, HVAC, electrical panel, plumbing, and water heater last replaced?
- Is there a deadline driving the sale (1031 exchange, divorce, estate, relocation)? That informs how much negotiation room exists.
- Schools are F-rated, which usually means shorter tenancies and higher turnover. Who's the typical renter profile here, and what's been the actual vacancy rate?
- Crime grade is F in this area — have there been break-ins, vandalism, or insurance claims at this property in the last 3 years? What carrier currently insures it and at what premium?
- The area grade is low — what's the realistic commute time and amenity access for the typical tenant pool here? Any planned neighborhood developments (good or bad) we should know about?
- What's the average days-on-market for RENTAL listings here right now (not sales)? A rising rental-DOM trend means longer vacancies and softer asking-rent achievability than the comps imply.
- What's the recent tenant-quality profile in this submarket — average credit score on applications, eviction rate, late-payment / NSF rate, and stable-employment percentage? A property-management company in the area should have these aggregated.
- How much new for-sale + rental construction is in the pipeline within 1–3 miles? Heavy new supply typically softens prices + rents 12–24 months out; constrained supply supports both.
Investment metrics
- 1% rule
- 11.31% ✓
- Cap rate
- 105.25%
- Cash-on-cash
- 353.41%
- DSCR
- 16.72
- GRM
- 0.7
CMA / ARV
- ARV (median comp)
- $52,888
- List price
- $11,000
- Delta
- -79.20%
- Verdict
- UNDERPRICED
- Comps
- 20 within 1.0 mi
Show comp detail 12 sales within ~0.75 mi
| Address | Dist | Beds/Ba | Sqft | Sold | Price | $/sf | Match |
|---|---|---|---|---|---|---|---|
| 15904 Parkside St | 0.26mi | 3/1.5 (+1) | 1,204 (-6%) | 2mo | $140,000 | $116 | 70 |
| 15455 Wildemere St | 0.01mi | 3/1.0 (+1) | 1,095 (-14%) | 2mo | $18,500 | $17 | 69 |
| 15494 Muirland St | 0.03mi | 2/1.0 | 1,090 (-15%) | 9mo | $39,000 | $36 | 67 |
| 15863 Belden St | 0.26mi | 3/1.0 (+1) | 1,156 (-10%) | 1mo | $18,600 | $16 | 66 |
| 15840 Lawton St | 0.26mi | 3/1.0 (+1) | 1,176 (-8%) | 7mo | $38,000 | $32 | 64 |
| 15021 Petoskey Ave | 0.47mi | 3/1.0 (+1) | 1,177 (-8%) | 1mo | $28,000 | $24 | 59 |
| 6433 Globe St | 0.53mi | 3/1.0 (+1) | 1,344 (+5%) | 7mo | $100,000 | $74 | 56 |
| 15877 Baylis St | 0.49mi | 3/1.0 (+1) | 1,400 (+10%) | 5mo | $71,000 | $51 | 52 |
| 16141 Wildemere St | 0.35mi | 3/1.5 (+1) | 1,448 (+13%) | 5mo | $165,000 | $114 | 50 |
| 16180 Wildemere St | 0.39mi | 3/1.5 (+1) | 1,454 (+14%) | 2mo | $115,000 | $79 | 50 |
| 16177 Inverness St | 0.63mi | 3/1.0 (+1) | 1,404 (+10%) | 4mo | $70,000 | $50 | 46 |
| 7447 Ellsworth St | 0.75mi | 3/1.0 (+1) | 1,160 (-9%) | 5mo | $35,500 | $31 | 40 |
Match score weights: distance 35% · size 25% · config 20% · recency 20%. Top-matched comps best support the ARV.
Projected returns pro-forma
-3.0% appreciation · 6.14% rent growth · sell at horizon
- IRR
- —
- Equity multiple
- 20.50×
- Total profit
- $60,064
- Equity at exit
- $1,640
- IRR
- —
- Equity multiple
- 47.92×
- Total profit
- $144,521
- Equity at exit
- $951
Cash invested: $3,080 (down + closing). Projections, not guarantees.
Landlord ↔ Tenant lean methodology
- Overall (STATE)
- 62 Landlord-Friendly
- State Michigan
- 62 Landlord-Friendly · EVEN
- County
- — inherits STATE
- City
- — inherits STATE
ZIP-level market 48238
- Home prices YoY
- -14.4%
- Rents YoY
- 6.1%
- Active inventory
- 346
- Price-to-rent
- 0.7×
Monthly cashflow live
- Estimated rent
- $1,244 high interval (Pro) →
- Mortgage (P&I)
- −$58
- Tax est. 1.5%
- −$14 /mo · $165/yr
- Insurance
- −$5
- HOA
- −$0
- Vacancy / Maint / Mgmt
- −$261
- Net cashflow
- $907
Break-even live
Sensitivity live
| Price | -10% $915 | -5% $911 | +0% $907 | +5% $903 | +10% $899 |
|---|---|---|---|---|---|
| Rent | -10% $809 | -5% $858 | +0% $907 | +5% $956 | +10% $1,005 |
| Rate | -1.0pp $913 | -0.5pp $910 | base $907 | +0.5pp $904 | +1.0pp $901 |
UW: 25.0% down · 7.5% · 30yr · 1.5% tax · 5.0% vac · 8.0% maint · 8.0% mgmt
Financing live
Cash to close
- Down payment
- $2,750
- Closing costs
- $330
- Reserves months
- —
- Total cash needed
- —
Loan-product check · same deal, 3 products live
Conventional
25% down · 7.5% · 30yr
- Down + closing
- —
- Monthly P&I
- —
- Monthly cashflow
- —
- DSCR
- —
- Eligible?
- —
Personal DTI + credit; lowest rate.
DSCR
20% down · 8.5% · 30yr
- Down + closing
- —
- Monthly P&I
- —
- Monthly cashflow
- —
- DSCR
- —
- Eligible?
- —
No personal income docs; deal must DSCR.
Hard money
10% down · 12.0% · 12mo
- Down + closing
- —
- Monthly P&I
- —
- Monthly cashflow
- —
- DSCR
- —
- Eligible?
- —
Short-term bridge; refi at stabilization.
Rent comps 40 comps
| Address | Beds | Baths | Sqft | Rent | $/sqft | DOM | Units | Dist |
|---|---|---|---|---|---|---|---|---|
| 15345 Parkside St Detroit, MI | 3.0 | 1.0 | 1152 | $1,300 | $1.13 | 44d | 1 | 0.18mi |
| 15906 Alden St Detroit, MI | 3.0 | 1.0 | 1030 | $1,150 | $1.12 | 17d | 1 | 0.27mi |
| 16174 Princeton St Unit 2 Detroit, MI | 2.0 | 1.0 | 985 | $1,100 | $1.12 | 44d | 1 | 0.43mi |
| 16174 Princeton St Detroit, MI | 2.0 | 1.0 | 985 | $1,100 | $1.12 | 20d | 1 | 0.43mi |
| 7350 Globe St Detroit, MI | 3.0 | 1.0 | 1000 | $1,550 | $1.55 | 4d | 1 | 0.60mi |
| 16834 Fairfield St Detroit, MI | 2.0 | 1.0 | 1516 | $1,363 | $0.90 | 25d | 1 | 0.66mi |
| 16582 Santa Rosa Dr Detroit, MI | 3.0 | 1.0 | 1314 | $1,399 | $1.06 | 18d | 1 | 0.72mi |
| 2034 Ewald Cir Detroit, MI | 2.0 | 1.0 | 1000 | $995 | $0.99 | 5d | 1 | 0.77mi |
| 2286 Kendall St Detroit, MI | 1.0 | 1.0 | 1689 | $500 | $0.30 | 44d | 1 | 0.79mi |
| 15771 Turner St Detroit, MI | 2.0 | 1.0 | 1000 | $1,049 | $1.05 | 44d | 1 | 0.81mi |
| 2521 W McNichols Rd Unit B2 Detroit, MI | 2.0 | 1.0 | 1300 | $1,250 | $0.96 | 44d | 1 | 0.84mi |
| 16255 Lilac St Detroit, MI | 3.0 | 1.0 | 1312 | $1,394 | $1.06 | 18d | 1 | 0.84mi |
| 16927 Inverness St Detroit, MI | 2.0 | 1.0 | 897 | $1,650 | $1.84 | 17d | 1 | 0.90mi |
| 17215 Warrington Dr Detroit, MI | 2.0 | 1.0 | 1015 | $2,000 | $1.97 | 44d | 1 | 0.96mi |
| 17150 Santa Rosa Dr Detroit, MI | 1.0 | 1.0 | 950 | $1,250 | $1.32 | 18d | 1 | 0.96mi |
| 3209 W Grand St Detroit, MI | 3.0 | 1.0 | 1550 | $1,103 | $0.71 | 44d | 1 | 0.97mi |
| 17145 Santa Rosa Dr Unit 1 Detroit, MI | 3.0 | 1.0 | 1050 | $1,400 | $1.33 | 18d | 1 | 0.97mi |
| 16722 Tuller St Detroit, MI | 3.0 | 1.5 | 1100 | $1,500 | $1.36 | 17d | 1 | 1.00mi |
| 17147 Monica St Unit 2 1 Detroit, MI | 2.0 | 1.0 | 900 | $975 | $1.08 | 25d | 1 | 1.01mi |
| 15457 Cloverlawn St Detroit, MI | 3.0 | 2.0 | 1500 | $1,275 | $0.85 | 25d | 1 | 1.01mi |
| 326 Eason St Highland Park, MI | 3.0 | 1.0 | 1256 | $1,300 | $1.04 | 18d | 1 | 1.01mi |
| 3812 W Grand St Detroit, MI | 2.0 | 1.0 | 1100 | $1,025 | $0.93 | 17d | 1 | 1.05mi |
| 17163 Prairie St Unit 1B Detroit, MI | 3.0 | 1.5 | 1317 | $1,350 | $1.03 | 44d | 1 | 1.05mi |
| 14656 Roselawn St Detroit, MI | 3.0 | 1.0 | 1000 | $1,200 | $1.20 | 18d | 1 | 1.09mi |
| 15791 Cherrylawn St Detroit, MI | 2.0 | 1.0 | 1792 | $1,100 | $0.61 | 44d | 1 | 1.12mi |
| 1926 Clements St Unit 1926 Detroit, MI | 3.0 | 1.0 | 1150 | $1,250 | $1.09 | 20d | 1 | 1.13mi |
| 1926 Clements St Detroit, MI | 3.0 | 1.0 | 1150 | $1,150 | $1.00 | 5d | 1 | 1.13mi |
| 17551 Santa Rosa Dr Detroit, MI | 2.0 | 1.0 | 1036 | $1,095 | $1.06 | 44d | 1 | 1.20mi |
| 4287 W Grand St Unit 4289 Detroit, MI | 3.0 | 1.0 | 1250 | $1,000 | $0.80 | 44d | 1 | 1.21mi |
| 15777 Wisconsin St Unit 77 Detroit, MI | 2.0 | 1.0 | 900 | $950 | $1.06 | 5d | 1 | 1.22mi |
| 17596 Santa Rosa Dr Detroit, MI | 2.0 | 1.0 | 1350 | $1,195 | $0.89 | 44d | 1 | 1.23mi |
| 17596 Santa Rosa Dr Unit 2 Detroit, MI | 2.0 | 1.0 | 1350 | $1,195 | $0.89 | 25d | 1 | 1.23mi |
| 3740 Tyler St Unit 1 Detroit, MI | 3.0 | 1.0 | 1300 | $1,300 | $1.00 | 5d | 1 | 1.23mi |
| 14550 Northlawn St Detroit, MI | 3.0 | 2.0 | 950 | $1,200 | $1.26 | 17d | 1 | 1.23mi |
| 3824 Tyler St Apt 1 Detroit, MI | 3.0 | 1.0 | 900 | $1,523 | $1.69 | 17d | 1 | 1.26mi |
| 3783 Tyler St Unit Lower Detroit, MI | 3.0 | 1.0 | 1000 | $1,150 | $1.15 | 44d | 1 | 1.27mi |
| 16183 Wisconsin St Detroit, MI | 3.0 | 1.5 | 1370 | $1,400 | $1.02 | 44d | 1 | 1.28mi |
| 17368 Woodingham Dr Detroit, MI | 3.0 | 1.5 | 1200 | $1,800 | $1.50 | 44d | 1 | 1.29mi |
| 16546 Wisconsin St Detroit, MI | 3.0 | 1.0 | 1577 | $1,500 | $0.95 | 44d | 1 | 1.30mi |
| 16230 Indiana St Unit 2 Detroit, MI | 2.0 | 1.0 | 1050 | $1,200 | $1.14 | 18d | 1 | 1.32mi |
Listing history 16 events
-
2026-06-18days on market $11,000 Active 38 DOM
-
2026-06-17days on market $11,000 Active 37 DOM
-
2026-06-15days on market $11,000 Active 35 DOM
-
2026-06-13days on market $11,000 Active 33 DOM
-
2026-06-13pricedays on market $11,000 Active 32 DOM
-
2026-06-09days on market $9,000 Active 29 DOM
-
2026-06-08days on market $9,000 Active 28 DOM
-
2026-06-07days on market $9,000 Active 27 DOM
-
2026-06-04days on market $9,000 Active 24 DOM
-
2026-06-03days on market $9,000 Active 23 DOM
-
2026-06-02days on market $9,000 Active 22 DOM
-
2026-06-01days on market $9,000 Active 21 DOM
-
2026-05-31days on market $9,000 Active 20 DOM
-
2026-05-11$9,000 Active 215-char remark
Show marketing remark (215 chars)
Sold As Is. Cash Only. Great potential for investors or rehabbers looking to add value. Property is being sold in its current condition with no repairs or warranties provided by the seller. Serious cash buyers only.
-
2026-05-11$9,000 Active 215-char remark
Show marketing remark (215 chars)
Sold As Is. Cash Only. Great potential for investors or rehabbers looking to add value. Property is being sold in its current condition with no repairs or warranties provided by the seller. Serious cash buyers only.
-
2003-03-20soldstatus $55,000
ⓘ Source: listings_history table (triggers on properties + properties_extension) + one-shot
backfill from property_details.listing_events for pre-trigger history.
Climate risk First Street
- Flood 1/10 Low FEMA zone X (unshaded) · 0% chance over 30 yrs
- Wildfire 1/10 Low
- Heat 3/10 Moderate 7 d/yr ≥97°F today · 14 d/yr by 30 yrs out
- Wind 2/10 Low
- Air quality 4/10 Moderate 4 unhealthy d/yr today · 6 by 30 yrs out
Nearby sold comps map
Loading sold comps map…
Walkable amenities ~0.75 mi
Loading nearby amenities…
Taxation est. · year 1
- Rental income
- $14,933
- − Mortgage interest
- −$616
- − Property taxes
- −$165
- − Insurance
- −$55
- − Repairs & maintenance
- −$1,195
- − Management
- −$1,195
- − Depreciation
- −$320
- Taxable income
- $11,388
- Est. tax owed @ 24.0%
- −$2,733
- After-tax cash flow
- $8,152/yr
For passive investors: Depreciation is non-cash, so a rental often shows a tax loss while cash-flowing — sheltering income. Rental losses are passive: they offset passive income freely, and up to $25,000/yr can offset ordinary (W-2) income if you actively participate and your MAGI is under $100k (phasing out to $0 by $150k); unused losses carry forward. On sale, claimed depreciation is recaptured at up to 25%, and gains may owe capital-gains tax (a 1031 exchange can defer both). Figures are a year-1 estimate at your 24.0% rate — not tax advice; consult a CPA.
Schools (NCES district)
- District
- Detroit Public Schools Community District
- NCES district ID
- 2601103
- Math proficiency
- 10% ▼ -2.00%
- Reading proficiency
- 24% ▲ 6.00%
- Median HH income
- $25,815
- Composite
- 13.06/100
- National rank
- #9564
- State rank
- #499 of 540 in MI
Livability — Detroit
- Score
- 73/100
- State rank
- #218
- US rank
- #5427
Category grades
Schools grade is shown separately in the Schools card above.
Census & demographics
- Census place
- Detroit, MI
- County
- Wayne County · 1,562,939 people
- City population
- 572,865
- Metro
- Detroit-Warren-Dearborn, MI
- Population (ZIP)
- 24,731
- Household income
- $33,315
- Rent vs Own
- Severe rent burden
- 2172.0
Population outlook (Wayne County) Hauer SSP2
- Today (2025)
- 1,675,273 people
- By 2030
- 1,620,300 · -3.3%
- By 2040
- 1,502,341 · -10.3%
- By 2050
- 1,384,039 · -17.4%
- By 2075
- 1,124,592 · -32.9%
- By 2100
- 881,193 · -47.4%
Race, ethnicity, and origin ACS 2023
- Neighborhood character
- Predominantly Black (94%)
- Race & ethnicity
- Black 94% Two or more races 3% White 1%
- Foreign-born
- 1%
Political lean MEDSL · Wayne
- 2024 margin
- Strong D (+29.0) · D 62.7% · R 33.7% · Other 3.6%
- 2008→2024 swing
- -20.5pp toward R · 2008: 49.5pp · 2024: 29.0pp
- All cycles
- 2024: D+29.0 2020: D+38.1 2016: D+37.3 2012: D+46.9 2008: D+49.5
Not yet ingested
- Civics
- —
Market trends
- HPI YoY
- ▼ -31.96%
- Current HPI
- 189.6227
- Rent YoY
- ▲ 6.14%
- Metro
- Detroit-Warren-Dearborn, MI
- State GDP YoY
- ▲ 1.37%
- F500 in state
- 28
Industry mix (Fortune 500 HQ in MI)
| Industry | F500 HQs | Revenue |
|---|---|---|
| Automotive Parts | 3 | $48B |
|
||
| Automotive | 2 | $372B |
|
||
| Chemicals | 1 | $45B |
|
||
| Automotive Retail | 1 | $29B |
|
||
| Healthcare / Medical Devices | 1 | $23B |
|
||
| Automotive Technology | 1 | $20B |
|
||
Price history
-80.0% since first listed5 events — show timeline
- 2026-06-11 Price Changed $11,000 MiRealSource-MiMLS
- 2026-06-11 Price Changed $11,000 REALCOMP
- 2026-05-11 Listed $9,000 REALCOMP
- 2026-05-11 Listed $9,000 MiRealSource-MiMLS
- 2003-03-20 Sold (Public Records) $55,000 Public Records
Property tax history
+4.9%/yrLatest (2025): $1,334 · +1.6% YoY. Source: county tax records.
Cash-flow waterfall
monthlySold comps — $/sqft
last 12 mo · ≤1 miLoading sold comps…