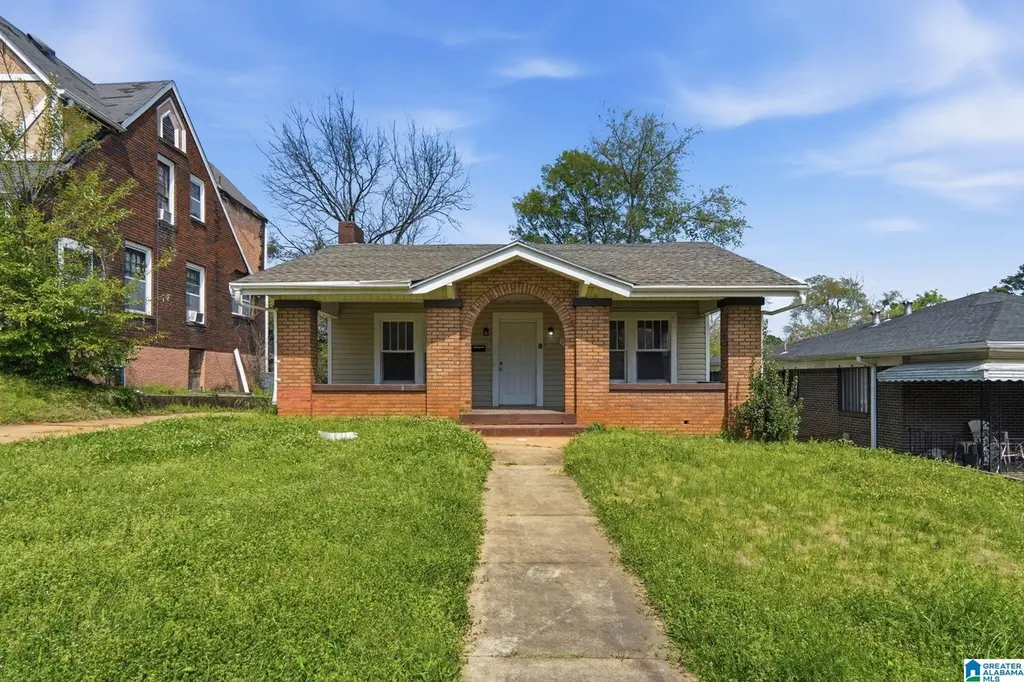
1402 44th St · Birmingham, AL
Flood risk 1/10 · Minimal
- FEMA flood zone
- X (unshaded)
- Chance of flooding over 30 yrs
- 0.0%
- Est. flood insurance / yr
- $473 – $860
Fire risk 1/10 · Minimal
- Est. fire insurance / yr
- $916 – $1,700
Heat risk 6/10 · Moderate
- Hot days now (above 107°F)
- 7 days/yr
- Hot days in 30 yrs
- 19 days/yr
Wind risk 6/10 · Moderate
- Chance of severe wind over 30 yrs
- 27.0%
Air-quality risk 4/10 · Minor
- Unhealthy air days now
- 5 days/yr
- Unhealthy air days in 30 yrs
- 5 days/yr
Risk factors via First Street. Map © Google.
Why this score? — see what drove the B- grade
The composite is a weighted blend of 9 inputs, each scored 0–100. Each bar is that input's sub-score; the figure is the points it added to the 100-point composite (weight × sub-score).
- Cash flow +28.6/30.0
- ARV discount +12.2/15.0
- DSCR +10.0/10.0
- 1% rule +8.1/10.0
- Livability +3.4/5.0
- Rent growth +2.5/5.0
- Condition / age +2.5/5.0
- Schools +0.9/10.0
- Appreciation +0.0/10.0
$89,900
🖨 Deal sheet 📄 Offer letter ✓ Due diligence
Listing remarks
Back on market no fault of the seller. Spacious single-story home featuring 3 bedrooms, 2 bathrooms, and a detached garage with a functional layout and plenty of room to spread out. The main living areas offer comfortable space for both everyday living and entertaining, while the kitchen provides ample cabinet and counter space. The primary bedroom includes an en-suite bathroom, and additional bedrooms offer flexibility for guests, office, or hobbies. Enjoy the yard with space to relax or entertain. Great opportunity with plenty of potential! One or more photo(s) was virtually staged.
Key facts
- 6,969 sq ft lot
- Built 1942
- Listed 20 days
Property features AI
Finance
- Other: Lot size about 0.16 acre; Subdivision: Belview Heights
- Financial info: Has down payment assistance
Exterior
- Parking: Detached parking
- Utilities: Public water; Connected sewer; Underground utilities; Unknown internet service availability
- Home design: 4-side brick construction; Existing year built (specific year not provided); Basement foundation; Not waterfront
- Construction: 4-side brick exterior; Basement foundation (concrete block)
- Exterior features: Fireplace (exterior listing also notes fireplace as a feature); No pool, patio, decks, or garden/patio reported; Underground utilities
Interior
- Kitchen: Laminate countertops; Electric oven; Refrigerator
- Bedrooms: Three bedrooms on main level (approx. 13x19; 11x10; 11x13)
- Flooring: Vinyl flooring throughout
- Bathrooms: Two full bathrooms with tub/shower combo
- Heating & cooling: Forced air heating; Central cooling
- Interior features: Vinyl floors; Ceilings: other (see remarks); Brick fireplace in the living room; Partial basement (all unfinished, concrete block)
- Laundry & utility: Washer hookup; Electric dryer hookup; Laundry located on main level (laundry space: other — see remarks); Electric water heater
Neighborhood map
What this means for you Summary
Snapshot
- This is a 3-bed/2.0-bath single-family listed at $90k.
Deal economics
- At list price, monthly cash flow is $297 ($4k/yr) — positive.
- The deal already cash-flows at list — no discount required.
- Meets the 1% rule at list price ($1k rent vs $90k).
- Recommended offer: $89k (1.5% below list) — sets the bar for market timing.
- Cap rate 10.3% vs local median 6.2% in Birmingham — top-decile yield for the area; either an underpriced asset or a hidden risk that comps aren't pricing in. Stress-test before assuming the spread holds.
Location & tenants
- Location reads 67/100 on livability (#78 in AL) — a middle-class / working-renter tenant base. Strengths: commute A+, cost of living A+, housing A+; Watch: amenities C-, schools F, crime F.
- Birmingham City (urban): math 4% / reading 20% proficiency, ranked #116 of 129 in AL (top 90%) — low school quality limits family demand, transient renter base, plan for 1-2y turnover; 82% free/reduced lunch — lower-income household profile, screen leases tightly.
- Market conditions: 81 active listings in the ZIP; 40 comparable units currently listed for rent nearby; rentals at typical pace (median 24d on market — plan ~3-4 weeks tenant-placement turnaround); 45% of comp listings sitting > 30 days — soft ceiling on asking rent; lower-income renter base — watch delinquency; 2,114 units permitted in Jefferson County in 2024 (556 in 5+ unit buildings).
- This rent runs 39% of the median local income ($37k/yr) — at the standard rent-burdened threshold; future hikes will face affordability resistance.
Forward outlook
- Local home prices are declining (-3.0%/yr); year-one equity from $622 of loan paydown is wiped out by about $3k of value loss. Plan a longer hold.
- Jefferson County population projected to shrink 4% by 2050 — rents likely to lag national; underwrite the cash flow, not the appreciation.
- At projected returns (-3.0% appreciation + 3.0% rent growth), your $25k cash investment doubles in ~9 years — after that, you're playing with house money.
Negotiation context
- It's been on market 20 days — a 2% lower offer ($89k) is reasonable based on typical stale-listing flexibility.
- 4 sale attempts since 3y ago with the ask held roughly flat each time — persistent listings suggest the price (not the market) is what's stuck; bring a comps-based counter.
Risks & watch-outs
- Watch-outs: built in 1942 — expect roof / HVAC / electrical / plumbing capex.
- Climate carrying-cost: major wind risk, 27% chance of damaging wind over 30y; extreme-heat days projected 7→19/yr by 2055 (HVAC capex compounding) — expect insurance premiums to compound above CPI over the hold.
Questions for the listing agent
- Built in 1942 — when were the roof, HVAC, electrical panel, plumbing, and water heater last replaced?
- Is there a deadline driving the sale (1031 exchange, divorce, estate, relocation)? That informs how much negotiation room exists.
- Schools are F-rated, which usually means shorter tenancies and higher turnover. Who's the typical renter profile here, and what's been the actual vacancy rate?
- Crime grade is F in this area — have there been break-ins, vandalism, or insurance claims at this property in the last 3 years? What carrier currently insures it and at what premium?
- What's the average days-on-market for RENTAL listings here right now (not sales)? A rising rental-DOM trend means longer vacancies and softer asking-rent achievability than the comps imply.
- What's the recent tenant-quality profile in this submarket — average credit score on applications, eviction rate, late-payment / NSF rate, and stable-employment percentage? A property-management company in the area should have these aggregated.
- How much new for-sale + rental construction is in the pipeline within 1–3 miles? Heavy new supply typically softens prices + rents 12–24 months out; constrained supply supports both.
Investment metrics
- 1% rule
- 1.31% ✓
- Cap rate
- 10.26%
- Cash-on-cash
- 14.16%
- DSCR
- 1.63
- GRM
- 6.3
CMA / ARV
- ARV (on-the-fly)
- $100,386
- Comps found
- 12
Show comp detail 12 sales within ~0.75 mi
| Address | Dist | Beds/Ba | Sqft | Sold | Price | $/sf | Match |
|---|---|---|---|---|---|---|---|
| 1340 43rd St | 0.09mi | 3/2.0 | 1,540 (+1%) | 7mo | $85,000 | $55 | 88 |
| 1527 46th Street Ensley | 0.23mi | 3/1.0 | 1,571 (+3%) | 6mo | $35,000 | $22 | 75 |
| 1607 43rd St | 0.26mi | 3/2.0 | 1,435 (-6%) | 5mo | $85,000 | $59 | 74 |
| 1611 50th St Ensley | 0.48mi | 3/1.5 | 1,482 (-3%) | 7mo | $98,000 | $66 | 66 |
| 1523 44th St E | 0.16mi | 3/2.0 | 1,307 (-14%) | 5mo | $133,000 | $102 | 65 |
| 1341 41st St | 0.18mi | 3/1.0 | 1,340 (-12%) | 5mo | $106,000 | $79 | 63 |
| 1109 40th St | 0.42mi | 4/1.0 (+1) | 1,556 (+2%) | 5mo | $90,000 | $58 | 63 |
| 920 39th St | 0.63mi | 3/2.0 | 1,636 (+8%) | 1mo | $145,000 | $89 | 57 |
| 1037 W 51st St | 0.57mi | 3/2.0 | 1,392 (-8%) | 3mo | $174,000 | $125 | 56 |
| 4637 Avenue R | 0.47mi | 2/1.0 (-1) | 1,378 (-9%) | 3mo | $28,500 | $21 | 51 |
| 1601 48th St | 0.41mi | 3/1.0 | 1,313 (-14%) | 7mo | $84,900 | $65 | 49 |
| 820 Valley Rd | 0.70mi | 4/1.0 (+1) | 1,435 (-6%) | 5mo | $106,000 | $74 | 44 |
Match score weights: distance 35% · size 25% · config 20% · recency 20%. Top-matched comps best support the ARV.
Projected returns pro-forma
-3.0% appreciation · 3.0% rent growth · sell at horizon
- IRR
- 4.5%
- Equity multiple
- 1.17×
- Total profit
- $4,378
- Equity at exit
- $13,404
- IRR
- 14.0%
- Equity multiple
- 2.12×
- Total profit
- $28,284
- Equity at exit
- $7,773
Cash invested: $25,172 (down + closing). Projections, not guarantees.
Landlord ↔ Tenant lean methodology
- Overall (STATE)
- 90 Strongly Landlord-Friendly
- State Alabama
- 90 Strongly Landlord-Friendly · R+15
- County
- — inherits STATE
- City
- — inherits STATE
ZIP-level market 35212
- Active inventory
- 81
- Price-to-rent
- 6.3×
Monthly cashflow live
- Estimated rent
- $1,182 high interval (Pro) →
- Mortgage (P&I)
- −$471
- Tax from tax record
- −$128 /mo · $1,536/yr
- Insurance
- −$37
- HOA
- −$0
- Vacancy / Maint / Mgmt
- −$248
- Net cashflow
- $297
Break-even live
UW: 25.0% down · 7.5% · 30yr · 1.5% tax · 5.0% vac · 8.0% maint · 8.0% mgmt
Financing live
Cash to close
- Down payment
- $22,475
- Closing costs
- $2,697
- Reserves months
- —
- Total cash needed
- —
Loan-product check · same deal, 3 products live
Conventional
25% down · 7.5% · 30yr
- Down + closing
- —
- Monthly P&I
- —
- Monthly cashflow
- —
- DSCR
- —
- Eligible?
- —
Personal DTI + credit; lowest rate.
DSCR
20% down · 8.5% · 30yr
- Down + closing
- —
- Monthly P&I
- —
- Monthly cashflow
- —
- DSCR
- —
- Eligible?
- —
No personal income docs; deal must DSCR.
Hard money
10% down · 12.0% · 12mo
- Down + closing
- —
- Monthly P&I
- —
- Monthly cashflow
- —
- DSCR
- —
- Eligible?
- —
Short-term bridge; refi at stabilization.
Rent comps 40 comps
| Address | Beds | Baths | Sqft | Rent | $/sqft | DOM | Units | Dist |
|---|---|---|---|---|---|---|---|---|
| 1436 44th Street Ensley Unit ENSLEY Birmingham, AL | 4.0 | 2.0 | 1435 | $1,495 | $1.04 | 1d | 1 | 0.10mi |
| 1509 44th Street Ensley Unit ENSLEY Birmingham, AL | 3.0 | 1.5 | 1260 | $1,123 | $0.89 | 11d | 1 | 0.16mi |
| 1410 46th Street Ensley Unit ENSLEY Birmingham, AL | 3.0 | 1.0 | 1200 | $1,000 | $0.83 | 43d | 1 | 0.16mi |
| 1345 46th Street Ensley Unit ENSLEY Birmingham, AL | 3.0 | 2.0 | 1617 | $1,175 | $0.73 | 3d | 1 | 0.19mi |
| 1515 45th Street Ensley Unit ENSLEY Birmingham, AL | 3.0 | 1.0 | 1440 | $875 | $0.61 | 3d | 1 | 0.20mi |
| 1526 42nd Street Ensley Unit ENSLEY Birmingham, AL | 4.0 | 1.5 | 1600 | $1,050 | $0.66 | 43d | 1 | 0.21mi |
| 1520 41st Street Ensley Birmingham, AL | 3.0 | 2.0 | 1068 | $1,195 | $1.12 | 43d | 1 | 0.25mi |
| 1420 Warrior Rd Birmingham, AL | 3.0 | 1.0 | 1061 | $1,050 | $0.99 | 43d | 1 | 0.25mi |
| 1604 44th Street Ensley Unit ENSLEY Birmingham, AL | 3.0 | 1.0 | 1100 | $1,200 | $1.09 | 23d | 1 | 0.26mi |
| 1112 47th St W Birmingham, AL | 2.0 | 1.0 | 1166 | $975 | $0.84 | 43d | 1 | 0.28mi |
| 1607 43rd Street Ensley Unit ENSLEY Birmingham, AL | 3.0 | 2.0 | 1435 | $1,150 | $0.80 | 23d | 1 | 0.28mi |
| 1617 42nd Street Ensley Unit ENSLEY Birmingham, AL | 3.0 | 1.0 | 1413 | $1,030 | $0.73 | 16d | 1 | 0.30mi |
| 1563 Martin Ave Birmingham, AL | 4.0 | 2.0 | 1848 | $1,495 | $0.81 | 1d | 1 | 0.31mi |
| 1306 35th Street Ensley Birmingham, AL | 3.0 | 2.0 | 1100 | $1,173 | $1.07 | 3d | 1 | 0.33mi |
| 1037 47th Street Ensley Unit ENSLEY Birmingham, AL | 3.0 | 2.0 | 1299 | $1,000 | $0.77 | 43d | 1 | 0.35mi |
| 1417 34th Street Ensley Birmingham, AL | 3.0 | 1.0 | 1103 | $1,025 | $0.93 | 43d | 1 | 0.36mi |
| 4105 Avenue Q Unit Q Birmingham, AL | 3.0 | 3.0 | 1760 | $1,250 | $0.71 | 3d | 1 | 0.42mi |
| 1556 Burgin Ave Birmingham, AL | 4.0 | 1.0 | 1168 | $1,100 | $0.94 | 19d | 1 | 0.43mi |
| 1556 Burgin Ave Birmingham, AL | 3.0 | 1.0 | 1168 | $1,100 | $0.94 | 21d | 1 | 0.43mi |
| 4619 Terrace Q Birmingham, AL | 3.0 | 2.0 | 1198 | $900 | $0.75 | 43d | 1 | 0.44mi |
| 1606 49th Street Ensley Unit ENSLEY Birmingham, AL | 3.0 | 2.0 | 1136 | $1,100 | $0.97 | 43d | 1 | 0.47mi |
| 1520 33rd Street Ensley Birmingham, AL | 4.0 | 2.0 | 1215 | $1,275 | $1.05 | 11d | 1 | 0.49mi |
| 1524 33rd Street Ensley Birmingham, AL | 4.0 | 2.0 | 1222 | $1,095 | $0.90 | 21d | 1 | 0.49mi |
| 1417 Bessemer Rd Birmingham, AL | 3.0 | 1.0 | 1688 | $1,200 | $0.71 | 43d | 1 | 0.50mi |
| 1301 32nd Street Ensley Birmingham, AL | 3.0 | 1.0 | 1200 | $975 | $0.81 | 43d | 1 | 0.51mi |
| 920 47th Street Ensley Birmingham, AL | 3.0 | 1.0 | 1070 | $895 | $0.84 | 3d | 1 | 0.52mi |
| 1632 51st St W Birmingham, AL | 3.0 | 1.0 | 1337 | $1,000 | $0.75 | 2d | 1 | 0.57mi |
| 1632 51st Street Ensley Unit ENSLEY Birmingham, AL | 3.0 | 1.0 | 1337 | $1,100 | $0.82 | 43d | 1 | 0.57mi |
| 1757 48th Street Ensley Unit ENSLEY Birmingham, AL | 4.0 | 2.0 | 1164 | $1,295 | $1.11 | 3d | 1 | 0.61mi |
| 813 46th St Fairfield, AL | 2.0 | 1.0 | 1100 | $825 | $0.75 | 10d | 1 | 0.62mi |
| 1309 41st St Fairfield, AL | 3.0 | 1.0 | 1070 | $1,200 | $1.12 | 43d | 1 | 0.64mi |
| 1313 Pike Rd Birmingham, AL | 3.0 | 1.0 | 1437 | $975 | $0.68 | 43d | 1 | 0.67mi |
| 4612 Terrace S Birmingham, AL | 3.0 | 1.0 | 1612 | $1,050 | $0.65 | 43d | 1 | 0.68mi |
| 4637 Court S Birmingham, AL | 3.0 | 1.0 | 1225 | $975 | $0.80 | 2d | 1 | 0.68mi |
| 4817 Court R Birmingham, AL | 3.0 | 2.0 | 1530 | $1,300 | $0.85 | 16d | 1 | 0.71mi |
| 1820 33rd St W Birmingham, AL | 4.0 | 1.5 | 1212 | $1,495 | $1.23 | 43d | 1 | 0.72mi |
| 5219 Court Q Birmingham, AL | 3.0 | 2.0 | 1082 | $1,200 | $1.11 | 19d | 1 | 0.73mi |
| 829 51st Street Ensley Birmingham, AL | 3.0 | 1.0 | 1203 | $1,340 | $1.11 | 3d | 1 | 0.74mi |
| 4732 Court S Birmingham, AL | 3.0 | 1.0 | 1372 | $1,100 | $0.80 | 43d | 1 | 0.74mi |
| 1545 29th Street Ensley Birmingham, AL | 3.0 | 1.5 | 1331 | $1,200 | $0.90 | 43d | 1 | 0.75mi |
Listing history 10 events
-
2026-05-19status Active
-
2026-04-06status Pending
-
2026-03-25$89,900 Active
-
2023-10-04historical $960
-
2023-09-30$960
-
2023-09-29historical $960
-
2023-09-28$960
-
2022-03-31price $875
-
2021-05-18soldstatus $7,237,964
-
1973-07-24soldstatus $18,500
ⓘ Source: listings_history table (triggers on properties + properties_extension) + one-shot
backfill from property_details.listing_events for pre-trigger history.
Tax reassessment forecast AL · Resets to sale price
- Current annual tax
- $1,536 · $128/mo
- Projected year-2 tax
- $1,536 · $128/mo
- Expected delta
- $0/yr ($0/mo · 0.0%)
ⓘ Screening estimate from a state-policy table — verify with the county assessor before closing.
Climate risk First Street
- Flood 1/10 Low FEMA zone X (unshaded) · 0% chance over 30 yrs
- Wildfire 1/10 Low
- Heat 6/10 Major 7 d/yr ≥107°F today · 19 d/yr by 30 yrs out
- Wind 6/10 Major 27% chance of damaging wind over 30 yrs
- Air quality 4/10 Moderate 5 unhealthy d/yr today · 5 by 30 yrs out
Nearby sold comps map
Loading sold comps map…
Walkable amenities ~0.75 mi
Loading nearby amenities…
Taxation est. · year 1
- Rental income
- $14,186
- − Mortgage interest
- −$5,036
- − Property taxes
- −$1,536
- − Insurance
- −$450
- − Repairs & maintenance
- −$1,135
- − Management
- −$1,135
- − Depreciation
- −$2,615
- Taxable income
- $2,280
- Est. tax owed @ 24.0%
- −$547
- After-tax cash flow
- $3,017/yr
For passive investors: Depreciation is non-cash, so a rental often shows a tax loss while cash-flowing — sheltering income. Rental losses are passive: they offset passive income freely, and up to $25,000/yr can offset ordinary (W-2) income if you actively participate and your MAGI is under $100k (phasing out to $0 by $150k); unused losses carry forward. On sale, claimed depreciation is recaptured at up to 25%, and gains may owe capital-gains tax (a 1031 exchange can defer both). Figures are a year-1 estimate at your 24.0% rate — not tax advice; consult a CPA.
Schools (NCES district)
- District
- Birmingham City
- NCES district ID
- 0100390
- Math proficiency
- 4% ▼ -17.00%
- Reading proficiency
- 20% ▼ -4.00%
- Median HH income
- $31,988
- Composite
- 9.49/100
- National rank
- #9850
- State rank
- #116 of 129 in AL
Livability — Birmingham
- Score
- 67/100
- State rank
- #78
- US rank
- #10412
Category grades
Schools grade is shown separately in the Schools card above.
Census & demographics
- Census place
- Birmingham, AL
- County
- Jefferson County · 527,445 people
- City population
- 210,422
- Metro
- Birmingham-Hoover, AL
- Population (ZIP)
- 10,160
- Household income
- $36,633
- Rent vs Own
- Severe rent burden
- 798.0
Population outlook (Jefferson County) Hauer SSP2
- Today (2025)
- 669,185 people
- By 2030
- 669,694 · +0.1%
- By 2040
- 661,388 · -1.2%
- By 2050
- 643,086 · -3.9%
- By 2075
- 577,267 · -13.7%
- By 2100
- 474,758 · -29.1%
Race, ethnicity, and origin ACS 2023
- Neighborhood character
- Predominantly Black (68%)
- Race & ethnicity
- Black 68% White 24% Hispanic / Latino 6% Two or more races 3% Asian 1%
- Hispanic origin (detail)
- Mexican 3%
- Common ancestry
- Italian 2% Slovak 2% Hispanic 1%
- Foreign-born
- 3% · Canada
- Languages at home
- 95% English-only · Spanish 3% French/Haitian/Cajun 1%
Political lean MEDSL · Jefferson
- 2024 margin
- D (+10.4) · D 54.6% · R 44.2% · Other 1.2%
- 2008→2024 swing
- +5.4pp toward D · 2008: 5.1pp · 2024: 10.4pp
- All cycles
- 2024: D+10.4 2020: D+13.2 2016: D+7.2 2012: D+6.0 2008: D+5.1
Not yet ingested
- Civics
- —
Market trends
- HPI YoY
- ▼ -190.24%
- Current HPI
- 120.1264
- Rent YoY
- —
- Metro
- Birmingham-Hoover, AL
- State GDP YoY
- ▲ 2.94%
- F500 in state
- 4
Industry mix (Fortune 500 HQ in AL)
| Industry | F500 HQs | Revenue |
|---|---|---|
| Financial Services | 1 | $8B |
|
||
| Healthcare | 1 | $5B |
|
||
Price history
+385.9% since first listed10 events — show timeline
- 2026-05-19 Relisted — Greater Alabama MLS
- 2026-04-06 Pending — Greater Alabama MLS
- 2026-03-25 Listed $89,900 Greater Alabama MLS
- 2023-10-04 Rental Removed $960 APPFOLIO
- 2023-09-30 Listed for Rent $960 APPFOLIO
- 2023-09-29 Rental Removed $960 RENT.
- 2023-09-28 Listed for Rent $960 RENT.
- 2022-03-31 Price Changed $875 RENT.
- 2021-05-18 Sold (Public Records) $7,237,964 Public Records
- 1973-07-24 Sold (Public Records) $18,500 Public Records
Property tax history
+2.2%/yrLatest (2025): $1,536 · -0.1% YoY. Source: county tax records.
Cash-flow waterfall
monthlySold comps — $/sqft
last 12 mo · ≤1 miLoading sold comps…