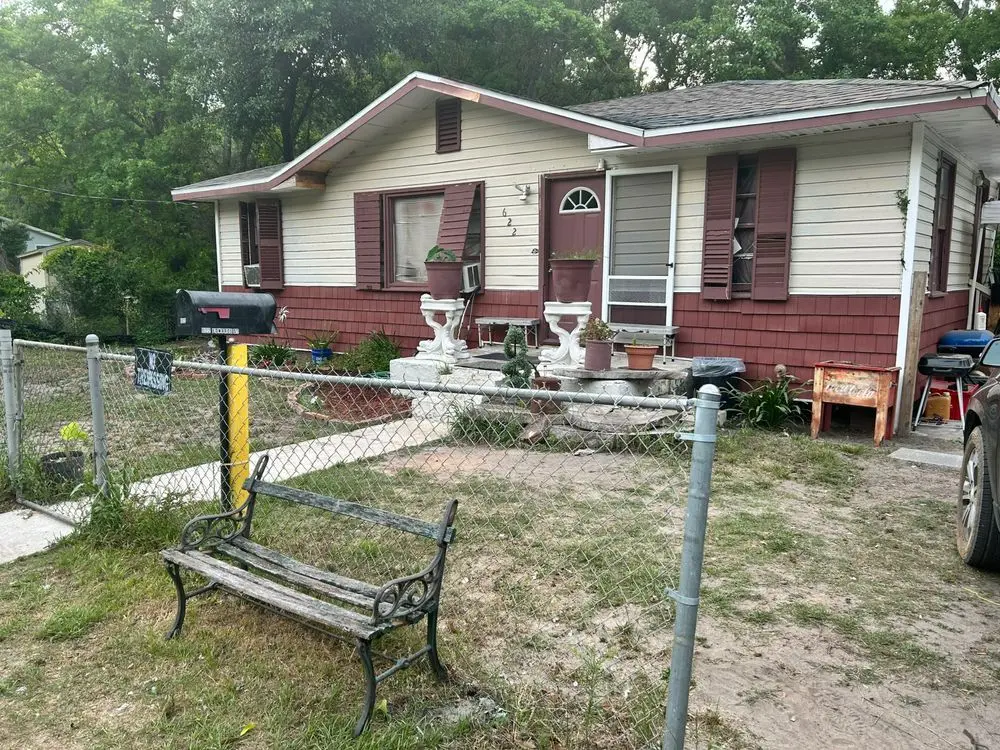
622 Edwards St · Warrington, FL
Flood risk 1/10 · Minimal
- FEMA flood zone
- X (unshaded)
- Chance of flooding over 30 yrs
- 0.0%
- Est. flood insurance / yr
- $507 – $1,088
Fire risk 3/10 · Minor
- Est. fire insurance / yr
- $947 – $1,759
Heat risk 10/10 · Severe
- Hot days now (above 105°F)
- 7 days/yr
- Hot days in 30 yrs
- 22 days/yr
Wind risk 9/10 · Severe
- Chance of severe wind over 30 yrs
- 99.0%
Air-quality risk 1/10 · Minimal
- Unhealthy air days now
- 0 days/yr
- Unhealthy air days in 30 yrs
- 0 days/yr
Risk factors via First Street. Map © Google.
Why this score? — see what drove the C grade
The composite is a weighted blend of 9 inputs, each scored 0–100. Each bar is that input's sub-score; the figure is the points it added to the 100-point composite (weight × sub-score).
- Cash flow +20.8/30.0
- ARV discount +15.0/15.0
- DSCR +6.6/10.0
- 1% rule +4.5/10.0
- Schools +3.6/10.0
- Livability +3.2/5.0
- Rent growth +2.8/5.0
- Condition / age +2.5/5.0
- Appreciation +0.0/10.0
$150,000
🖨 Deal sheet 📄 Offer letter ✓ Due diligence
Listing remarks
Calling All Investors!!!! First Time Home Buyers!!!! Any One Downsizing??? This attractive house has tons of potential!! Current owner has completed a lot of house improvements already!!! Just needs some tlc to get this home back to its former glory! Just finished roof update!!! Improved front flower beds. New siding installed, New Exterior Doors. Inside of home needs to be remodeled. Home owner is currently just starting interior renovations and is going room by room and completing as they can: work still needed to be completed: (Some small drywall repair, kitchen, updating bathroom fixtures, floor needs updated, windows & fresh paint). Dining room is almost completely finished.
Key facts
- Roof update
- New siding
- New exterior doors
Tags
Property features AI
Exterior
- Home design: House; Living area approximately 760
- Exterior features: Lot approximately 5,227 sq ft
Neighborhood map
What this means for you Summary
Snapshot
- This is a 3-bed/1.0-bath single-family listed at $150k.
Deal economics
- At list price, monthly cash flow is $206 ($2k/yr) — positive.
- The deal already cash-flows at list — no discount required.
- To meet the 1% rule (rent ≥ 1% of price), the offer needs to be $142k (5.0% below list).
- Recommended offer: $142k (5.0% below list) — sets the bar for 1% rule.
- Cap rate 7.9% vs local median 4.3% in Warrington — top-decile yield for the area; either an underpriced asset or a hidden risk that comps aren't pricing in. Stress-test before assuming the spread holds.
Location & tenants
- Location reads 65/100 on livability (#631 in FL) — a middle-class / working-renter tenant base. Strengths: cost of living A+, housing A+; Watch: schools D, amenities F, commute F.
- Escambia (suburban): math 40% / reading 45% proficiency, ranked #56 of 73 in FL (top 77%) — families likely to look elsewhere, expect single-tenant / working-renter base with shorter leases.
- Market conditions: Rents rising (+1.2%/yr); 702 active listings in the ZIP; 15 comparable units currently listed for rent nearby; rentals at typical pace (median 23d on market — plan ~3-4 weeks tenant-placement turnaround); 1,479 units permitted in Escambia County in 2024 (0 in 5+ unit buildings).
Forward outlook
- Local home prices are declining (-3.0%/yr); year-one equity from $1k of loan paydown is wiped out by about $4k of value loss. Plan a longer hold.
- Escambia County population projected at +13% by 2050 — modest demand growth; plan on rents tracking national, not racing it.
Negotiation context
- Only 14 days on market — expect competitive offers; lowballing is unlikely to land.
Risks & watch-outs
- Climate carrying-cost: severe wind risk, 99% chance of damaging wind over 30y; extreme-heat days projected 7→22/yr by 2055 (HVAC capex compounding) — expect insurance premiums to compound above CPI over the hold.
Questions for the listing agent
- Built in 1962 — when were the roof, HVAC, electrical panel, plumbing, and water heater last replaced?
- Is there a deadline driving the sale (1031 exchange, divorce, estate, relocation)? That informs how much negotiation room exists.
- Schools are D-rated, which usually means shorter tenancies and higher turnover. Who's the typical renter profile here, and what's been the actual vacancy rate?
- What's the average days-on-market for RENTAL listings here right now (not sales)? A rising rental-DOM trend means longer vacancies and softer asking-rent achievability than the comps imply.
- What's the recent tenant-quality profile in this submarket — average credit score on applications, eviction rate, late-payment / NSF rate, and stable-employment percentage? A property-management company in the area should have these aggregated.
- How much new for-sale + rental construction is in the pipeline within 1–3 miles? Heavy new supply typically softens prices + rents 12–24 months out; constrained supply supports both.
Investment metrics
- 1% rule
- 0.95% ✗
- Cap rate
- 7.94%
- Cash-on-cash
- 5.89%
- DSCR
- 1.26
- GRM
- 8.8
CMA / ARV
- ARV (on-the-fly)
- $194,560
- Comps found
- 12
Show comp detail 12 sales within ~0.75 mi
| Address | Dist | Beds/Ba | Sqft | Sold | Price | $/sf | Match |
|---|---|---|---|---|---|---|---|
| 7 E Carver Dr | 0.32mi | 2/1.0 (-1) | 678 (-11%) | 2mo | $55,000 | $81 | 60 |
| 611 W Sunset Ave | 0.45mi | 2/1.0 (-1) | 768 (+1%) | 18mo | $220,000 | $286 | 57 |
| 91 Leyte Dr | 0.35mi | 2/2.0 (-1) | 690 (-9%) | 6mo | $149,000 | $216 | 54 |
| 220 Oak Ave | 0.38mi | 2/1.0 (-1) | 800 (+5%) | 20mo | $205,000 | $256 | 52 |
| 609 W Sunset Ave | 0.46mi | 2/2.0 (-1) | 753 (-1%) | 21mo | $245,000 | $325 | 51 |
| 504 W Sunset Ave | 0.60mi | 2/1.0 (-1) | 780 (+3%) | 17mo | $235,000 | $301 | 48 |
| 43 Druid Dr | 0.61mi | 3/1.0 | 864 (+14%) | 2mo | $70,500 | $82 | 47 |
| 107 Leyte Dr | 0.40mi | 3/1.5 | 837 (+10%) | 21mo | $145,000 | $173 | 44 |
| 120 Brandon Ave | 0.70mi | 3/1.0 | 806 (+6%) | 18mo | $179,000 | $222 | 43 |
| 1025 Lownde Ave | 0.42mi | 2/1.0 (-1) | 858 (+13%) | 18mo | $160,000 | $186 | 38 |
| 507 NW Syrcle Dr | 0.63mi | 4/1.5 (+1) | 840 (+10%) | 18mo | $229,000 | $273 | 31 |
| 315 Chattman St | 0.60mi | 3/2.0 | 866 (+14%) | 21mo | $355,000 | $410 | 27 |
Match score weights: distance 35% · size 25% · config 20% · recency 20%. Top-matched comps best support the ARV.
Projected returns pro-forma
-3.0% appreciation · 1.22% rent growth · sell at horizon
- IRR
- -9.1%
- Equity multiple
- 0.67×
- Total profit
- $-13,729
- Equity at exit
- $22,365
- IRR
- -2.0%
- Equity multiple
- 0.88×
- Total profit
- $-5,171
- Equity at exit
- $12,969
Cash invested: $42,000 (down + closing). Projections, not guarantees.
Landlord ↔ Tenant lean methodology
- Overall (STATE)
- 87 Strongly Landlord-Friendly
- State Florida
- 87 Strongly Landlord-Friendly · R+3
- County
- — inherits STATE
- City
- — inherits STATE
ZIP-level market 32507
- Home prices YoY
- -4.6%
- Rents YoY
- 1.2%
- Active inventory
- 702
- Price-to-rent
- 8.8×
Monthly cashflow live
- Estimated rent
- $1,424 high interval (Pro) →
- Mortgage (P&I)
- −$787
- Tax from tax record
- −$70 /mo · $838/yr
- Insurance
- −$62
- HOA
- −$0
- Vacancy / Maint / Mgmt
- −$299
- Net cashflow
- $206
Break-even live
UW: 25.0% down · 7.5% · 30yr · 1.5% tax · 5.0% vac · 8.0% maint · 8.0% mgmt
Financing live
Cash to close
- Down payment
- $37,500
- Closing costs
- $4,500
- Reserves months
- —
- Total cash needed
- —
Loan-product check · same deal, 3 products live
Conventional
25% down · 7.5% · 30yr
- Down + closing
- —
- Monthly P&I
- —
- Monthly cashflow
- —
- DSCR
- —
- Eligible?
- —
Personal DTI + credit; lowest rate.
DSCR
20% down · 8.5% · 30yr
- Down + closing
- —
- Monthly P&I
- —
- Monthly cashflow
- —
- DSCR
- —
- Eligible?
- —
No personal income docs; deal must DSCR.
Hard money
10% down · 12.0% · 12mo
- Down + closing
- —
- Monthly P&I
- —
- Monthly cashflow
- —
- DSCR
- —
- Eligible?
- —
Short-term bridge; refi at stabilization.
Rent comps 15 comps
| Address | Beds | Baths | Sqft | Rent | $/sqft | DOM | Units | Dist |
|---|---|---|---|---|---|---|---|---|
| 1036 Hawthorn Dr Unit B Pensacola, FL | 2.0 | 1.0 | 650 | $800 | $1.23 | 23d | 1 | 0.11mi |
| 45 W Carver Dr Pensacola, FL | 3.0 | 1.0 | 940 | $1,325 | $1.41 | 23d | 1 | 0.27mi |
| 26 N Lincoln Rd Unit B Pensacola, FL | 2.0 | 1.0 | 759 | $1,050 | $1.38 | 13d | 1 | 0.32mi |
| 7 Mindoro Cir Pensacola, FL | 3.0 | 1.0 | 924 | $1,395 | $1.51 | 23d | 1 | 0.39mi |
| 315 Flannan Rd Pensacola, FL | 3.0 | 1.0 | 836 | $1,745 | $2.09 | 13d | 1 | 0.56mi |
| 718 Mills Ave Unit A Pensacola, FL | 2.0 | 1.0 | 728 | $1,200 | $1.65 | 23d | 1 | 0.61mi |
| 99 S 3rd St Unit 3 Pensacola, FL | 2.0 | 1.5 | 900 | $1,259 | $1.40 | 23d | 1 | 0.72mi |
| 102 SE Kalash Rd Pensacola, FL | 4.0 | 2.0 | 1029 | $1,800 | $1.75 | 23d | 1 | 0.73mi |
| 2 E Sunset Ave Unit 3 Pensacola, FL | 2.0 | 1.0 | 806 | $1,350 | $1.67 | 23d | 1 | 0.75mi |
| 1120 S Old Corry Field Rd Pensacola, FL | 3.0 | 1.0 | 1000 | $1,295 | $1.29 | 23d | 1 | 0.86mi |
| 1007 Winton Ave Unit B Pensacola, FL | 2.0 | 1.0 | 810 | $1,295 | $1.60 | 23d | 1 | 0.95mi |
| 405 E Palmetto Ave Pensacola, FL | 2.0 | 1.0 | 900 | $1,800 | $2.00 | 23d | 1 | 0.97mi |
| 346 Quigley Rd Pensacola, FL | 3.0 | 2.0 | 1021 | $1,500 | $1.47 | 23d | 1 | 1.15mi |
| 316 Teakwood Cir Pensacola, FL | 2.0 | 1.5 | 1024 | $1,350 | $1.32 | 13d | 1 | 1.49mi |
| 4600 Twin Oaks Dr Pensacola, FL | 1.0–2.0 | 1.0 | 838 | $1,499 | $1.79 | 13d | 29 | 1.50mi |
Listing history 10 events
-
2026-06-18days on market $150,000 Active 14 DOM
-
2026-06-17days on market $150,000 Active 13 DOM
-
2026-06-16days on market $150,000 Active 12 DOM
-
2026-06-15days on market $150,000 Active 11 DOM
-
2026-06-14days on market $150,000 Active 9 DOM
-
2026-06-10days on market $150,000 Active 6 DOM
-
2026-06-09days on market $150,000 Active 5 DOM
-
2026-06-08days on market $150,000 Active 4 DOM
-
2026-06-07remarks 695-char remark
-
2026-06-07$150,000 Active 3 DOM
ⓘ Source: listings_history table (triggers on properties + properties_extension) + one-shot
backfill from property_details.listing_events for pre-trigger history.
Tax reassessment forecast FL · Resets to sale price
- Current annual tax
- $838 · $70/mo
- Projected year-2 tax
- $1,245 · $104/mo
- Expected delta
- +$407/yr (+$34/mo · 48.5%)
ⓘ Screening estimate from a state-policy table — verify with the county assessor before closing.
Climate risk First Street
- Flood 1/10 Low FEMA zone X (unshaded) · 0% chance over 30 yrs
- Wildfire 3/10 Moderate
- Heat 10/10 Extreme 7 d/yr ≥105°F today · 22 d/yr by 30 yrs out
- Wind 9/10 Extreme 99% chance of damaging wind over 30 yrs
- Air quality 1/10 Low 0 unhealthy d/yr today · 0 by 30 yrs out
Nearby sold comps map
Loading sold comps map…
Walkable amenities ~0.75 mi
Loading nearby amenities…
Taxation est. · year 1
- Rental income
- $17,092
- − Mortgage interest
- −$8,402
- − Property taxes
- −$838
- − Insurance
- −$750
- − Repairs & maintenance
- −$1,367
- − Management
- −$1,367
- − Depreciation
- −$4,364
- Taxable income
- $3
- Est. tax owed @ 24.0%
- −$1
- After-tax cash flow
- $2,474/yr
For passive investors: Depreciation is non-cash, so a rental often shows a tax loss while cash-flowing — sheltering income. Rental losses are passive: they offset passive income freely, and up to $25,000/yr can offset ordinary (W-2) income if you actively participate and your MAGI is under $100k (phasing out to $0 by $150k); unused losses carry forward. On sale, claimed depreciation is recaptured at up to 25%, and gains may owe capital-gains tax (a 1031 exchange can defer both). Figures are a year-1 estimate at your 24.0% rate — not tax advice; consult a CPA.
Schools (NCES district)
- District
- Escambia
- NCES district ID
- 1200510
- Math proficiency
- 40% ▼ -9.00%
- Reading proficiency
- 45% ▼ -4.00%
- Median HH income
- $44,649
- Composite
- 36.04/100
- National rank
- #4773
- State rank
- #56 of 73 in FL
Livability — Warrington
- Score
- 65/100
- State rank
- #631
- US rank
- #12396
Category grades
Schools grade is shown separately in the Schools card above.
Census & demographics
- Census place
- Warrington, FL
- County
- Escambia County · 301,722 people
- Metro
- Pensacola-Ferry Pass-Brent, FL
- Population (ZIP)
- 32,226
- Household income
- $73,540
- Rent vs Own
- Severe rent burden
- 1175.0
Population outlook (Escambia County) Hauer SSP2
- Today (2025)
- 334,637 people
- By 2030
- 345,779 · +3.3%
- By 2040
- 364,828 · +9.0%
- By 2050
- 378,514 · +13.1%
- By 2075
- 403,220 · +20.5%
- By 2100
- 386,125 · +15.4%
Race, ethnicity, and origin ACS 2023
- Neighborhood character
- Predominantly White (73%)
- Race & ethnicity
- White 73% Black 10% Two or more races 10% Hispanic / Latino 7% Asian 2%
- Hispanic origin (detail)
- Mexican 3% Puerto Rican 2%
- Common ancestry
- Slovak 3% Lithuanian 2% Romanian 2%
- Foreign-born
- 5% · Canada, Vietnam
- Languages at home
- 92% English-only · Spanish 4% Other Asian/Pacific 1% French/Haitian/Cajun 1%
Political lean MEDSL · Escambia
- 2024 margin
- R (+19.5) · D 39.7% · R 59.2% · Other 1.1%
- 2008→2024 swing
- -0.2pp no change · 2008: -19.3pp · 2024: -19.5pp
- All cycles
- 2024: R+19.5 2020: R+15.1 2016: R+20.6 2012: R+20.6 2008: R+19.3
Not yet ingested
- Civics
- —
Market trends
- HPI YoY
- ▼ -26.23%
- Current HPI
- 548.03
- Rent YoY
- ▲ 1.22%
- Metro
- Pensacola-Ferry Pass-Brent, FL
- State GDP YoY
- ▲ 3.28%
- F500 in state
- 36
Industry mix (Fortune 500 HQ in FL)
| Industry | F500 HQs | Revenue |
|---|---|---|
| Industrial Technology | 2 | $29B |
|
||
| Insurance | 2 | $17B |
|
||
| Retail | 1 | $60B |
|
||
| Technology Distribution | 1 | $58B |
|
||
| Homebuilding | 1 | $35B |
|
||
| Technology Manufacturing | 1 | $35B |
|
||
Price history
1 event — show timeline
- 2026-06-04 Listed $150,000 ForSaleByOwner.com
Property tax history
+6.4%/yrLatest (2025): $838 · +19.9% YoY. Source: county tax records.
Cash-flow waterfall
monthlySold comps — $/sqft
last 12 mo · ≤1 miLoading sold comps…