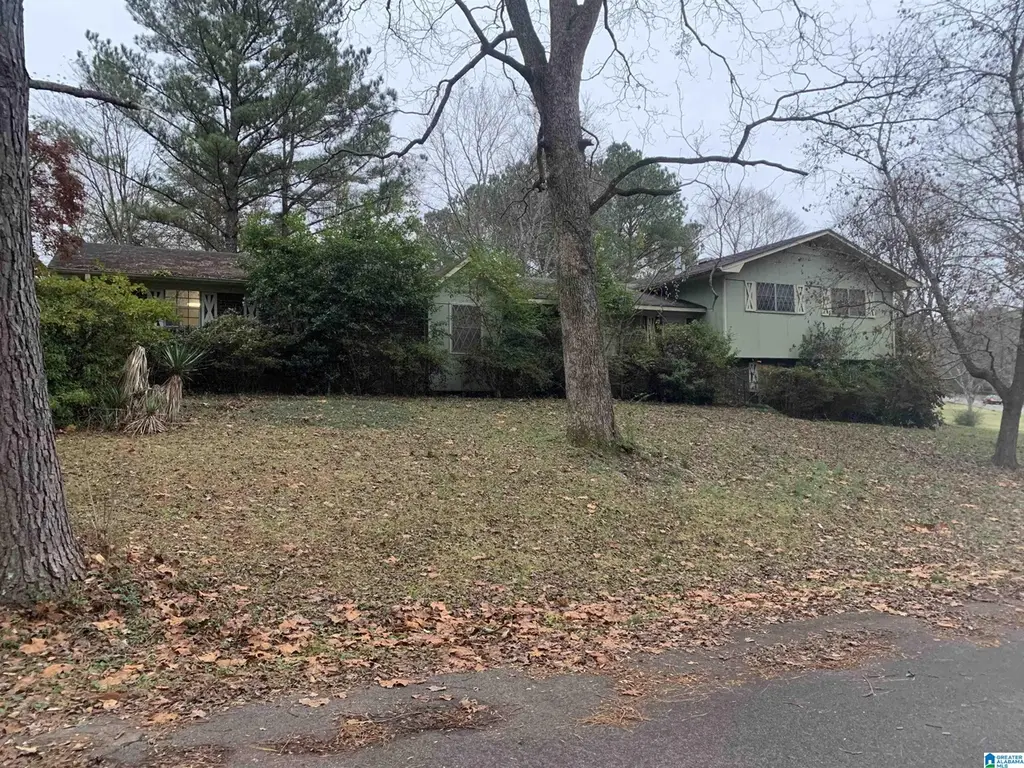
1805 L Dr · Fultondale, AL
Flood risk 1/10 · Minimal
- FEMA flood zone
- X (unshaded)
- Chance of flooding over 30 yrs
- 0.0%
- Est. flood insurance / yr
- $473 – $860
Fire risk 3/10 · Minor
- Est. fire insurance / yr
- $916 – $1,700
Heat risk 6/10 · Moderate
- Hot days now (above 106°F)
- 7 days/yr
- Hot days in 30 yrs
- 19 days/yr
Wind risk 6/10 · Moderate
- Chance of severe wind over 30 yrs
- 27.0%
Air-quality risk 5/10 · Moderate
- Unhealthy air days now
- 9 days/yr
- Unhealthy air days in 30 yrs
- 10 days/yr
Risk factors via First Street. Map © Google.
Why this score? — see what drove the D+ grade
The composite is a weighted blend of 9 inputs, each scored 0–100. Each bar is that input's sub-score; the figure is the points it added to the 100-point composite (weight × sub-score).
- Cash flow +15.7/30.0
- ARV discount +13.8/15.0
- DSCR +4.9/10.0
- 1% rule +4.3/10.0
- Livability +3.5/5.0
- Rent growth +2.5/5.0
- Condition / age +2.2/5.0
- Schools +1.8/10.0
- Appreciation +0.0/10.0
$244,000
🖨 Deal sheet 📄 Offer letter ✓ Due diligence
Listing remarks MLS
Great investment opportunity! Large home with an extra lot! Lots of potential!
Key facts
- 0.66 acre lot
- 2 parking spots
- Built 1973
Neighborhood map
What this means for you Summary
Snapshot
- This is a 5-bed/3.5-bath single-family listed at $244k. Condition is rated fair.
Deal economics
- At list price, monthly cash flow is $109 ($1k/yr) — positive.
- The deal already cash-flows at list — no discount required.
- To meet the 1% rule (rent ≥ 1% of price), the offer needs to be $227k (6.9% below list).
- Recommended offer: $215k (12.0% below list) — sets the bar for market timing.
- Cap rate 6.8% vs local median 4.7% in Fultondale — top-decile yield for the area; either an underpriced asset or a hidden risk that comps aren't pricing in. Stress-test before assuming the spread holds.
Location & tenants
- Location reads 69/100 on livability (#51 in AL) — a middle-class / working-renter tenant base. Strengths: cost of living A+, housing A+, employment B; Watch: crime D+, schools F, amenities F.
- Jefferson County (suburban): math 9% / reading 32% proficiency, ranked #104 of 129 in AL (top 81%) — low school quality limits family demand, transient renter base, plan for 1-2y turnover.
- Market conditions: 105 active listings in the ZIP; 2 comparable units currently listed for rent nearby; 2,114 units permitted in Jefferson County in 2024 (556 in 5+ unit buildings).
- This rent runs 37% of the median local income ($74k/yr) — at the standard rent-burdened threshold; future hikes will face affordability resistance.
Forward outlook
- Local home prices are declining (-3.0%/yr); year-one equity from $2k of loan paydown is wiped out by about $7k of value loss. Plan a longer hold.
- Jefferson County population projected to shrink 4% by 2050 — rents likely to lag national; underwrite the cash flow, not the appreciation.
Negotiation context
- It's been on market 171 days — a 12% lower offer ($215k) is reasonable based on typical stale-listing flexibility.
Risks & watch-outs
- Climate carrying-cost: major wind risk, 27% chance of damaging wind over 30y; extreme-heat days projected 7→19/yr by 2055 (HVAC capex compounding) — expect insurance premiums to compound above CPI over the hold.
Questions for the listing agent
- It's been on market 171 days. Have you received any prior offers? Is the seller open to a 12% concession, seller financing, or rate buy-down credit?
- Have any recent inspections been done? Can we get a copy of the seller's disclosures and any deferred-maintenance estimates?
- Built in 1973 — when were the roof, HVAC, electrical panel, plumbing, and water heater last replaced?
- Why hasn't it sold? Are there any deal-killer items the seller is aware of (foundation, flood, title, zoning, code violations)?
- Is there a deadline driving the sale (1031 exchange, divorce, estate, relocation)? That informs how much negotiation room exists.
- Schools are F-rated, which usually means shorter tenancies and higher turnover. Who's the typical renter profile here, and what's been the actual vacancy rate?
- Crime grade is D in this area — have there been break-ins, vandalism, or insurance claims at this property in the last 3 years? What carrier currently insures it and at what premium?
- The area grade is low — what's the realistic commute time and amenity access for the typical tenant pool here? Any planned neighborhood developments (good or bad) we should know about?
- What's the average days-on-market for RENTAL listings here right now (not sales)? A rising rental-DOM trend means longer vacancies and softer asking-rent achievability than the comps imply.
- What's the recent tenant-quality profile in this submarket — average credit score on applications, eviction rate, late-payment / NSF rate, and stable-employment percentage? A property-management company in the area should have these aggregated.
- How much new for-sale + rental construction is in the pipeline within 1–3 miles? Heavy new supply typically softens prices + rents 12–24 months out; constrained supply supports both.
Investment metrics
- 1% rule
- 0.93% ✗
- Cap rate
- 6.83%
- Cash-on-cash
- 1.91%
- DSCR
- 1.09
- GRM
- 8.9
CMA / ARV
- ARV (median comp)
- $283,782
- List price
- $244,000
- Delta
- -14.02%
- Verdict
- UNDERPRICED
- Comps
- 20 within 1.0 mi
Show comp detail 3 sales within ~0.75 mi
| Address | Dist | Beds/Ba | Sqft | Sold | Price | $/sf | Match |
|---|---|---|---|---|---|---|---|
| 2008 Elkwood Dr | 0.09mi | 4/2.0 (-1) | 2,538 (+1%) | 15mo | $280,000 | $110 | 71 |
| 108 Grace St | 0.41mi | 4/3.0 (-1) | 2,545 (+1%) | 15mo | $325,000 | $128 | 59 |
| 1833 Maplecrest Ln | 0.39mi | 4/3.0 (-1) | 2,318 (-8%) | 13mo | $270,000 | $116 | 51 |
Match score weights: distance 35% · size 25% · config 20% · recency 20%. Top-matched comps best support the ARV.
Projected returns pro-forma
-3.0% appreciation · 3.0% rent growth · sell at horizon
- IRR
- -13.2%
- Equity multiple
- 0.52×
- Total profit
- $-32,575
- Equity at exit
- $36,381
- IRR
- -4.3%
- Equity multiple
- 0.72×
- Total profit
- $-19,303
- Equity at exit
- $21,097
Cash invested: $68,320 (down + closing). Projections, not guarantees.
Landlord ↔ Tenant lean methodology
- Overall (STATE)
- 90 Strongly Landlord-Friendly
- State Alabama
- 90 Strongly Landlord-Friendly · R+15
- County
- — inherits STATE
- City
- — inherits STATE
ZIP-level market 35068
- Home prices YoY
- -9.4%
- Active inventory
- 105
- Price-to-rent
- 8.9×
Monthly cashflow live
- Estimated rent
- $2,272 medium interval (Pro) →
- Mortgage (P&I)
- −$1,280
- Tax est. 1.5%
- −$305 /mo · $3,660/yr
- Insurance
- −$102
- HOA
- −$0
- Vacancy / Maint / Mgmt
- −$477
- Net cashflow
- $109
Break-even live
UW: 25.0% down · 7.5% · 30yr · 1.5% tax · 5.0% vac · 8.0% maint · 8.0% mgmt
Financing live
Cash to close
- Down payment
- $61,000
- Closing costs
- $7,320
- Reserves months
- —
- Total cash needed
- —
Loan-product check · same deal, 3 products live
Conventional
25% down · 7.5% · 30yr
- Down + closing
- —
- Monthly P&I
- —
- Monthly cashflow
- —
- DSCR
- —
- Eligible?
- —
Personal DTI + credit; lowest rate.
DSCR
20% down · 8.5% · 30yr
- Down + closing
- —
- Monthly P&I
- —
- Monthly cashflow
- —
- DSCR
- —
- Eligible?
- —
No personal income docs; deal must DSCR.
Hard money
10% down · 12.0% · 12mo
- Down + closing
- —
- Monthly P&I
- —
- Monthly cashflow
- —
- DSCR
- —
- Eligible?
- —
Short-term bridge; refi at stabilization.
Rent comps 2 comps
| Address | Beds | Baths | Sqft | Rent | $/sqft | DOM | Units | Dist |
|---|---|---|---|---|---|---|---|---|
| 465 W Park Dr Fultondale, AL | 4.0 | 2.5 | 2159 | $2,146 | $0.99 | 16d | 1 | 0.90mi |
| 2938 Summit Dr Fultondale, AL | 4.0 | 2.0 | 1956 | $2,200 | $1.12 | 1d | 1 | 1.24mi |
Listing history 14 events
-
2026-06-18days on market $244,000 Active 171 DOM
-
2026-06-17days on market $244,000 Active 170 DOM
-
2026-06-16days on market $244,000 Active 169 DOM
-
2026-06-15days on market $244,000 Active 168 DOM
-
2026-06-13days on market $244,000 Active 166 DOM
-
2026-06-10days on market $244,000 Active 163 DOM
-
2026-06-09days on market $244,000 Active 162 DOM
-
2026-06-08days on market $244,000 Active 161 DOM
-
2026-06-07days on market $244,000 Active 160 DOM
-
2026-06-03days on market $244,000 Active 156 DOM
-
2026-06-02days on market $244,000 Active 155 DOM
-
2026-06-01days on market $244,000 Active 154 DOM
-
2026-05-31days on market $244,000 Active 153 DOM
-
2025-12-29$244,000 Active 79-char remark
Show marketing remark (79 chars)
Great investment opportunity! Large home with an extra lot! Lots of potential!
ⓘ Source: listings_history table (triggers on properties + properties_extension) + one-shot
backfill from property_details.listing_events for pre-trigger history.
Climate risk First Street
- Flood 1/10 Low FEMA zone X (unshaded) · 0% chance over 30 yrs
- Wildfire 3/10 Moderate
- Heat 6/10 Major 7 d/yr ≥106°F today · 19 d/yr by 30 yrs out
- Wind 6/10 Major 27% chance of damaging wind over 30 yrs
- Air quality 5/10 Major 9 unhealthy d/yr today · 10 by 30 yrs out
Nearby sold comps map
Loading sold comps map…
Walkable amenities ~0.75 mi
Loading nearby amenities…
Taxation est. · year 1
- Rental income
- $27,266
- − Mortgage interest
- −$13,668
- − Property taxes
- −$3,660
- − Insurance
- −$1,220
- − Repairs & maintenance
- −$2,181
- − Management
- −$2,181
- − Depreciation
- −$7,098
- Taxable loss
- −$2,742
- Est. tax savings @ 24.0%
- +$658
- After-tax cash flow
- $1,964/yr
For passive investors: Depreciation is non-cash, so a rental often shows a tax loss while cash-flowing — sheltering income. Rental losses are passive: they offset passive income freely, and up to $25,000/yr can offset ordinary (W-2) income if you actively participate and your MAGI is under $100k (phasing out to $0 by $150k); unused losses carry forward. On sale, claimed depreciation is recaptured at up to 25%, and gains may owe capital-gains tax (a 1031 exchange can defer both). Figures are a year-1 estimate at your 24.0% rate — not tax advice; consult a CPA.
Condition & rehab AI · 12 photos
The property requires significant exterior and interior repairs, including landscaping, flooring, and kitchen updates. These improvements will significantly enhance its resale and rental value.
Repairs flagged
- Major Overgrown vegetation — Needs trimming and clearing
- Major Debris — Needs removal
- Moderate Flooring — Worn-out and needs replacement
Value-add opportunities
- Both Landscaping and curb appeal — Enhances curb appeal and resale value
- Both Flooring replacement — Improves living space and rental value
- Both Kitchen appliances — Updates the kitchen and enhances resale value
Renovation cost estimate screening
| Repair item | Severity | Est. cost |
|---|---|---|
| Overgrown vegetation · Needs trimming and clearing | Major | $15,000–50,000 |
| Debris · Needs removal | Major | $15,000–50,000 |
| Flooring · Worn-out and needs replacement | Moderate | $3,000–15,000 |
| Total estimated repair cost · 3 items | $33,000–115,000 |
Value-add ROI direction
- Both Landscaping and curb appeal — Enhances curb appeal and resale value ↑
- Both Flooring replacement — Improves living space and rental value ↑
- Both Kitchen appliances — Updates the kitchen and enhances resale value ↑
ⓘ Cost ranges are severity-bucket heuristics (US national rule-of-thumb). Get contractor quotes + a written scope before underwriting a rehab budget.
Schools (NCES district)
- District
- Jefferson County
- NCES district ID
- 0101920
- Math proficiency
- 9% ▼ -24.00%
- Reading proficiency
- 32% ▼ -5.00%
- Median HH income
- $51,712
- Composite
- 18.4/100
- National rank
- #8937
- State rank
- #104 of 129 in AL
Livability — Fultondale
- Score
- 69/100
- State rank
- #51
- US rank
- #8334
Category grades
Schools grade is shown separately in the Schools card above.
Census & demographics
- Census place
- Fultondale, AL
- County
- Jefferson County · 527,445 people
- City population
- 8,378
- Metro
- Birmingham-Hoover, AL
- Population (ZIP)
- 8,378
- Household income
- $73,750
- Rent vs Own
- Severe rent burden
- 302.0
Population outlook (Jefferson County) Hauer SSP2
- Today (2025)
- 669,185 people
- By 2030
- 669,694 · +0.1%
- By 2040
- 661,388 · -1.2%
- By 2050
- 643,086 · -3.9%
- By 2075
- 577,267 · -13.7%
- By 2100
- 474,758 · -29.1%
Race, ethnicity, and origin ACS 2023
- Neighborhood character
- Diverse neighborhood (Simpson 0.58)
- Race & ethnicity
- White 49% Black 43% Hispanic / Latino 4% Two or more races 3%
- Common ancestry
- Serbian 1% Iranian 1% Slovak 1%
- Foreign-born
- 4% · Canada
- Languages at home
- 93% English-only · Spanish 5%
Political lean MEDSL · Jefferson
- 2024 margin
- D (+10.4) · D 54.6% · R 44.2% · Other 1.2%
- 2008→2024 swing
- +5.4pp toward D · 2008: 5.1pp · 2024: 10.4pp
- All cycles
- 2024: D+10.4 2020: D+13.2 2016: D+7.2 2012: D+6.0 2008: D+5.1
Not yet ingested
- Civics
- —
Market trends
- HPI YoY
- ▼ -23.34%
- Current HPI
- 224.4813
- Rent YoY
- —
- Metro
- Birmingham-Hoover, AL
- State GDP YoY
- ▲ 2.94%
- F500 in state
- 4
Industry mix (Fortune 500 HQ in AL)
| Industry | F500 HQs | Revenue |
|---|---|---|
| Financial Services | 1 | $8B |
|
||
| Healthcare | 1 | $5B |
|
||
Price history
1 event — show timeline
- 2025-12-29 Listed $244,000 Greater Alabama MLS
Cash-flow waterfall
monthlySold comps — $/sqft
last 12 mo · ≤1 miLoading sold comps…