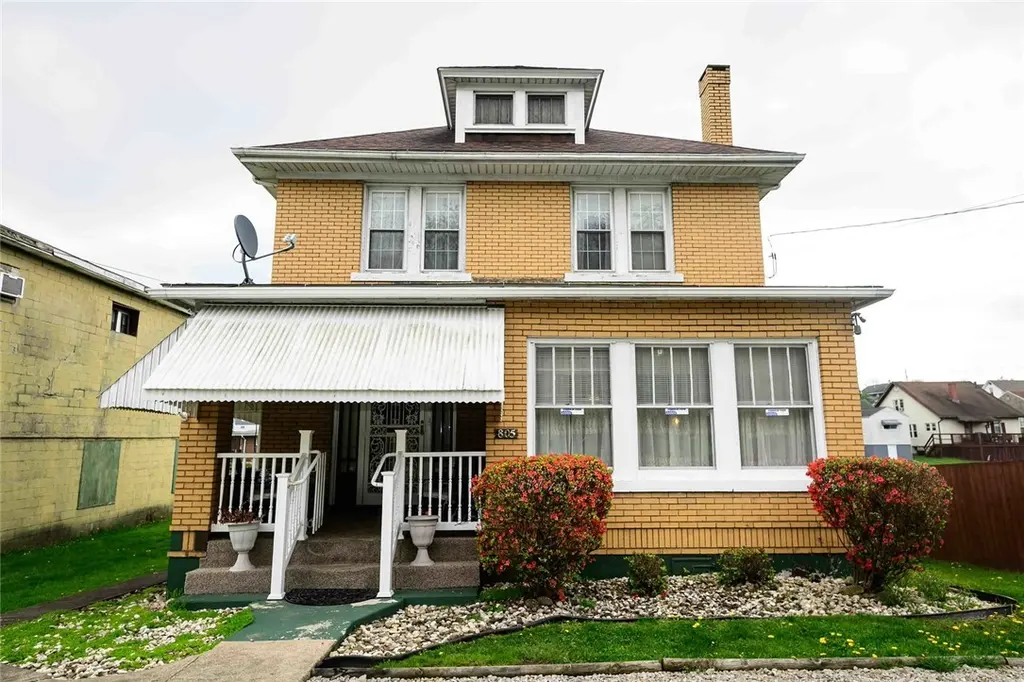
805 High St · Luzerne, PA
Flood risk 6/10 · Moderate
- FEMA flood zone
- X (unshaded)
- Chance of flooding over 30 yrs
- 0.68%
- Est. flood insurance / yr
- $473 – $860
Fire risk 1/10 · Minimal
- Est. fire insurance / yr
- $511 – $949
Heat risk 4/10 · Minor
- Hot days now (above 98°F)
- 7 days/yr
- Hot days in 30 yrs
- 19 days/yr
Wind risk 2/10 · Minimal
- Chance of severe wind over 30 yrs
- —
Air-quality risk 2/10 · Minimal
- Unhealthy air days now
- 1 days/yr
- Unhealthy air days in 30 yrs
- 2 days/yr
Risk factors via First Street. Map © Google.
Why this score? — see what drove the C- grade
The composite is a weighted blend of 9 inputs, each scored 0–100. Each bar is that input's sub-score; the figure is the points it added to the 100-point composite (weight × sub-score).
- Cash flow +15.6/30.0
- ARV discount +14.1/15.0
- DSCR +4.8/10.0
- Appreciation +4.2/10.0
- 1% rule +3.9/10.0
- Livability +3.8/5.0
- Rent growth +2.5/5.0
- Condition / age +2.5/5.0
- Schools +2.1/10.0
$120,000
🖨 Deal sheet 📄 Offer letter ✓ Due diligence
Listing remarks MLS
This inviting brick two-story home offers 3 comfortable bedrooms, 2 full bathrooms, a sunroom surrounded by windows, detached two-car garage, and great everyday functionality. The covered front and back porches add welcoming outdoor living spaces, while the solid brick exterior and vinyl railings provide classic charm and low-maintenance durability. Inside, the layout feels warm and practical with pocket doors separating the living room and dining area, plenty of natural light throughout and room to settle in. There is an additional off road parking area in front of the house. The third floor is finished and can be used as an extra bedroom.
Key facts
- Pocket doors
- Natural light
- Vinyl railings
Tags
Neighborhood map
What this means for you Summary
Snapshot
- This is a 2-bed/1.5-bath single-family listed at $120k.
Deal economics
- At list price, monthly cash flow is $52 ($619/yr) — positive.
- The deal already cash-flows at list — no discount required.
- To meet the 1% rule (rent ≥ 1% of price), the offer needs to be $106k (11.3% below list).
- Recommended offer: $106k (11.3% below list) — sets the bar for 1% rule.
Location & tenants
- Location reads 76/100 on livability (#391 in PA, #3,538 nationally) — a middle-class / working-renter tenant base. Strengths: crime A+, cost of living A+, housing A+; Watch: amenities C-, schools D+, commute F.
- Brownsville Area SD (rural): math 17% / reading 34% proficiency, ranked #472 of 539 in PA (top 88%) — low school quality limits family demand, transient renter base, plan for 1-2y turnover.
- Market conditions: 45 active listings in the ZIP; 201 units permitted in Fayette County in 2024 (10 in 5+ unit buildings).
Forward outlook
- Local home prices are declining (-1.7%/yr); year-one equity from $830 of loan paydown is wiped out by about $2k of value loss. Plan a longer hold.
- Fayette County population projected at -19% by 2050 — secular population decline; favor cash flow + early exit over multi-decade hold.
Negotiation context
- It's been on market 63 days — a 6% lower offer ($113k) is reasonable based on typical stale-listing flexibility.
- Current owner paid $34k; list at $120k implies a 253% gain — meaningful room to come down on a strong offer.
Risks & watch-outs
- Watch-outs: built in 1945 — expect roof / HVAC / electrical / plumbing capex.
- Climate carrying-cost: major flood risk — expect insurance premiums to compound above CPI over the hold.
Questions for the listing agent
- It's been on market 63 days. Have you received any prior offers? Is the seller open to a 11% concession, seller financing, or rate buy-down credit?
- Built in 1945 — when were the roof, HVAC, electrical panel, plumbing, and water heater last replaced?
- Why hasn't it sold? Are there any deal-killer items the seller is aware of (foundation, flood, title, zoning, code violations)?
- Is there a deadline driving the sale (1031 exchange, divorce, estate, relocation)? That informs how much negotiation room exists.
- Schools are D-rated, which usually means shorter tenancies and higher turnover. Who's the typical renter profile here, and what's been the actual vacancy rate?
- What's the average days-on-market for RENTAL listings here right now (not sales)? A rising rental-DOM trend means longer vacancies and softer asking-rent achievability than the comps imply.
- What's the recent tenant-quality profile in this submarket — average credit score on applications, eviction rate, late-payment / NSF rate, and stable-employment percentage? A property-management company in the area should have these aggregated.
- How much new for-sale + rental construction is in the pipeline within 1–3 miles? Heavy new supply typically softens prices + rents 12–24 months out; constrained supply supports both.
Investment metrics
- 1% rule
- 0.89% ✗
- Cap rate
- 6.81%
- Cash-on-cash
- 1.84%
- DSCR
- 1.08
- GRM
- 9.4
CMA / ARV
- ARV (median comp)
- $140,619
- List price
- $120,000
- Delta
- -14.66%
- Verdict
- UNDERPRICED
- Comps
- 20 within 1.0 mi
Show comp detail 9 sales within ~0.75 mi
| Address | Dist | Beds/Ba | Sqft | Sold | Price | $/sf | Match |
|---|---|---|---|---|---|---|---|
| 812 High St | 0.04mi | 3/2.0 (+1) | 1,536 (-6%) | 9mo | $190,000 | $124 | 74 |
| 209 Frick St (aka 300 Crawford Ave) | 0.33mi | 2/1.0 | 1,799 (+10%) | 1mo | $92,000 | $51 | 65 |
| 1117 2nd St | 0.49mi | 3/1.0 (+1) | 1,662 (+2%) | 7mo | $8,000 | $5 | 61 |
| 1021 High St | 0.28mi | 3/3.0 (+1) | 1,762 (+8%) | 3mo | $225,000 | $128 | 60 |
| 1250 2nd St | 0.51mi | 3/1.0 (+1) | 1,560 (-4%) | 6mo | $10,500 | $7 | 57 |
| 1020 Lewis St | 0.27mi | 3/1.5 (+1) | 1,420 (-13%) | 6mo | $150,000 | $106 | 55 |
| 729 Catherine Ave | 0.51mi | 3/1.0 (+1) | 1,592 (-2%) | 20mo | $57,000 | $36 | 49 |
| 1106 2nd St | 0.51mi | 3/2.0 (+1) | 1,876 (+15%) | 16mo | $152,000 | $81 | 32 |
| 722 Water St | 0.61mi | 3/1.5 (+1) | 1,856 (+14%) | 23mo | $24,000 | $13 | 24 |
Match score weights: distance 35% · size 25% · config 20% · recency 20%. Top-matched comps best support the ARV.
Projected returns pro-forma
-1.67% appreciation · 3.0% rent growth · sell at horizon
- IRR
- -6.7%
- Equity multiple
- 0.72×
- Total profit
- $-9,319
- Equity at exit
- $25,178
- IRR
- 0.8%
- Equity multiple
- 1.07×
- Total profit
- $2,297
- Equity at exit
- $23,330
Cash invested: $33,600 (down + closing). Projections, not guarantees.
Landlord ↔ Tenant lean methodology
- Overall (STATE)
- 62 Landlord-Friendly
- State Pennsylvania
- 62 Landlord-Friendly · EVEN
- County
- — inherits STATE
- City
- — inherits STATE
ZIP-level market 15417
- Home prices YoY
- -0.9%
- Active inventory
- 45
- Price-to-rent
- 9.4×
Monthly cashflow live
- Estimated rent
- $1,065 medium interval (Pro) →
- Mortgage (P&I)
- −$629
- Tax from tax record
- −$110 /mo · $1,324/yr
- Insurance
- −$50
- HOA
- −$0
- Vacancy / Maint / Mgmt
- −$224
- Net cashflow
- $52
Break-even live
UW: 25.0% down · 7.5% · 30yr · 1.5% tax · 5.0% vac · 8.0% maint · 8.0% mgmt
Financing live
Cash to close
- Down payment
- $30,000
- Closing costs
- $3,600
- Reserves months
- —
- Total cash needed
- —
Loan-product check · same deal, 3 products live
Conventional
25% down · 7.5% · 30yr
- Down + closing
- —
- Monthly P&I
- —
- Monthly cashflow
- —
- DSCR
- —
- Eligible?
- —
Personal DTI + credit; lowest rate.
DSCR
20% down · 8.5% · 30yr
- Down + closing
- —
- Monthly P&I
- —
- Monthly cashflow
- —
- DSCR
- —
- Eligible?
- —
No personal income docs; deal must DSCR.
Hard money
10% down · 12.0% · 12mo
- Down + closing
- —
- Monthly P&I
- —
- Monthly cashflow
- —
- DSCR
- —
- Eligible?
- —
Short-term bridge; refi at stabilization.
Listing history 16 events
-
2026-06-18days on market $120,000 Active 63 DOM
-
2026-06-17days on market $120,000 Active 62 DOM
-
2026-06-16days on market $120,000 Active 61 DOM
-
2026-06-15days on market $120,000 Active 60 DOM
-
2026-06-13days on market $120,000 Active 58 DOM
-
2026-06-12days on market $120,000 Active 57 DOM
-
2026-06-09days on market $120,000 Active 54 DOM
-
2026-06-08days on market $120,000 Active 53 DOM
-
2026-06-08pricedays on market $120,000 Active 52 DOM
-
2026-06-04days on market $130,000 Active 48 DOM
-
2026-06-02days on market $130,000 Active 47 DOM
-
2026-06-01days on market $130,000 Active 46 DOM
-
2026-05-31days on market $130,000 Active 45 DOM
-
2026-04-27price $130,000 648-char remark
Show marketing remark (648 chars)
This inviting brick two-story home offers 3 comfortable bedrooms, 2 full bathrooms, a sunroom surrounded by windows, detached two-car garage, and great everyday functionality. The covered front and back porches add welcoming outdoor living spaces, while the solid brick exterior and vinyl railings provide classic charm and low-maintenance durability. Inside, the layout feels warm and practical with pocket doors separating the living room and dining area, plenty of natural light throughout and room to settle in. There is an additional off road parking area in front of the house. The third floor is finished and can be used as an extra bedroom.
-
2026-04-16$159,900 Active 648-char remark
Show marketing remark (648 chars)
This inviting brick two-story home offers 3 comfortable bedrooms, 2 full bathrooms, a sunroom surrounded by windows, detached two-car garage, and great everyday functionality. The covered front and back porches add welcoming outdoor living spaces, while the solid brick exterior and vinyl railings provide classic charm and low-maintenance durability. Inside, the layout feels warm and practical with pocket doors separating the living room and dining area, plenty of natural light throughout and room to settle in. There is an additional off road parking area in front of the house. The third floor is finished and can be used as an extra bedroom.
-
1992-04-30soldstatus $34,000
ⓘ Source: listings_history table (triggers on properties + properties_extension) + one-shot
backfill from property_details.listing_events for pre-trigger history.
Tax reassessment forecast PA · Partial reset (capped growth)
- Current annual tax
- $1,324 · $110/mo
- Projected year-2 tax
- $1,610 · $134/mo
- Expected delta
- +$286/yr (+$24/mo · 21.6%)
ⓘ Screening estimate from a state-policy table — verify with the county assessor before closing.
Climate risk First Street
- Flood 6/10 Major FEMA zone X (unshaded) · 68% chance over 30 yrs
- Wildfire 1/10 Low
- Heat 4/10 Moderate 7 d/yr ≥98°F today · 19 d/yr by 30 yrs out
- Wind 2/10 Low
- Air quality 2/10 Low 1 unhealthy d/yr today · 2 by 30 yrs out
Nearby sold comps map
Loading sold comps map…
Walkable amenities ~0.75 mi
Loading nearby amenities…
Taxation est. · year 1
- Rental income
- $12,778
- − Mortgage interest
- −$6,722
- − Property taxes
- −$1,324
- − Insurance
- −$600
- − Repairs & maintenance
- −$1,022
- − Management
- −$1,022
- − Depreciation
- −$3,491
- Taxable loss
- −$1,403
- Est. tax savings @ 24.0%
- +$337
- After-tax cash flow
- $956/yr
For passive investors: Depreciation is non-cash, so a rental often shows a tax loss while cash-flowing — sheltering income. Rental losses are passive: they offset passive income freely, and up to $25,000/yr can offset ordinary (W-2) income if you actively participate and your MAGI is under $100k (phasing out to $0 by $150k); unused losses carry forward. On sale, claimed depreciation is recaptured at up to 25%, and gains may owe capital-gains tax (a 1031 exchange can defer both). Figures are a year-1 estimate at your 24.0% rate — not tax advice; consult a CPA.
Schools (NCES district)
- District
- Brownsville Area SD
- NCES district ID
- 4204080
- Math proficiency
- 17% ▼ -3.00%
- Reading proficiency
- 34% ▼ -5.00%
- Median HH income
- $34,500
- Composite
- 20.93/100
- National rank
- #8481
- State rank
- #472 of 539 in PA
Livability — Luzerne
- Score
- 76/100
- State rank
- #391
- US rank
- #3538
Category grades
Schools grade is shown separately in the Schools card above.
Census & demographics
- Census place
- Hiller, PA
- City population
- 2,959
- Population (ZIP)
- 7,709
Population outlook (Fayette County) Hauer SSP2
- Today (2025)
- 127,561 people
- By 2030
- 123,206 · -3.4%
- By 2040
- 113,232 · -11.2%
- By 2050
- 103,468 · -18.9%
- By 2075
- 83,185 · -34.8%
- By 2100
- 62,384 · -51.1%
Race, ethnicity, and origin ACS 2023
- Neighborhood character
- Predominantly White (85%)
- Race & ethnicity
- White 85% Black 8% Two or more races 6% Hispanic / Latino 2%
- Common ancestry
- Romanian 9% Lithuanian 2% Serbian 2%
- Foreign-born
- 1%
- Languages at home
- 98% English-only · Spanish 1% Other Indo-European 1%
Political lean MEDSL · Fayette
- 2024 margin
- Solid R (+37.9) · D 30.8% · R 68.7%
- 2008→2024 swing
- -37.5pp toward R · 2008: -0.4pp · 2024: -37.9pp
- All cycles
- 2024: R+37.9 2020: R+33.5 2016: R+31.0 2012: R+8.3 2008: R+0.4
Not yet ingested
- Civics
- —
Market trends
- HPI YoY
- ▼ -1.67%
- Current HPI
- 190.8891
- Rent YoY
- —
- Metro
- —
- State GDP YoY
- ▲ 1.68%
- F500 in state
- 34
Industry mix (Fortune 500 HQ in PA)
| Industry | F500 HQs | Revenue |
|---|---|---|
| Healthcare | 2 | $309B |
|
||
| Insurance | 2 | $27B |
|
||
| Telecommunications / Media | 1 | $124B |
|
||
| Industrial Distribution | 1 | $22B |
|
||
| Financial Services | 1 | $20B |
|
||
| Chemicals / Materials | 1 | $18B |
|
||
Price history
+282.4% since first listed3 events — show timeline
- 2026-04-27 Price Changed $130,000 West Penn MLS
- 2026-04-16 Listed $159,900 West Penn MLS
- 1992-04-30 Sold (Public Records) $34,000 Public Records
Property tax history
+2.5%/yrLatest (2026): $1,324 · +0.0% YoY. Source: county tax records.
Cash-flow waterfall
monthlySold comps — $/sqft
last 12 mo · ≤1 miLoading sold comps…