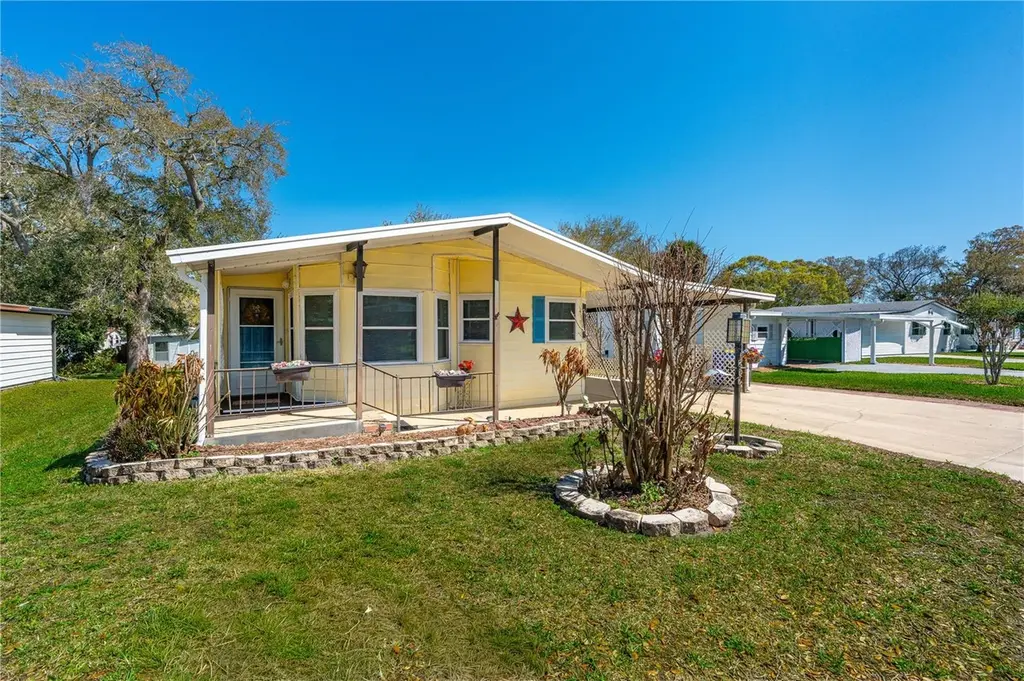
217 Schooner Ave · Edgewater, FL
Flood risk 6/10 · Moderate
- FEMA flood zone
- X (unshaded)
- Chance of flooding over 30 yrs
- 0.54%
- Est. flood insurance / yr
- $507 – $1,088
Fire risk 4/10 · Minor
- Est. fire insurance / yr
- $947 – $1,759
Heat risk 9/10 · Severe
- Hot days now (above 105°F)
- 7 days/yr
- Hot days in 30 yrs
- 21 days/yr
Wind risk 10/10 · Severe
- Chance of severe wind over 30 yrs
- 99.0%
Air-quality risk 2/10 · Minimal
- Unhealthy air days now
- 1 days/yr
- Unhealthy air days in 30 yrs
- 1 days/yr
Risk factors via First Street. Map © Google.
Why this score? — see what drove the D grade
The composite is a weighted blend of 9 inputs, each scored 0–100. Each bar is that input's sub-score; the figure is the points it added to the 100-point composite (weight × sub-score).
- Cash flow +12.4/30.0
- ARV discount +7.5/15.0
- 1% rule +4.1/10.0
- Schools +3.9/10.0
- DSCR +3.7/10.0
- Livability +3.6/5.0
- Rent growth +2.5/5.0
- Condition / age +2.5/5.0
- Appreciation +0.0/10.0
$229,000
🖨 Deal sheet 📄 Offer letter ✓ Due diligence
Listing remarks MLS
One or more photo(s) has been virtually staged. Florida living awaits in this 2-bedroom, 2-bath home with a versatile air conditioned sunroom (flex space)--and best of all, you own the land! Large living room with dining room and eat in kitchen area. Don't forget the bonus ''workshop'' out back with electricity and window unit. Your electric bill will be low because this property includes fully paid for solar panels. Newer windows, water heater, and ac. Walk to the clubhouse, heated pool, hot tub, tennis, bocci, fishing pier. Resident boat access to the Intracoastal. Parking for your boat or RV when available. Low maintenance fees. Move-In Ready. Check this one out!
Key facts
- Bonus workshop
- Resident boat access
- 6,453 sq ft lot
Tags
Neighborhood map
What this means for you Summary
Snapshot
- This is a 2-bed/2.0-bath manufactured listed at $229k.
Deal economics
- At list price, monthly cash flow is $-38 ($-461/yr) — negative.
- To cash-flow at today's rent, offer at most $222k (3.0% below list).
- To meet the 1% rule (rent ≥ 1% of price), the offer needs to be $208k (9.0% below list).
- Recommended offer: $208k (9.0% below list) — sets the bar for 1% rule.
Location & tenants
- Location reads 72/100 on livability (#329 in FL) — a middle-class / working-renter tenant base. Strengths: cost of living A+, housing A+, health & safety A+; Watch: amenities D-, commute F.
- Volusia (suburban): math 44% / reading 49% proficiency, ranked #47 of 73 in FL (top 64%) — families likely to look elsewhere, expect single-tenant / working-renter base with shorter leases.
- Market conditions: 304 active listings in the ZIP; 14 comparable units currently listed for rent nearby; rentals at typical pace (median 24d on market — plan ~3-4 weeks tenant-placement turnaround); 3,402 units permitted in Volusia County in 2024 (681 in 5+ unit buildings).
- This rent runs 39% of the median local income ($64k/yr) — at the standard rent-burdened threshold; future hikes will face affordability resistance.
Forward outlook
- Local home prices are declining (-3.0%/yr); year-one equity from $2k of loan paydown is wiped out by about $7k of value loss. Plan a longer hold.
- Volusia County population projected at +19% by 2050 — long-run rental-demand tailwind backs the buy-and-hold thesis.
Negotiation context
- It's been on market 96 days — a 9% lower offer ($208k) is reasonable based on typical stale-listing flexibility.
- 7 sale attempts since 10y ago with the ask held roughly flat each time — persistent listings suggest the price (not the market) is what's stuck; bring a comps-based counter.
- Current owner paid $130k; list at $229k implies a 76% gain — meaningful room to come down on a strong offer.
Risks & watch-outs
- Climate carrying-cost: major flood risk; severe wind risk, 99% chance of damaging wind over 30y; extreme-heat days projected 7→21/yr by 2055 (HVAC capex compounding) — expect insurance premiums to compound above CPI over the hold.
Questions for the listing agent
- What do current leases actually rent for vs. the listed asking? Can we see a recent rent roll and the last 12 months of T-12 income?
- It's been on market 96 days. Have you received any prior offers? Is the seller open to a 9% concession, seller financing, or rate buy-down credit?
- What does the HOA fee cover, when was the last increase, and are there any pending special assessments or reserve-fund shortfalls?
- Why hasn't it sold? Are there any deal-killer items the seller is aware of (foundation, flood, title, zoning, code violations)?
- Is there a deadline driving the sale (1031 exchange, divorce, estate, relocation)? That informs how much negotiation room exists.
- The area grade is low — what's the realistic commute time and amenity access for the typical tenant pool here? Any planned neighborhood developments (good or bad) we should know about?
- What's the average days-on-market for RENTAL listings here right now (not sales)? A rising rental-DOM trend means longer vacancies and softer asking-rent achievability than the comps imply.
- What's the recent tenant-quality profile in this submarket — average credit score on applications, eviction rate, late-payment / NSF rate, and stable-employment percentage? A property-management company in the area should have these aggregated.
- How much new for-sale + rental construction is in the pipeline within 1–3 miles? Heavy new supply typically softens prices + rents 12–24 months out; constrained supply supports both.
Investment metrics
- 1% rule
- 0.91% ✗
- Cap rate
- 6.09%
- Cash-on-cash
- -0.72%
- DSCR
- 0.97
- GRM
- 9.2
CMA / ARV
No comps found within radius.
Projected returns pro-forma
-3.0% appreciation · 3.0% rent growth · sell at horizon
- IRR
- -17.4%
- Equity multiple
- 0.38×
- Total profit
- $-39,463
- Equity at exit
- $34,145
- IRR
- -9.4%
- Equity multiple
- 0.42×
- Total profit
- $-37,136
- Equity at exit
- $19,800
Cash invested: $64,120 (down + closing). Projections, not guarantees.
Landlord ↔ Tenant lean methodology
- Overall (STATE)
- 87 Strongly Landlord-Friendly
- State Florida
- 87 Strongly Landlord-Friendly · R+3
- County
- — inherits STATE
- City
- — inherits STATE
ZIP-level market 32141
- Home prices YoY
- -19.2%
- Active inventory
- 304
- Price-to-rent
- 9.2×
Monthly cashflow live
- Estimated rent
- $2,083 high interval (Pro) →
- Mortgage (P&I)
- −$1,201
- Tax from tax record
- −$130 /mo · $1,555/yr
- Insurance
- −$95
- HOA
- −$258
- Vacancy / Maint / Mgmt
- −$437
- Net cashflow
- $-38
Break-even live
UW: 25.0% down · 7.5% · 30yr · 1.5% tax · 5.0% vac · 8.0% maint · 8.0% mgmt
Financing live
Cash to close
- Down payment
- $57,250
- Closing costs
- $6,870
- Reserves months
- —
- Total cash needed
- —
Loan-product check · same deal, 3 products live
Conventional
25% down · 7.5% · 30yr
- Down + closing
- —
- Monthly P&I
- —
- Monthly cashflow
- —
- DSCR
- —
- Eligible?
- —
Personal DTI + credit; lowest rate.
DSCR
20% down · 8.5% · 30yr
- Down + closing
- —
- Monthly P&I
- —
- Monthly cashflow
- —
- DSCR
- —
- Eligible?
- —
No personal income docs; deal must DSCR.
Hard money
10% down · 12.0% · 12mo
- Down + closing
- —
- Monthly P&I
- —
- Monthly cashflow
- —
- DSCR
- —
- Eligible?
- —
Short-term bridge; refi at stabilization.
Rent comps 14 comps
| Address | Beds | Baths | Sqft | Rent | $/sqft | DOM | Units | Dist |
|---|---|---|---|---|---|---|---|---|
| 226 Tree Branch Ln Edgewater, FL | 3.0 | 2.0 | 1514 | $2,350 | $1.55 | 14d | 1 | 0.65mi |
| 2515 Fern Palm Dr Edgewater, FL | 3.0 | 2.0 | 1400 | $2,200 | $1.57 | 11d | 1 | 0.70mi |
| 2621 India Palm Dr Edgewater, FL | 3.0 | 2.0 | 1269 | $2,400 | $1.89 | 23d | 1 | 0.76mi |
| 2421 India Palm Dr Edgewater, FL | 3.0 | 2.0 | 1358 | $2,150 | $1.58 | 19d | 1 | 0.89mi |
| 2314 Fern Palm Dr Unit 2314 Edgewater, FL | 2.0 | 2.0 | 1200 | $1,700 | $1.42 | 19d | 1 | 0.91mi |
| 3120 Juniper Dr Edgewater, FL | 3.0 | 2.0 | 1440 | $2,150 | $1.49 | 23d | 1 | 0.95mi |
| 3208 India Palm Dr Edgewater, FL | 2.0 | 2.0 | 990 | $1,550 | $1.57 | 11d | 1 | 0.95mi |
| 1000 Egret Ct Edgewater, FL | 2.0 | 2.0 | 1051 | $2,400 | $2.28 | 23d | 1 | 0.95mi |
| 2330 India Palm Dr Edgewater, FL | 2.0 | 2.0 | 1025 | $1,499 | $1.46 | 14d | 1 | 0.98mi |
| 3318 India Palm Dr Edgewater, FL | 2.0 | 2.0 | 1200 | $1,875 | $1.56 | 23d | 1 | 1.06mi |
| 3119 Mango Tree Dr Edgewater, FL | 3.0 | 2.0 | 1714 | $2,345 | $1.37 | 21d | 1 | 1.06mi |
| 3413 Juniper Dr Edgewater, FL | 2.0 | 1.0 | 1000 | $1,500 | $1.50 | 23d | 1 | 1.16mi |
| 2827 Royal Palm Dr Edgewater, FL | 3.0 | 2.0 | 1212 | $1,900 | $1.57 | 23d | 1 | 1.23mi |
| 3411 Needle Palm Dr Edgewater, FL | 3.0 | 1.0 | 960 | $2,000 | $2.08 | 23d | 1 | 1.32mi |
HOA detail
- Monthly dues
- $258 · $3,096/yr
- Likely covers
- waterelectricpool
Listing history 39 events
-
2026-06-18days on market $229,000 Active 96 DOM
-
2026-06-17days on market $229,000 Active 95 DOM
-
2026-06-16days on market $229,000 Active 94 DOM
-
2026-06-15days on market $229,000 Active 93 DOM
-
2026-06-14days on market $229,000 Active 91 DOM
-
2026-06-10days on market $229,000 Active 88 DOM
-
2026-06-09days on market $229,000 Active 87 DOM
-
2026-06-08days on market $229,000 Active 86 DOM
-
2026-06-07days on market $229,000 Active 85 DOM
-
2026-06-05days on market $229,000 Active 82 DOM
-
2026-06-03days on market $229,000 Active 81 DOM
-
2026-06-03days on market $229,000 Active 80 DOM
-
2026-06-01days on market $229,000 Active 79 DOM
-
2026-05-31days on market $229,000 Active 78 DOM
-
2026-05-31days on market $229,000 Active 77 DOM
-
2026-03-14$229,000 Active 674-char remark
Show marketing remark (674 chars)
One or more photo(s) has been virtually staged. Florida living awaits in this 2-bedroom, 2-bath home with a versatile air conditioned sunroom (flex space)--and best of all, you own the land! Large living room with dining room and eat in kitchen area. Don't forget the bonus ''workshop'' out back with electricity and window unit. Your electric bill will be low because this property includes fully paid for solar panels. Newer windows, water heater, and ac. Walk to the clubhouse, heated pool, hot tub, tennis, bocci, fishing pier. Resident boat access to the Intracoastal. Parking for your boat or RV when available. Low maintenance fees. Move-In Ready. Check this one out!
-
2026-03-11$229,000 Active 626-char remark
Show marketing remark (626 chars)
Florida living awaits in this 2-bedroom, 2-bath home with a versatile air conditioned sunroom (flex space)--and best of all, you own the land! Large living room with dining room and eat in kitchen area. Don't forget the bonus ''workshop'' out back with electricity and window unit. Your electric bill will be low because this property includes fully paid for solar panels. Newer windows, water heater, and ac. Walk to the clubhouse, heated pool, hot tub, tennis, bocci, fishing pier. Resident boat access to the Intracoastal. Parking for your boat or RV when available. Low maintenance fees. Move-In Ready. Check this one out!
-
2026-02-26historical
-
2025-09-17price $238,500
-
2025-03-03$249,900 Active
-
2023-09-15historical
-
2023-04-29price $278,800
-
2022-10-31price $290,000
-
2022-09-28price $295,000
-
2022-09-23$280,000 Active
-
2017-03-08soldstatus $130,000
-
2017-02-07soldstatus $130,000 Closed
-
2017-02-07soldstatus $130,000 Closed
-
2017-02-07soldstatus $130,000
-
2016-12-05historical Contingent
-
2016-12-05historical Contingent
-
2016-11-24price $135,000
-
2016-11-23price $135,000
-
2016-10-21price $139,900
-
2016-10-04price $135,000
-
2016-09-15$139,900 Active
-
2016-09-09$139,900 Active
-
2016-09-08$135,000
-
1996-10-08soldstatus $65,000
ⓘ Source: listings_history table (triggers on properties + properties_extension) + one-shot
backfill from property_details.listing_events for pre-trigger history.
Tax reassessment forecast FL · Resets to sale price
- Current annual tax
- $1,555 · $130/mo
- Projected year-2 tax
- $1,901 · $158/mo
- Expected delta
- +$346/yr (+$29/mo · 22.2%)
ⓘ Screening estimate from a state-policy table — verify with the county assessor before closing.
Climate risk First Street
- Flood 6/10 Major FEMA zone X (unshaded) · 54% chance over 30 yrs
- Wildfire 4/10 Moderate
- Heat 9/10 Extreme 7 d/yr ≥105°F today · 21 d/yr by 30 yrs out
- Wind 10/10 Extreme 99% chance of damaging wind over 30 yrs
- Air quality 2/10 Low 1 unhealthy d/yr today · 1 by 30 yrs out
Nearby sold comps map
Loading sold comps map…
Walkable amenities ~0.75 mi
Loading nearby amenities…
Taxation est. · year 1
- Rental income
- $24,994
- − Mortgage interest
- −$12,828
- − Property taxes
- −$1,555
- − Insurance
- −$1,145
- − Repairs & maintenance
- −$2,000
- − Management
- −$2,000
- − HOA
- −$3,096
- − Depreciation
- −$6,662
- Taxable loss
- −$4,290
- Est. tax savings @ 24.0%
- +$1,030
- After-tax cash flow
- $568/yr
For passive investors: Depreciation is non-cash, so a rental often shows a tax loss while cash-flowing — sheltering income. Rental losses are passive: they offset passive income freely, and up to $25,000/yr can offset ordinary (W-2) income if you actively participate and your MAGI is under $100k (phasing out to $0 by $150k); unused losses carry forward. On sale, claimed depreciation is recaptured at up to 25%, and gains may owe capital-gains tax (a 1031 exchange can defer both). Figures are a year-1 estimate at your 24.0% rate — not tax advice; consult a CPA.
Schools (NCES district)
- District
- Volusia
- NCES district ID
- 1201920
- Math proficiency
- 44% ▼ -9.00%
- Reading proficiency
- 49% ▼ -3.00%
- Median HH income
- $42,946
- Composite
- 39.2/100
- National rank
- #4019
- State rank
- #47 of 73 in FL
Livability — Edgewater
- Score
- 72/100
- State rank
- #329
- US rank
- #5753
Category grades
Schools grade is shown separately in the Schools card above.
Census & demographics
- Census place
- Edgewater, FL
- County
- Volusia County · 556,871 people
- City population
- 18,726
- Metro
- Deltona-Daytona Beach-Ormond Beach, FL
- Population (ZIP)
- 18,726
- Household income
- $63,936
- Rent vs Own
- Severe rent burden
- 161.0
Population outlook (Volusia County) Hauer SSP2
- Today (2025)
- 572,749 people
- By 2030
- 598,695 · +4.5%
- By 2040
- 644,880 · +12.6%
- By 2050
- 681,451 · +19.0%
- By 2075
- 759,957 · +32.7%
- By 2100
- 778,902 · +36.0%
Race, ethnicity, and origin ACS 2023
- Neighborhood character
- Predominantly White (90%)
- Race & ethnicity
- White 90% Hispanic / Latino 4% Two or more races 3% Black 2%
- Common ancestry
- Romanian 6% Lithuanian 2% Slovak 1%
- Foreign-born
- 4% · Canada
- Languages at home
- 94% English-only · Spanish 2% Other Indo-European 2% German/W. Germanic 1%
Political lean MEDSL · Volusia
- 2024 margin
- Strong R (+21.8) · D 38.7% · R 60.5%
- 2008→2024 swing
- -27.4pp toward R · 2008: 5.7pp · 2024: -21.8pp
- All cycles
- 2024: R+21.8 2020: R+14.1 2016: R+13.1 2012: R+1.2 2008: D+5.7
Not yet ingested
- Civics
- —
Market trends
- HPI YoY
- ▼ -80.12%
- Current HPI
- 337.8301
- Rent YoY
- —
- Metro
- Deltona-Daytona Beach-Ormond Beach, FL
- State GDP YoY
- ▲ 3.28%
- F500 in state
- 36
Industry mix (Fortune 500 HQ in FL)
| Industry | F500 HQs | Revenue |
|---|---|---|
| Industrial Technology | 2 | $29B |
|
||
| Insurance | 2 | $17B |
|
||
| Retail | 1 | $60B |
|
||
| Technology Distribution | 1 | $58B |
|
||
| Homebuilding | 1 | $35B |
|
||
| Technology Manufacturing | 1 | $35B |
|
||
Price history
+252.3% since first listed24 events — show timeline
- 2026-03-14 Listed $229,000 Stellar MLS as Distributed by MLS Grid
- 2026-03-11 Listed $229,000 Daytona MLS
- 2026-02-26 Listing Removed — Daytona MLS
- 2025-09-17 Price Changed $238,500 Daytona MLS
- 2025-03-03 Listed $249,900 Daytona MLS
- 2023-09-15 Listing Removed — Daytona MLS
- 2023-04-29 Price Changed $278,800 Daytona MLS
- 2022-10-31 Price Changed $290,000 Daytona MLS
- 2022-09-28 Price Changed $295,000 Daytona MLS
- 2022-09-23 Listed $280,000 Daytona MLS
- 2017-03-08 Sold (Public Records) $130,000 Public Records
- 2017-02-07 Sold (MLS) $130,000 Stellar MLS as Distributed by MLS Grid
- 2017-02-07 Sold (MLS) $130,000 NSBMLS
- 2017-02-07 Sold (MLS) $130,000 Daytona MLS
- 2016-12-05 Contingent — Daytona MLS
- 2016-12-05 Contingent — NSBMLS
- 2016-11-24 Price Changed $135,000 NSBMLS
- 2016-11-23 Price Changed $135,000 Daytona MLS
- 2016-10-21 Price Changed $139,900 NSBMLS
- 2016-10-04 Price Changed $135,000 NSBMLS
- 2016-09-15 Listed $139,900 Daytona MLS
- 2016-09-09 Listed $139,900 NSBMLS
- 2016-09-08 Listed $135,000 Stellar MLS as Distributed by MLS Grid
- 1996-10-08 Sold (Public Records) $65,000 Public Records
Property tax history
+6.9%/yrLatest (2025): $1,555 · +1.2% YoY. Source: county tax records.
Cash-flow waterfall
monthlySold comps — $/sqft
last 12 mo · ≤1 miLoading sold comps…