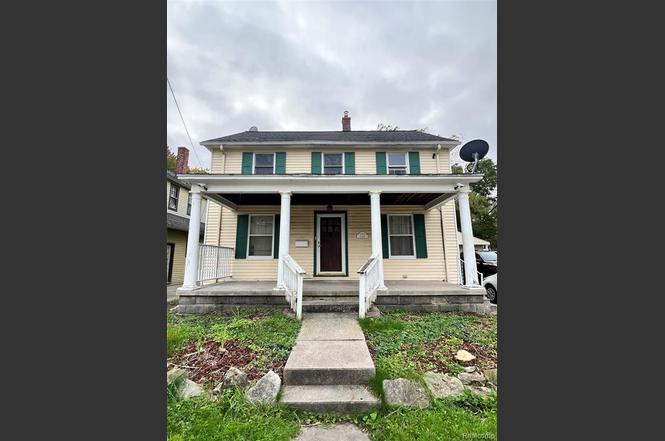
254 Lockwood St · Saginaw, MI
Flood risk 1/10 · Minimal
- FEMA flood zone
- X (unshaded)
- Chance of flooding over 30 yrs
- 0.0%
- Est. flood insurance / yr
- $473 – $860
Fire risk 1/10 · Minimal
- Est. fire insurance / yr
- $784 – $1,456
Heat risk 2/10 · Minimal
- Hot days now (above 99°F)
- 7 days/yr
- Hot days in 30 yrs
- 14 days/yr
Wind risk 1/10 · Minimal
- Chance of severe wind over 30 yrs
- —
Air-quality risk 2/10 · Minimal
- Unhealthy air days now
- 1 days/yr
- Unhealthy air days in 30 yrs
- 2 days/yr
Risk factors via First Street. Map © Google.
Why this score? — see what drove the D grade
The composite is a weighted blend of 9 inputs, each scored 0–100. Each bar is that input's sub-score; the figure is the points it added to the 100-point composite (weight × sub-score).
- Cash flow +19.6/30.0
- 1% rule +6.9/10.0
- DSCR +6.2/10.0
- Rent growth +3.5/5.0
- Livability +3.2/5.0
- Condition / age +2.5/5.0
- Schools +2.0/10.0
- ARV discount +0.0/15.0
- Appreciation +0.0/10.0
$99,000
🖨 Deal sheet 📄 Offer letter ✓ Due diligence
Listing remarks MLS
Landlords/Investors, enjoy the guaranteed rental payments with this Section 8 rental property. This 3-bedroom property has undergone many recent updates. Section 8 pays $1150 directly to the owner. Do Not Disturb tenants! Serious buyers only!
Key facts
- 6,970 sq ft lot
- Built 1929
- Listed 325 days
Property features AI
Exterior
- Parking: No garage
- Utilities: Public water; Public sewer
- Home design: Single-family residence; Two levels; Ground-level entry with steps
- Construction: Vinyl siding
- Exterior features: Paved road access; Lot approximately 0.16 acres (55 x 125)
Interior
- Bathrooms: One full bathroom
- Heating & cooling: Forced air heating (natural gas); No central cooling
- Interior features: Crawl space basement; Five total rooms
Neighborhood map
What this means for you Summary
Snapshot
- This is a 3-bed/1.0-bath single-family listed at $99k.
Deal economics
- At list price, monthly cash flow is $114 ($1k/yr) — positive.
- The deal already cash-flows at list — no discount required.
- Meets the 1% rule at list price ($1k rent vs $99k).
- Recommended offer: $87k (12.0% below list) — sets the bar for market timing.
Location & tenants
- Location reads 63/100 on livability (#521 in MI) — a middle-class / working-renter tenant base. Strengths: cost of living A+, housing A+, health & safety A+; Watch: schools F, crime F, amenities F.
- Saginaw School District (urban): math 20% / reading 29% proficiency, ranked #444 of 540 in MI (top 82%) — low school quality limits family demand, transient renter base, plan for 1-2y turnover; 76% free/reduced lunch — lower-income household profile, screen leases tightly.
- Market conditions: Rents rising (+4.0%/yr); 250 active listings in the ZIP; 1 comparable units currently listed for rent nearby; 154 units permitted in Saginaw County in 2024 (0 in 5+ unit buildings).
- This rent runs 30% of the median local income ($47k/yr) — at the standard rent-burdened threshold; future hikes will face affordability resistance.
Forward outlook
- Local home prices are declining (-3.0%/yr); year-one equity from $684 of loan paydown is wiped out by about $3k of value loss. Plan a longer hold.
- Saginaw County population projected at -25% by 2050 — secular population decline; favor cash flow + early exit over multi-decade hold.
Negotiation context
- It's been on market 326 days — a 12% lower offer ($87k) is reasonable based on typical stale-listing flexibility.
- 15 sale attempts since 26y ago with the ask held roughly flat each time — persistent listings suggest the price (not the market) is what's stuck; bring a comps-based counter.
- Current owner paid $35k; list at $99k implies a 183% gain — meaningful room to come down on a strong offer.
Risks & watch-outs
- Watch-outs: property tax is 3.1% of price; built in 1929 — expect roof / HVAC / electrical / plumbing capex.
Questions for the listing agent
- It's been on market 326 days. Have you received any prior offers? Is the seller open to a 12% concession, seller financing, or rate buy-down credit?
- Built in 1929 — when were the roof, HVAC, electrical panel, plumbing, and water heater last replaced?
- Property tax is high relative to price — has the assessment been appealed recently, and will the sale trigger a re-assessment?
- Why hasn't it sold? Are there any deal-killer items the seller is aware of (foundation, flood, title, zoning, code violations)?
- Is there a deadline driving the sale (1031 exchange, divorce, estate, relocation)? That informs how much negotiation room exists.
- Schools are F-rated, which usually means shorter tenancies and higher turnover. Who's the typical renter profile here, and what's been the actual vacancy rate?
- Crime grade is F in this area — have there been break-ins, vandalism, or insurance claims at this property in the last 3 years? What carrier currently insures it and at what premium?
- The area grade is low — what's the realistic commute time and amenity access for the typical tenant pool here? Any planned neighborhood developments (good or bad) we should know about?
- What's the average days-on-market for RENTAL listings here right now (not sales)? A rising rental-DOM trend means longer vacancies and softer asking-rent achievability than the comps imply.
- What's the recent tenant-quality profile in this submarket — average credit score on applications, eviction rate, late-payment / NSF rate, and stable-employment percentage? A property-management company in the area should have these aggregated.
- How much new for-sale + rental construction is in the pipeline within 1–3 miles? Heavy new supply typically softens prices + rents 12–24 months out; constrained supply supports both.
Investment metrics
- 1% rule
- 1.19% ✓
- Cap rate
- 7.67%
- Cash-on-cash
- 4.92%
- DSCR
- 1.22
- GRM
- 7.0
CMA / ARV
- ARV (on-the-fly)
- $81,360
- Comps found
- 12
Show comp detail 12 sales within ~0.75 mi
| Address | Dist | Beds/Ba | Sqft | Sold | Price | $/sf | Match |
|---|---|---|---|---|---|---|---|
| 278 Wylie St | 0.07mi | 3/1.5 | 1,411 (+4%) | 4mo | $148,000 | $105 | 85 |
| 266 Lockwood St | 0.02mi | 3/2.0 | 1,436 (+6%) | 3mo | $150,000 | $104 | 83 |
| 251 Trier St | 0.08mi | 3/1.5 | 1,262 (-7%) | 2mo | $147,000 | $116 | 81 |
| 1424 Acacia St | 0.21mi | 2/1.0 (-1) | 1,416 (+4%) | 3mo | $66,500 | $47 | 76 |
| 1016 Thurman St | 0.21mi | 3/1.0 | 1,230 (-9%) | 3mo | $69,900 | $57 | 72 |
| 2844 Schemm St | 0.50mi | 3/1.0 | 1,336 (-2%) | 3mo | $40,000 | $30 | 71 |
| 267 Lockwood St | 0.04mi | 3/1.5 | 1,553 (+14%) | 2mo | $116,000 | $75 | 71 |
| 1407 Bay St | 0.36mi | 4/1.5 (+1) | 1,464 (+8%) | 2mo | $142,900 | $98 | 61 |
| 1811 Allegan St | 0.72mi | 3/1.0 | 1,316 (-3%) | 3mo | $70,000 | $53 | 59 |
| 407 S Oakley St | 0.55mi | 3/1.0 | 1,495 (+10%) | 4mo | $58,000 | $39 | 54 |
| 719 S Bond St | 0.65mi | 3/1.0 | 1,191 (-12%) | 0mo | $52,500 | $44 | 49 |
| 1954 Harry St | 0.73mi | 2/2.0 (-1) | 1,505 (+11%) | 2mo | $90,000 | $60 | 37 |
Match score weights: distance 35% · size 25% · config 20% · recency 20%. Top-matched comps best support the ARV.
Projected returns pro-forma
-3.0% appreciation · 3.98% rent growth · sell at horizon
- IRR
- -7.3%
- Equity multiple
- 0.73×
- Total profit
- $-7,526
- Equity at exit
- $14,761
- IRR
- 3.8%
- Equity multiple
- 1.29×
- Total profit
- $8,086
- Equity at exit
- $8,560
Cash invested: $27,720 (down + closing). Projections, not guarantees.
Landlord ↔ Tenant lean methodology
- Overall (STATE)
- 62 Landlord-Friendly
- State Michigan
- 62 Landlord-Friendly · EVEN
- County
- — inherits STATE
- City
- — inherits STATE
ZIP-level market 48602
- Home prices YoY
- -19.7%
- Rents YoY
- 4.0%
- Active inventory
- 250
- Price-to-rent
- 7.0×
Monthly cashflow live
- Estimated rent
- $1,178 medium interval (Pro) →
- Mortgage (P&I)
- −$519
- Tax from tax record
- −$256 /mo · $3,076/yr
- Insurance
- −$41
- HOA
- −$0
- Vacancy / Maint / Mgmt
- −$247
- Net cashflow
- $114
Break-even live
UW: 25.0% down · 7.5% · 30yr · 1.5% tax · 5.0% vac · 8.0% maint · 8.0% mgmt
Financing live
Cash to close
- Down payment
- $24,750
- Closing costs
- $2,970
- Reserves months
- —
- Total cash needed
- —
Loan-product check · same deal, 3 products live
Conventional
25% down · 7.5% · 30yr
- Down + closing
- —
- Monthly P&I
- —
- Monthly cashflow
- —
- DSCR
- —
- Eligible?
- —
Personal DTI + credit; lowest rate.
DSCR
20% down · 8.5% · 30yr
- Down + closing
- —
- Monthly P&I
- —
- Monthly cashflow
- —
- DSCR
- —
- Eligible?
- —
No personal income docs; deal must DSCR.
Hard money
10% down · 12.0% · 12mo
- Down + closing
- —
- Monthly P&I
- —
- Monthly cashflow
- —
- DSCR
- —
- Eligible?
- —
Short-term bridge; refi at stabilization.
Rent comps 1 comps
| Address | Beds | Baths | Sqft | Rent | $/sqft | DOM | Units | Dist |
|---|---|---|---|---|---|---|---|---|
| 4156 Ann St Saginaw, MI | 4.0 | 1.5 | 1387 | $1,225 | $0.88 | 43d | 1 | 1.35mi |
Listing history 50 events
-
2026-06-19days on market $99,000 Active 326 DOM
-
2026-06-18days on market $99,000 Active 325 DOM
-
2026-06-17days on market $99,000 Active 324 DOM
-
2026-06-16days on market $99,000 Active 323 DOM
-
2026-06-15days on market $99,000 Active 322 DOM
-
2026-06-14days on market $99,000 Active 320 DOM
-
2026-06-12days on market $99,000 Active 319 DOM
-
2026-06-09days on market $99,000 Active 316 DOM
-
2026-06-08days on market $99,000 Active 315 DOM
-
2026-06-07days on market $99,000 Active 314 DOM
-
2026-06-05days on market $99,000 Active 311 DOM
-
2026-06-03days on market $99,000 Active 310 DOM
-
2026-06-02days on market $99,000 Active 309 DOM
-
2026-06-01days on market $99,000 Active 308 DOM
-
2026-05-31days on market $99,000 Active 307 DOM
-
2026-05-30days on market $99,000 Active 306 DOM
-
2025-07-28$99,000 Active
Show marketing remark (242 chars)
Landlords/Investors, enjoy the guaranteed rental payments with this Section 8 rental property. This 3-bedroom property has undergone many recent updates. Section 8 pays $1150 directly to the owner. Do Not Disturb tenants! Serious buyers only!
-
2025-07-28$99,000 Active 242-char remark
Show marketing remark (242 chars)
Landlords/Investors, enjoy the guaranteed rental payments with this Section 8 rental property. This 3-bedroom property has undergone many recent updates. Section 8 pays $1150 directly to the owner. Do Not Disturb tenants! Serious buyers only!
-
2021-12-02soldstatus $35,000 Sold 56-char remark
Show marketing remark (56 chars)
Package deal of properties 8 properties. Rental property
-
2021-12-02soldstatus $35,000 Closed
Show marketing remark (56 chars)
Package deal of properties 8 properties. Rental property
-
2021-12-02soldstatus $280,000
Show marketing remark (56 chars)
Package deal of properties 8 properties. Rental property
-
2021-12-01historical 56-char remark
Show marketing remark (56 chars)
Package deal of properties 8 properties. Rental property
-
2021-12-01historical
Show marketing remark (56 chars)
Package deal of properties 8 properties. Rental property
-
2021-11-30$35,000 56-char remark
Show marketing remark (56 chars)
Package deal of properties 8 properties. Rental property
-
2021-11-30$35,000
Show marketing remark (56 chars)
Package deal of properties 8 properties. Rental property
-
2012-06-29soldstatus $40,000
-
2012-06-29soldstatus $40,000
-
2012-06-27historical
-
2010-04-19$45,000
-
2010-04-19$45,000
-
2009-03-09historical
-
2009-03-09historical
-
2008-01-02$89,900
-
2008-01-02$89,900
-
2007-11-18historical
-
2007-11-18historical
-
2007-05-18$99,900
-
2007-05-18$99,900
-
2007-05-07historical
-
2007-05-07historical
-
2006-06-01$109,900
-
2006-06-01$109,900
-
2003-08-15soldstatus $112,900
-
2003-06-27soldstatus $112,900
-
2003-06-27soldstatus $112,900
-
2003-05-19historical
-
2003-05-02$114,900
-
2003-05-02$114,900
-
2000-05-26soldstatus $102,900
-
2000-05-19soldstatus $102,900
ⓘ Source: listings_history table (triggers on properties + properties_extension) + one-shot
backfill from property_details.listing_events for pre-trigger history.
Tax reassessment forecast MI · Partial reset (capped growth)
- Current annual tax
- $3,076 · $256/mo
- Projected year-2 tax
- $3,076 · $256/mo
- Expected delta
- $0/yr ($0/mo · 0.0%)
ⓘ Screening estimate from a state-policy table — verify with the county assessor before closing.
Climate risk First Street
- Flood 1/10 Low FEMA zone X (unshaded) · 0% chance over 30 yrs
- Wildfire 1/10 Low
- Heat 2/10 Low 7 d/yr ≥99°F today · 14 d/yr by 30 yrs out
- Wind 1/10 Low
- Air quality 2/10 Low 1 unhealthy d/yr today · 2 by 30 yrs out
Nearby sold comps map
Loading sold comps map…
Walkable amenities ~0.75 mi
Loading nearby amenities…
Taxation est. · year 1
- Rental income
- $14,134
- − Mortgage interest
- −$5,546
- − Property taxes
- −$3,076
- − Insurance
- −$495
- − Repairs & maintenance
- −$1,131
- − Management
- −$1,131
- − Depreciation
- −$2,880
- Taxable loss
- −$124
- Est. tax savings @ 24.0%
- +$30
- After-tax cash flow
- $1,395/yr
For passive investors: Depreciation is non-cash, so a rental often shows a tax loss while cash-flowing — sheltering income. Rental losses are passive: they offset passive income freely, and up to $25,000/yr can offset ordinary (W-2) income if you actively participate and your MAGI is under $100k (phasing out to $0 by $150k); unused losses carry forward. On sale, claimed depreciation is recaptured at up to 25%, and gains may owe capital-gains tax (a 1031 exchange can defer both). Figures are a year-1 estimate at your 24.0% rate — not tax advice; consult a CPA.
Schools (NCES district)
- District
- Saginaw School District
- NCES district ID
- 2630390
- Math proficiency
- 20% ▼ -5.00%
- Reading proficiency
- 29% ▼ -3.00%
- Median HH income
- $28,940
- Composite
- 19.6/100
- National rank
- #8755
- State rank
- #444 of 540 in MI
Livability — Saginaw
- Score
- 63/100
- State rank
- #521
- US rank
- #15424
Category grades
Schools grade is shown separately in the Schools card above.
Census & demographics
- Census place
- Saginaw, MI
- County
- Saginaw County · 54,884 people
- City population
- 54,884
- Metro
- Saginaw, MI
- Population (ZIP)
- 27,127
- Household income
- $46,984
- Rent vs Own
- Severe rent burden
- 1416.0
Population outlook (Saginaw County) Hauer SSP2
- Today (2025)
- 180,568 people
- By 2030
- 172,302 · -4.6%
- By 2040
- 153,919 · -14.8%
- By 2050
- 135,519 · -24.9%
- By 2075
- 97,199 · -46.2%
- By 2100
- 65,037 · -64.0%
Race, ethnicity, and origin ACS 2023
- Neighborhood character
- Diverse neighborhood (Simpson 0.64)
- Race & ethnicity
- White 50% Black 27% Hispanic / Latino 17% Two or more races 12%
- Hispanic origin (detail)
- Mexican 14% Puerto Rican 1%
- Common ancestry
- Romanian 4% Lithuanian 3% Italian 2%
- Foreign-born
- 1% · Canada
- Languages at home
- 96% English-only · Spanish 3%
Political lean MEDSL · Saginaw
- 2024 margin
- Toss-up / Even · D 47.7% · R 51.0% · Other 1.4%
- 2008→2024 swing
- -20.6pp toward R · 2008: 17.3pp · 2024: -3.3pp
- All cycles
- 2024: R+3.3 2020: D+0.3 2016: R+1.1 2012: D+11.9 2008: D+17.3
Not yet ingested
- Civics
- —
Market trends
- HPI YoY
- ▼ -39.15%
- Current HPI
- 159.8807
- Rent YoY
- ▲ 3.98%
- Metro
- Saginaw, MI
- State GDP YoY
- ▲ 1.37%
- F500 in state
- 28
Industry mix (Fortune 500 HQ in MI)
| Industry | F500 HQs | Revenue |
|---|---|---|
| Automotive Parts | 3 | $48B |
|
||
| Automotive | 2 | $372B |
|
||
| Chemicals | 1 | $45B |
|
||
| Automotive Retail | 1 | $29B |
|
||
| Healthcare / Medical Devices | 1 | $23B |
|
||
| Automotive Technology | 1 | $20B |
|
||
Price history
-9.9% since first listed36 events — show timeline
- 2025-07-28 Listed $99,000 REALCOMP
- 2025-07-28 Listed $99,000 MiRealSource-MiMLS
- 2021-12-02 Sold (Public Records) $280,000 Public Records
- 2021-12-02 Sold (MLS) $35,000 MiRealSource-MiMLS
- 2021-12-02 Sold (MLS) $35,000 REALCOMP
- 2021-12-01 Listing Removed — MiRealSource-MiMLS
- 2021-12-01 Listing Removed — REALCOMP
- 2021-11-30 Listed $35,000 MiRealSource-MiMLS
- 2021-11-30 Listed $35,000 REALCOMP
- 2012-06-29 Sold (MLS) $40,000 REALCOMP
- 2012-06-29 Sold (MLS) $40,000 MiRealSource-MiMLS
- 2012-06-27 Listing Removed — MiRealSource-MiMLS
- 2010-04-19 Listed $45,000 REALCOMP
- 2010-04-19 Listed $45,000 MiRealSource-MiMLS
- 2009-03-09 Listing Removed — MiRealSource-MiMLS
- 2009-03-09 Listing Removed — REALCOMP
- 2008-01-02 Listed $89,900 MiRealSource-MiMLS
- 2008-01-02 Listed $89,900 REALCOMP
- 2007-11-18 Listing Removed — MiRealSource-MiMLS
- 2007-11-18 Listing Removed — REALCOMP
- 2007-05-18 Listed $99,900 MiRealSource-MiMLS
- 2007-05-18 Listed $99,900 REALCOMP
- 2007-05-07 Listing Removed — MiRealSource-MiMLS
- 2007-05-07 Listing Removed — REALCOMP
- 2006-06-01 Listed $109,900 MiRealSource-MiMLS
- 2006-06-01 Listed $109,900 REALCOMP
- 2003-08-15 Sold (Public Records) $112,900 Public Records
- 2003-06-27 Sold (MLS) $112,900 REALCOMP
- 2003-06-27 Sold (MLS) $112,900 MiRealSource-MiMLS
- 2003-05-19 Listing Removed — MiRealSource-MiMLS
- 2003-05-02 Listed $114,900 REALCOMP
- 2003-05-02 Listed $114,900 MiRealSource-MiMLS
- 2000-05-26 Sold (Public Records) $102,900 Public Records
- 2000-05-19 Sold (MLS) $102,900 MiRealSource-MiMLS
- 2000-04-13 Listing Removed — MiRealSource-MiMLS
- 2000-03-13 Listed $109,900 MiRealSource-MiMLS
Property tax history
+3.3%/yrLatest (2025): $3,076 · -16.3% YoY. Source: county tax records.
Cash-flow waterfall
monthlySold comps — $/sqft
last 12 mo · ≤1 miLoading sold comps…