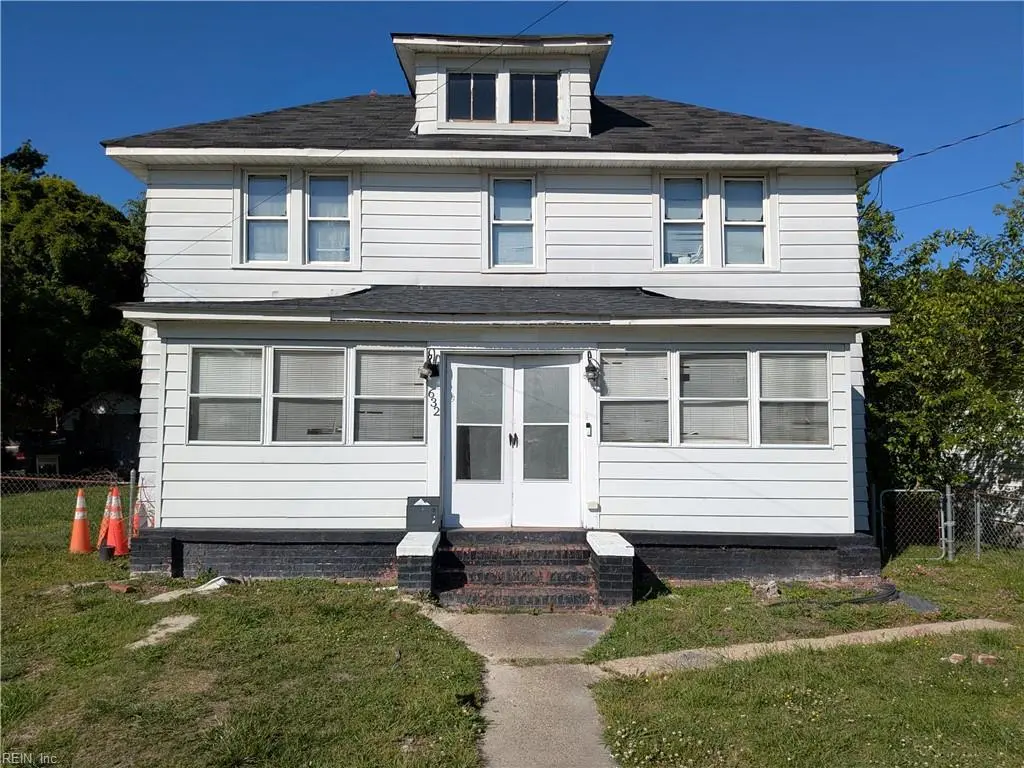
632 Rolfe St · Hampton, VA
Flood risk 4/10 · Minor
- FEMA flood zone
- X (unshaded)
- Chance of flooding over 30 yrs
- 0.13%
- Est. flood insurance / yr
- $473 – $860
Fire risk 1/10 · Minimal
- Est. fire insurance / yr
- $666 – $1,236
Heat risk 9/10 · Severe
- Hot days now (above 105°F)
- 7 days/yr
- Hot days in 30 yrs
- 16 days/yr
Wind risk 8/10 · Major
- Chance of severe wind over 30 yrs
- 80.0%
Air-quality risk 2/10 · Minimal
- Unhealthy air days now
- 1 days/yr
- Unhealthy air days in 30 yrs
- 1 days/yr
Risk factors via First Street. Map © Google.
Why this score? — see what drove the C grade
The composite is a weighted blend of 9 inputs, each scored 0–100. Each bar is that input's sub-score; the figure is the points it added to the 100-point composite (weight × sub-score).
- Cash flow +17.6/30.0
- ARV discount +15.0/15.0
- DSCR +5.5/10.0
- Schools +5.5/10.0
- Rent growth +5.0/5.0
- 1% rule +4.1/10.0
- Livability +3.8/5.0
- Condition / age +2.5/5.0
- Appreciation +0.0/10.0
$219,900
🖨 Deal sheet (PDF) 📄 Offer letter ✓ Due diligence
Listing remarks
Excellent opportunity for investors or renovation buyers awaits with this 4-bedroom, 2-bath home located in the Garden City area of Hampton. Situated on a 3-lot package to be sold together, this property offers endless potential for investors, renovators, or buyers looking to customize a home to their vision. Features include an enclosed porch, spacious living areas, and a generously sized yard ideal for entertaining. Detached garage offers additional possibilities for renovation or redevelopment. Property is being sold strictly AS-IS, with some upgrades uncompleted, and seller will make no repairs. Conveniently located just minutes from bases, Interstate 64, shopping, dining, and local ame
Key facts
- Enclosed porch
- Conveniently located
- Detached garage
Tags
Property features AI
Finance
- HOA & community: No HOA
Exterior
- Parking: 3 off-street parking spaces; Street parking available
- Utilities: City water; City sewer; Electric water heater; Electric power
- Home design: Detached Colonial; 2 stories; Two living levels; Simple ownership
- Construction: Asphalt shingle roof; Crawl foundation
- Exterior features: Aluminum siding; Back yard with chain-link fence; Storage shed; City view
Interior
- Kitchen: Electric range; Dishwasher; Refrigerator
- Bedrooms: Bedroom and full bathroom on first floor
- Flooring: Laminate flooring; Vinyl flooring
- Bathrooms: 2 full bathrooms
- Heating & cooling: Electric heating; Other cooling
- Interior features: Cable hookup; Ceiling fan; Attic; Porch; Fixer upper
- Laundry & utility: Washer hookup; Dryer hookup
Neighborhood map
What this means for you Summary
Snapshot
- This is a 3-bed/1.0-bath single-family listed at $220k.
Deal economics
- At list price, monthly cash flow is $172 ($2k/yr) — positive.
- The deal already cash-flows at list — no discount required.
- To meet the 1% rule (rent ≥ 1% of price), the offer needs to be $200k (9.0% below list).
- Recommended offer: $200k (9.0% below list) — sets the bar for 1% rule.
- Cap rate 7.2% vs local median 4.5% in Hampton — top-decile yield for the area; either an underpriced asset or a hidden risk that comps aren't pricing in. Stress-test before assuming the spread holds.
Location & tenants
- Location reads 75/100 on livability (#133 in VA, #4,302 nationally) — a middle-class / working-renter tenant base. Strengths: housing A+, health & safety A+, cost of living A; Watch: crime C-, amenities D+, commute F.
- Hampton City Public School District (urban): math 60% / reading 70% proficiency, ranked #40 of 131 in VA (top 30%) — acceptable for families but not a draw, mixed tenant base, ~2y average lease.
- Zoned schools: A.W.E. Bassette Elementary (math 32% / reading 47%, grade F, #900 of 1,108 statewide, top 83%, 494 students, 87% FRL); Hampton High (math 60% / reading 75%, grade B, #183 of 319 statewide, top 58%, 1,359 students, 86% FRL) — zoned schools average 86% FRL vs 49% district-wide (37 pts higher); higher-poverty schools than district average — tighter screening recommended.
- Market conditions: Rents rising fast (+21.4%/yr); 123 active listings in the ZIP; 23 comparable units currently listed for rent nearby; rentals at typical pace (median 16d on market — plan ~3-4 weeks tenant-placement turnaround); 68 units permitted in Hampton city in 2024 (0 in 5+ unit buildings).
Forward outlook
- Local home prices are declining (-3.0%/yr); year-one equity from $2k of loan paydown is wiped out by about $7k of value loss. Plan a longer hold.
- Hampton County population projected at -13% by 2050 — secular population decline; favor cash flow + early exit over multi-decade hold.
- At projected returns (-3.0% appreciation + 8.0% rent growth), your $62k cash investment doubles in ~10 years — after that, you're playing with house money.
Negotiation context
- It's been on market 20 days — a 2% lower offer ($217k) is reasonable based on typical stale-listing flexibility.
- 3 sale attempts since 4y ago with the ask held roughly flat each time — persistent listings suggest the price (not the market) is what's stuck; bring a comps-based counter.
- Current owner paid $1k; list at $220k implies a 21890% gain — meaningful room to come down on a strong offer.
Risks & watch-outs
- Watch-outs: built in 1919 — expect roof / HVAC / electrical / plumbing capex.
- Climate carrying-cost: severe wind risk, 80% chance of damaging wind over 30y; extreme-heat days projected 7→16/yr by 2055 (HVAC capex compounding) — expect insurance premiums to compound above CPI over the hold.
Questions for the listing agent
- Built in 1919 — when were the roof, HVAC, electrical panel, plumbing, and water heater last replaced?
- Is there a deadline driving the sale (1031 exchange, divorce, estate, relocation)? That informs how much negotiation room exists.
- Schools are B-rated — typically a magnet for longer-tenancy family renters. What's the average tenant stay here, and is there a school-zone premium baked into asking?
- What's the average days-on-market for RENTAL listings here right now (not sales)? A rising rental-DOM trend means longer vacancies and softer asking-rent achievability than the comps imply.
- What's the recent tenant-quality profile in this submarket — average credit score on applications, eviction rate, late-payment / NSF rate, and stable-employment percentage? A property-management company in the area should have these aggregated.
- How much new for-sale + rental construction is in the pipeline within 1–3 miles? Heavy new supply typically softens prices + rents 12–24 months out; constrained supply supports both.
Investment metrics
- 1% rule
- 0.91% ✗
- Cap rate
- 7.23%
- Cash-on-cash
- 3.36%
- DSCR
- 1.15
- GRM
- 9.2
CMA / ARV
- ARV (median comp)
- $284,000
- List price
- $219,900
- Delta
- -22.57%
- Verdict
- UNDERPRICED
- Comps
- 20 within 1.0 mi
Show comp detail 12 sales within ~0.75 mi
| Address | Dist | Beds/Ba | Sqft | Sold | Price | $/sf | Match |
|---|---|---|---|---|---|---|---|
| 1913 Bay Ave | 0.40mi | 3/1.0 | 1,667 (+6%) | 4mo | $140,000 | $84 | 68 |
| 2609 Victoria Blvd | 0.23mi | 3/1.5 | 1,420 (-9%) | 5mo | $220,000 | $155 | 68 |
| 610 Delaware Ave | 0.31mi | 4/2.0 (+1) | 1,489 (-5%) | 4mo | $260,000 | $175 | 65 |
| 2709 Verell St | 0.42mi | 2/1.0 (-1) | 1,461 (-7%) | 2mo | $165,000 | $113 | 63 |
| 15 Phenix Ct | 0.71mi | 3/1.5 | 1,595 (+2%) | 4mo | $245,000 | $154 | 58 |
| 409 Glendale Rd | 0.63mi | 4/2.0 (+1) | 1,600 (+2%) | 4mo | $290,000 | $181 | 54 |
| 1714 Victoria Blvd | 0.51mi | 4/2.0 (+1) | 1,702 (+8%) | 3mo | $100,000 | $59 | 50 |
| 421 Glendale Rd | 0.65mi | 3/2.0 | 1,440 (-8%) | 4mo | $280,000 | $194 | 49 |
| 690 Greenbriar Ave | 0.67mi | 3/1.5 | 1,426 (-9%) | 4mo | $175,000 | $123 | 48 |
| 221 Prince George Dr | 0.68mi | 4/1.5 (+1) | 1,438 (-8%) | 4mo | $228,000 | $159 | 44 |
| 7 Suburban Pkwy | 0.68mi | 3/2.0 | 1,748 (+12%) | 3mo | $299,900 | $172 | 42 |
| 107 Hill St | 0.70mi | 4/1.0 (+1) | 1,746 (+11%) | 2mo | $169,700 | $97 | 42 |
Match score weights: distance 35% · size 25% · config 20% · recency 20%. Top-matched comps best support the ARV.
Projected returns pro-forma
-3.0% appreciation · 8.0% rent growth · sell at horizon
- IRR
- -5.9%
- Equity multiple
- 0.77×
- Total profit
- $-14,129
- Equity at exit
- $32,788
- IRR
- 8.7%
- Equity multiple
- 1.81×
- Total profit
- $49,806
- Equity at exit
- $19,013
Cash invested: $61,572 (down + closing). Projections, not guarantees.
Landlord ↔ Tenant lean methodology
- Overall (STATE)
- 55 Moderately Landlord-Leaning
- State Virginia
- 55 Moderately Landlord-Leaning · D+2
- County
- — inherits STATE
- City
- — inherits STATE
ZIP-level market 23661
- Home prices YoY
- -16.7%
- Rents YoY
- 21.4%
- Active inventory
- 123
- Price-to-rent
- 9.2×
Monthly cashflow live
- Estimated rent
- $2,002 high interval (Pro) →
- Mortgage (P&I)
- −$1,153
- Tax from tax record
- −$164 /mo · $1,971/yr
- Insurance
- −$92
- HOA
- −$0
- Vacancy / Maint / Mgmt
- −$420
- Net cashflow
- $172
Break-even live
Sensitivity live
| Price | -10% $297 | -5% $234 | +0% $172 | +5% $110 | +10% $48 |
|---|---|---|---|---|---|
| Rent | -10% $14 | -5% $93 | +0% $172 | +5% $251 | +10% $330 |
| Rate | -1.0pp $283 | -0.5pp $228 | base $172 | +0.5pp $115 | +1.0pp $57 |
UW: 25.0% down · 7.5% · 30yr · 1.5% tax · 5.0% vac · 8.0% maint · 8.0% mgmt
Financing live
Cash to close
- Down payment
- $54,975
- Closing costs
- $6,597
- Reserves months
- —
- Total cash needed
- —
Loan-product check · same deal, 3 products live
Conventional
25% down · 7.5% · 30yr
- Down + closing
- —
- Monthly P&I
- —
- Monthly cashflow
- —
- DSCR
- —
- Eligible?
- —
Personal DTI + credit; lowest rate.
DSCR
20% down · 8.5% · 30yr
- Down + closing
- —
- Monthly P&I
- —
- Monthly cashflow
- —
- DSCR
- —
- Eligible?
- —
No personal income docs; deal must DSCR.
Hard money
10% down · 12.0% · 12mo
- Down + closing
- —
- Monthly P&I
- —
- Monthly cashflow
- —
- DSCR
- —
- Eligible?
- —
Short-term bridge; refi at stabilization.
Rent comps 23 comps
| Address | Beds | Baths | Sqft | Rent | $/sqft | DOM | Units | Dist |
|---|---|---|---|---|---|---|---|---|
| 640 Rolfe St Hampton, VA | 3.0 | 2.0 | 1100 | $2,000 | $1.82 | 44d | 1 | 0.02mi |
| 613 Delaware Ave Hampton, VA | 3.0 | 2.0 | 1082 | $1,900 | $1.76 | 3d | 1 | 0.32mi |
| 707 Pennsylvania Ave Hampton, VA | 4.0 | 2.5 | 2134 | $2,800 | $1.31 | 24d | 1 | 0.33mi |
| 236 Pocahontas Pl Hampton, VA | 2.0 | 1.0 | 1262 | $1,795 | $1.42 | 2d | 1 | 0.40mi |
| 130 Pocahontas Pl Hampton, VA | 3.0 | 1.0 | 1415 | $1,695 | $1.20 | 44d | 1 | 0.59mi |
| 130 Chancellor Rd Hampton, VA | 4.0 | 1.0 | 2000 | $1,995 | $1.00 | 5d | 1 | 0.64mi |
| 100 Chesterfield Rd Hampton, VA | 3.0 | 1.5 | 1742 | $2,200 | $1.26 | 5d | 1 | 0.77mi |
| 702 Rutherford St Hampton, VA | 3.0 | 2.0 | 1445 | $1,795 | $1.24 | 24d | 1 | 0.92mi |
| 633 Hemlock Ave Hampton, VA | 3.0 | 1.0 | 1056 | $1,757 | $1.66 | 12d | 1 | 0.95mi |
| 101 Prince James Dr Hampton, VA | 3.0 | 1.0 | 1766 | $1,645 | $0.93 | 15d | 1 | 0.95mi |
| 327 Locust Ave Hampton, VA | 4.0 | 2.0 | 1500 | $2,000 | $1.33 | 44d | 1 | 0.98mi |
| 104 Greenbriar Ave Hampton, VA | 2.0 | 1.0 | 1146 | $1,390 | $1.21 | 13d | 1 | 0.99mi |
| 426 Seminole Rd Hampton, VA | 4.0 | 2.5 | 2200 | $2,450 | $1.11 | 15d | 1 | 1.00mi |
| 708 Westwood Ave Hampton, VA | 3.0 | 2.5 | 1300 | $2,300 | $1.77 | 15d | 1 | 1.06mi |
| 63 Algonquin Rd Hampton, VA | 2.0 | 1.0 | 1100 | $1,495 | $1.36 | 44d | 1 | 1.07mi |
| 7 Briar Dr Hampton, VA | 3.0 | 1.5 | 1626 | $1,850 | $1.14 | 15d | 1 | 1.20mi |
| 534 Brightwood Ave Hampton, VA | 3.0 | 3.0 | 1528 | $2,095 | $1.37 | 44d | 1 | 1.27mi |
| 729 Chesapeake Ave Hampton, VA | 4.0 | 3.0 | 2239 | $2,975 | $1.33 | 3d | 1 | 1.27mi |
| 321 Pine Ave Newport News, VA | 3.0 | 2.5 | 1349 | $1,990 | $1.48 | 24d | 1 | 1.31mi |
| 310 Lasalle Ave Hampton, VA | 3.0 | 2.0 | 1858 | $2,200 | $1.18 | 44d | 1 | 1.31mi |
| 233 Pine Ave Newport News, VA | 3.0 | 2.0 | 1213 | $2,100 | $1.73 | 24d | 1 | 1.33mi |
| 3750 Kecoughtan Rd Hampton, VA | 2.0 | 1.5 | 1300 | $1,600 | $1.23 | 44d | 1 | 1.40mi |
| 1587 Briarfield Rd Hampton, VA | 2.0–3.0 | 1.5–2.0 | 985 | $1,495 | $1.52 | 3d | 9 | 1.46mi |
Listing history 14 events
-
2026-06-07status $219,900 Under Contract 20 DOM
-
2026-06-03days on market $219,900 Active Under Contract 20 DOM
-
2026-06-02days on market $219,900 Active Under Contract 19 DOM
-
2026-06-01days on market $219,900 Active Under Contract 18 DOM
-
2026-05-31days on market $219,900 Active Under Contract 17 DOM
-
2026-05-14$219,900 Active 736-char remark
-
2022-10-13status Under Contract
-
2022-10-05historical Active Under Contract
-
2022-10-05historical
-
2022-08-25status Active
-
2022-08-19status Under Contract
-
2022-08-03price $170,000
-
2022-07-24$180,000 Active
-
1951-05-01soldstatus $1,000
ⓘ Source: listings_history table (triggers on properties + properties_extension) + one-shot
backfill from property_details.listing_events for pre-trigger history.
Tax reassessment forecast VA · Resets to sale price
- Current annual tax
- $1,971 · $164/mo
- Projected year-2 tax
- $1,971 · $164/mo
- Expected delta
- $0/yr ($0/mo · -0.0%)
ⓘ Screening estimate from a state-policy table — verify with the county assessor before closing.
Climate risk First Street
- Flood 4/10 Moderate FEMA zone X (unshaded) · 13% chance over 30 yrs
- Wildfire 1/10 Low
- Heat 9/10 Extreme 7 d/yr ≥105°F today · 16 d/yr by 30 yrs out
- Wind 8/10 Severe 80% chance of damaging wind over 30 yrs
- Air quality 2/10 Low 1 unhealthy d/yr today · 1 by 30 yrs out
Nearby sold comps map
Loading sold comps map…
Walkable amenities ~0.75 mi
Loading nearby amenities…
Taxation est. · year 1
- Rental income
- $24,018
- − Mortgage interest
- −$12,318
- − Property taxes
- −$1,971
- − Insurance
- −$1,100
- − Repairs & maintenance
- −$1,921
- − Management
- −$1,921
- − Depreciation
- −$6,397
- Taxable loss
- −$1,610
- Est. tax savings @ 24.0%
- +$386
- After-tax cash flow
- $2,452/yr
For passive investors: Depreciation is non-cash, so a rental often shows a tax loss while cash-flowing — sheltering income. Rental losses are passive: they offset passive income freely, and up to $25,000/yr can offset ordinary (W-2) income if you actively participate and your MAGI is under $100k (phasing out to $0 by $150k); unused losses carry forward. On sale, claimed depreciation is recaptured at up to 25%, and gains may owe capital-gains tax (a 1031 exchange can defer both). Figures are a year-1 estimate at your 24.0% rate — not tax advice; consult a CPA.
Schools (NCES district)
- District
- Hampton City Public School District
- NCES district ID
- 5101800
- Math proficiency
- 60% ▼ -21.00%
- Reading proficiency
- 70% ▼ -4.00%
- Median HH income
- $50,089
- Composite
- 55.19/100
- National rank
- #1272
- State rank
- #40 of 131 in VA
Livability — Hampton
- Score
- 75/100
- State rank
- #133
- US rank
- #4302
Category grades
Schools grade is shown separately in the Schools card above.
Census & demographics
- Census place
- Hampton, VA
- County
- Hampton City · 132,421 people
- City population
- 132,421
- Metro
- Virginia Beach-Norfolk-Newport News, VA-NC
- Population (ZIP)
- 14,005
- Household income
- $65,446
- Rent vs Own
- Severe rent burden
- 704.0
Population outlook (Hampton County) Hauer SSP2
- Today (2025)
- 134,055 people
- By 2030
- 131,753 · -1.7%
- By 2040
- 125,017 · -6.7%
- By 2050
- 116,825 · -12.9%
- By 2075
- 97,033 · -27.6%
- By 2100
- 76,188 · -43.2%
Race, ethnicity, and origin ACS 2023
- Neighborhood character
- Diverse neighborhood (Simpson 0.56)
- Race & ethnicity
- Black 59% White 31% Two or more races 6% Hispanic / Latino 4%
- Common ancestry
- Serbian 2% Italian 2% Romanian 1%
- Foreign-born
- 3% · Canada
- Languages at home
- 95% English-only · Spanish 2% French/Haitian/Cajun 1% Arabic 1%
Political lean MEDSL · Hampton
- 2024 margin
- Solid D (+39.9) · D 69.2% · R 29.4% · Other 1.4%
- 2008→2024 swing
- +1.0pp no change · 2008: 38.9pp · 2024: 39.9pp
- All cycles
- 2024: D+39.9 2020: D+42.2 2016: D+37.8 2012: D+45.4 2008: D+38.9
Not yet ingested
- Civics
- —
Market trends
- HPI YoY
- ▼ -54.95%
- Current HPI
- 274.2769
- Rent YoY
- ▲ 21.35%
- Metro
- Virginia Beach-Norfolk-Newport News, VA-NC
- State GDP YoY
- ▲ 2.40%
- F500 in state
- 50
Industry mix (Fortune 500 HQ in VA)
| Industry | F500 HQs | Revenue |
|---|---|---|
| Aerospace / Defense | 4 | $236B |
|
||
| Technology / Defense | 3 | $32B |
|
||
| Financial Services | 2 | $176B |
|
||
| Utilities | 2 | $27B |
|
||
| Insurance | 2 | $25B |
|
||
| Technology | 2 | $15B |
|
||
Price history
+21890.0% since first listed11 events — show timeline
- 2026-06-03 Pending — REINMLS
- 2026-05-27 Contingent — REINMLS
- 2026-05-14 Listed $219,900 REINMLS
- 2022-10-13 Pending — REINMLS
- 2022-10-05 Contingent — REINMLS
- 2022-10-05 Listing Removed — REINMLS
- 2022-08-25 Relisted — REINMLS
- 2022-08-19 Pending — REINMLS
- 2022-08-03 Price Changed $170,000 REINMLS
- 2022-07-24 Listed $180,000 REINMLS
- 1951-05-01 Sold (Public Records) $1,000 Public Records
Property tax history
+8.8%/yrLatest (2025): $1,971 · +5.7% YoY. Source: county tax records.
Cash-flow waterfall
monthlySold comps — $/sqft
last 12 mo · ≤1 miLoading sold comps…