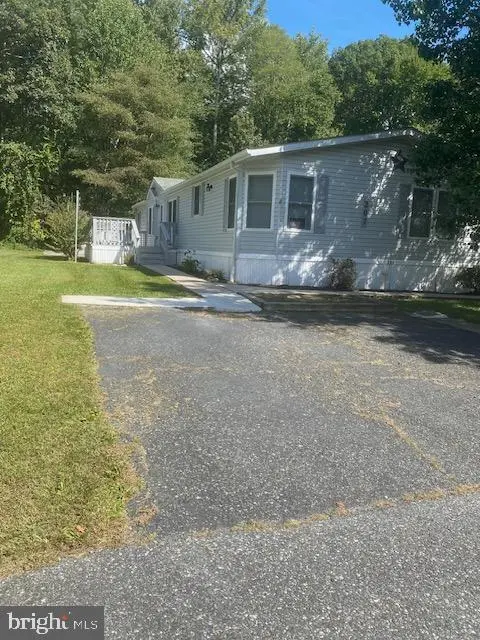
207 Poclain Rd Rd #207 · Perryman, MD
Flood risk No data
- FEMA flood zone
- —
- Chance of flooding over 30 yrs
- —
- Est. flood insurance / yr
- —
Fire risk No data
- Est. fire insurance / yr
- —
Heat risk No data
- Hot days now (above threshold)
- —
- Hot days in 30 yrs
- —
Wind risk No data
- Chance of severe wind over 30 yrs
- —
Air-quality risk No data
- Unhealthy air days now
- —
- Unhealthy air days in 30 yrs
- —
Risk factors via First Street. Map © Google.
Why this score? — see what drove the C+ grade
The composite is a weighted blend of 9 inputs, each scored 0–100. Each bar is that input's sub-score; the figure is the points it added to the 100-point composite (weight × sub-score).
- Cash flow +30.0/30.0
- 1% rule +10.0/10.0
- DSCR +10.0/10.0
- Condition / age +3.8/5.0
- Livability +3.2/5.0
- Schools +2.9/10.0
- Rent growth +2.6/5.0
- ARV discount +0.7/15.0
- Appreciation +0.0/10.0
$117,000
🖨 Deal sheet 📄 Offer letter ✓ Due diligence
Listing remarks MLS
A must see this immaculate Doublewide three bedrooms two full baths Livingroom , Family room with stone wood burning fireplace Eat in Kitchen Wood cabinets Corian counter tops with Breakfast bar , island , Flat top cooking stove , Dishwasher , a kitchen for the gourmet cook . Main bedroom with full main bath all updated bathroom vanit and toilet Tile shower with glass barn door slider , Laminate flooring through the entire home . Freshly painted, New recessed lighting New ceiling fans Blinds stay , Double decks Shed for storage Two car driveway. Buyers must be approved for park. Ready to move in !!!!!!!! Park rent $935
Key facts
- 2 parking spots
- Built 1991
- Listed 255 days
Neighborhood map
What this means for you Summary
Snapshot
- This is a 3-bed/2.0-bath single-family listed at $117k. Condition is rated good.
Deal economics
- At list price, monthly cash flow is $975 ($12k/yr) — positive.
- The deal already cash-flows at list — no discount required.
- Meets the 1% rule at list price ($2k rent vs $117k).
- Recommended offer: $103k (12.0% below list) — sets the bar for market timing.
- Cap rate 16.3% vs local median 5.7% in Perryman — top-decile yield for the area; either an underpriced asset or a hidden risk that comps aren't pricing in. Stress-test before assuming the spread holds.
Location & tenants
- Location reads 63/100 on livability (#293 in MD) — a middle-class / working-renter tenant base. Strengths: housing A+, crime A-, cost of living A-; Watch: employment C-, commute D+, schools F.
- Harford County Public Schools (suburban): math 22% / reading 39% proficiency, ranked #9 of 24 in MD (top 38%) — families likely to look elsewhere, expect single-tenant / working-renter base with shorter leases.
- Market conditions: Rents flat; 186 active listings in the ZIP; solid renter incomes; 803 units permitted in Harford County in 2024 (26 in 5+ unit buildings).
- This rent runs 33% of the median local income ($83k/yr) — at the standard rent-burdened threshold; future hikes will face affordability resistance.
Forward outlook
- Local home prices are declining (-3.0%/yr); year-one equity from $809 of loan paydown is wiped out by about $4k of value loss. Plan a longer hold.
- At projected returns (-3.0% appreciation + 0.3% rent growth), your $33k cash investment doubles in ~4 years — after that, you're playing with house money.
Negotiation context
- It's been on market 255 days — a 12% lower offer ($103k) is reasonable based on typical stale-listing flexibility.
Questions for the listing agent
- It's been on market 255 days. Have you received any prior offers? Is the seller open to a 12% concession, seller financing, or rate buy-down credit?
- Why hasn't it sold? Are there any deal-killer items the seller is aware of (foundation, flood, title, zoning, code violations)?
- Is there a deadline driving the sale (1031 exchange, divorce, estate, relocation)? That informs how much negotiation room exists.
- Schools are F-rated, which usually means shorter tenancies and higher turnover. Who's the typical renter profile here, and what's been the actual vacancy rate?
- What's the average days-on-market for RENTAL listings here right now (not sales)? A rising rental-DOM trend means longer vacancies and softer asking-rent achievability than the comps imply.
- What's the recent tenant-quality profile in this submarket — average credit score on applications, eviction rate, late-payment / NSF rate, and stable-employment percentage? A property-management company in the area should have these aggregated.
- How much new for-sale + rental construction is in the pipeline within 1–3 miles? Heavy new supply typically softens prices + rents 12–24 months out; constrained supply supports both.
Investment metrics
- 1% rule
- 1.93% ✓
- Cap rate
- 16.30%
- Cash-on-cash
- 35.73%
- DSCR
- 2.59
- GRM
- 4.3
CMA / ARV
- ARV (median comp)
- $101,700
- List price
- $117,000
- Delta
- 15.04%
- Verdict
- OVERPRICED
- Comps
- 20 within 1.0 mi
Show comp detail 12 sales within ~0.75 mi
| Address | Dist | Beds/Ba | Sqft | Sold | Price | $/sf | Match |
|---|---|---|---|---|---|---|---|
| 207 Poclain | 0.00mi | 3/2.0 | 1,716 (0%) | 19mo | $109,500 | $64 | 84 |
| 202 Garner Dr | 0.10mi | 3/2.0 | 1,600 (-7%) | 2mo | $60,500 | $38 | 82 |
| 227 Poclain Rd | 0.14mi | 4/2.0 (+1) | 1,600 (-7%) | 0mo | $95,000 | $59 | 77 |
| 1835 Mitchell Dr | 0.39mi | 3/2.5 | 1,782 (+4%) | 1mo | $425,000 | $238 | 73 |
| 1910 Bennett Rd | 0.09mi | 3/2.0 | 1,960 (+14%) | 2mo | $103,500 | $53 | 71 |
| 216 Poclain Rd | 0.13mi | 3/2.0 | 1,848 (+8%) | 13mo | $115,000 | $62 | 70 |
| 1904 Perryman Rd | 0.40mi | 3/2.0 | 1,660 (-3%) | 14mo | $325,000 | $196 | 64 |
| 1900 Fletcher Rd | 0.20mi | 4/2.0 (+1) | 1,960 (+14%) | 1mo | $99,900 | $51 | 61 |
| 235 Poclain | 0.18mi | 4/2.5 (+1) | 1,960 (+14%) | 3mo | $115,000 | $59 | 58 |
| 1834 Perryman Rd | 0.67mi | 3/2.0 | 1,870 (+9%) | 3mo | $337,000 | $180 | 51 |
| 1705 Church Point Ct | 0.59mi | 4/2.5 (+1) | 1,559 (-9%) | 2mo | $520,000 | $334 | 48 |
| 302 Seagull Dr | 0.37mi | 4/2.0 (+1) | 1,475 (-14%) | 17mo | $374,000 | $254 | 40 |
Match score weights: distance 35% · size 25% · config 20% · recency 20%. Top-matched comps best support the ARV.
Projected returns pro-forma
-3.0% appreciation · 0.28% rent growth · sell at horizon
- IRR
- 28.3%
- Equity multiple
- 2.14×
- Total profit
- $37,186
- Equity at exit
- $17,445
- IRR
- 34.1%
- Equity multiple
- 3.72×
- Total profit
- $89,138
- Equity at exit
- $10,116
Cash invested: $32,760 (down + closing). Projections, not guarantees.
Landlord ↔ Tenant lean methodology
- Overall (STATE)
- 27 Tenant-Leaning
- State Maryland
- 27 Tenant-Leaning · D+14
- County
- — inherits STATE
- City
- — inherits STATE
ZIP-level market 21001
- Home prices YoY
- -30.5%
- Rents YoY
- 0.3%
- Active inventory
- 186
- Price-to-rent
- 4.3×
Monthly cashflow live
- Estimated rent
- $2,258 medium interval (Pro) →
- Mortgage (P&I)
- −$614
- Tax est. 1.5%
- −$146 /mo · $1,755/yr
- Insurance
- −$49
- HOA
- −$0
- Vacancy / Maint / Mgmt
- −$474
- Net cashflow
- $975
Break-even live
UW: 25.0% down · 7.5% · 30yr · 1.5% tax · 5.0% vac · 8.0% maint · 8.0% mgmt
Financing live
Cash to close
- Down payment
- $29,250
- Closing costs
- $3,510
- Reserves months
- —
- Total cash needed
- —
Loan-product check · same deal, 3 products live
Conventional
25% down · 7.5% · 30yr
- Down + closing
- —
- Monthly P&I
- —
- Monthly cashflow
- —
- DSCR
- —
- Eligible?
- —
Personal DTI + credit; lowest rate.
DSCR
20% down · 8.5% · 30yr
- Down + closing
- —
- Monthly P&I
- —
- Monthly cashflow
- —
- DSCR
- —
- Eligible?
- —
No personal income docs; deal must DSCR.
Hard money
10% down · 12.0% · 12mo
- Down + closing
- —
- Monthly P&I
- —
- Monthly cashflow
- —
- DSCR
- —
- Eligible?
- —
Short-term bridge; refi at stabilization.
Listing history 14 events
-
2026-06-18days on market $117,000 Active 255 DOM
-
2026-06-17days on market $117,000 Active 254 DOM
-
2026-06-16days on market $117,000 Active 253 DOM
-
2026-06-15days on market $117,000 Active 252 DOM
-
2026-06-13days on market $117,000 Active 250 DOM
-
2026-06-09days on market $117,000 Active 246 DOM
-
2026-06-08days on market $117,000 Active 245 DOM
-
2026-06-07days on market $117,000 Active 244 DOM
-
2026-06-04days on market $117,000 Active 241 DOM
-
2026-06-03days on market $117,000 Active 240 DOM
-
2026-06-02days on market $117,000 Active 239 DOM
-
2026-06-01days on market $117,000 Active 238 DOM
-
2026-05-31days on market $117,000 Active 237 DOM
-
2025-10-06$117,000 Active 626-char remark
Show marketing remark (626 chars)
A must see this immaculate Doublewide three bedrooms two full baths Livingroom , Family room with stone wood burning fireplace Eat in Kitchen Wood cabinets Corian counter tops with Breakfast bar , island , Flat top cooking stove , Dishwasher , a kitchen for the gourmet cook . Main bedroom with full main bath all updated bathroom vanit and toilet Tile shower with glass barn door slider , Laminate flooring through the entire home . Freshly painted, New recessed lighting New ceiling fans Blinds stay , Double decks Shed for storage Two car driveway. Buyers must be approved for park. Ready to move in !!!!!!!! Park rent $935
ⓘ Source: listings_history table (triggers on properties + properties_extension) + one-shot
backfill from property_details.listing_events for pre-trigger history.
Nearby sold comps map
Loading sold comps map…
Walkable amenities ~0.75 mi
Loading nearby amenities…
Taxation est. · year 1
- Rental income
- $27,099
- − Mortgage interest
- −$6,554
- − Property taxes
- −$1,755
- − Insurance
- −$585
- − Repairs & maintenance
- −$2,168
- − Management
- −$2,168
- − Depreciation
- −$3,404
- Taxable income
- $10,466
- Est. tax owed @ 24.0%
- −$2,512
- After-tax cash flow
- $9,194/yr
For passive investors: Depreciation is non-cash, so a rental often shows a tax loss while cash-flowing — sheltering income. Rental losses are passive: they offset passive income freely, and up to $25,000/yr can offset ordinary (W-2) income if you actively participate and your MAGI is under $100k (phasing out to $0 by $150k); unused losses carry forward. On sale, claimed depreciation is recaptured at up to 25%, and gains may owe capital-gains tax (a 1031 exchange can defer both). Figures are a year-1 estimate at your 24.0% rate — not tax advice; consult a CPA.
Condition & rehab AI · 12 photos
This single-family home is in good condition with cosmetic updates needed. It is move-in ready and has a good resale and rental value.
Value-add opportunities
- Both Painting the exterior — Enhances curb appeal and resale value
- Both Landscaping the front yard — Improves curb appeal and rental value
- Both Upgrading the kitchen appliances — Modernizes the kitchen and increases appeal
- Both Upgrading the bathroom fixtures — Enhances the bathroom and increases appeal
Renovation cost estimate screening
Value-add ROI direction
- Both Painting the exterior — Enhances curb appeal and resale value ↑
- Both Landscaping the front yard — Improves curb appeal and rental value ↑
- Both Upgrading the kitchen appliances — Modernizes the kitchen and increases appeal ↑
- Both Upgrading the bathroom fixtures — Enhances the bathroom and increases appeal ↑
ⓘ Cost ranges are severity-bucket heuristics (US national rule-of-thumb). Get contractor quotes + a written scope before underwriting a rehab budget.
Schools (NCES district)
- District
- Harford County Public Schools
- NCES district ID
- 2400390
- Math proficiency
- 22% ▼ -23.00%
- Reading proficiency
- 39% ▼ -12.00%
- Median HH income
- $79,569
- Composite
- 29.38/100
- National rank
- #6527
- State rank
- #9 of 24 in MD
Livability — Perryman
- Score
- 63/100
- State rank
- #293
- US rank
- #15253
Category grades
Schools grade is shown separately in the Schools card above.
Census & demographics
- Census place
- Perryman, MD
- County
- Harford County · 198,512 people
- City population
- 75
- Metro
- Baltimore-Columbia-Towson, MD
- Population (ZIP)
- 27,168
- Household income
- $83,238
- Rent vs Own
- Severe rent burden
- 736.0
Population outlook (Harford County) Hauer SSP2
- Today (2025)
- 262,292 people
- By 2030
- 266,437 · +1.6%
- By 2040
- 269,954 · +2.9%
- By 2050
- 265,659 · +1.3%
- By 2075
- 252,886 · -3.6%
- By 2100
- 224,014 · -14.6%
Race, ethnicity, and origin ACS 2023
- Neighborhood character
- Diverse neighborhood (Simpson 0.62)
- Race & ethnicity
- White 54% Black 28% Hispanic / Latino 9% Two or more races 9% Asian 3%
- Hispanic origin (detail)
- Mexican 3% Puerto Rican 2% Dominican 1%
- Common ancestry
- Romanian 3% Slovak 1% Scotch-Irish 1%
- Foreign-born
- 8% · Canada, China, South Korea
- Languages at home
- 89% English-only · Spanish 4% Other Indo-European 1% German/W. Germanic 1%
Political lean MEDSL · Harford
- 2024 margin
- R (+13.8) · D 41.9% · R 55.7% · Other 2.4%
- 2008→2024 swing
- +5.0pp toward D · 2008: -18.8pp · 2024: -13.8pp
- All cycles
- 2024: R+13.8 2020: R+12.0 2016: R+24.5 2012: R+19.5 2008: R+18.8
Not yet ingested
- Civics
- —
Market trends
- HPI YoY
- ▼ -108.65%
- Current HPI
- 247.668
- Rent YoY
- ▲ 0.28%
- Metro
- Baltimore-Columbia-Towson, MD
- State GDP YoY
- ▲ 2.97%
- F500 in state
- 12
Industry mix (Fortune 500 HQ in MD)
| Industry | F500 HQs | Revenue |
|---|---|---|
| Aerospace / Defense | 1 | $71B |
|
||
| Utilities | 1 | $25B |
|
||
| Hotels | 1 | $24B |
|
||
| Consumer Goods | 1 | $7B |
|
||
| Real Estate | 1 | $6B |
|
||
| Chemicals | 1 | $2B |
|
||
Price history
1 event — show timeline
- 2025-10-06 Listed $117,000 BRIGHT MLS
Cash-flow waterfall
monthlySold comps — $/sqft
last 12 mo · ≤1 miLoading sold comps…