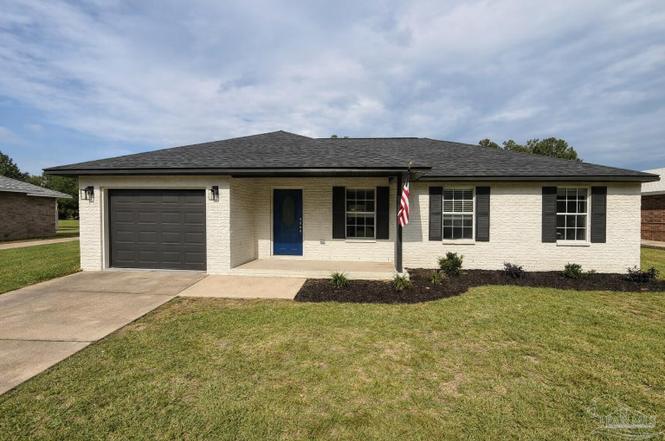
5386 Traci Dr · East Milton, FL
Flood risk 1/10 · Minimal
- FEMA flood zone
- X (unshaded)
- Chance of flooding over 30 yrs
- 0.0%
- Est. flood insurance / yr
- $507 – $1,088
Fire risk 3/10 · Minor
- Est. fire insurance / yr
- $947 – $1,759
Heat risk 9/10 · Severe
- Hot days now (above 105°F)
- 7 days/yr
- Hot days in 30 yrs
- 19 days/yr
Wind risk 9/10 · Severe
- Chance of severe wind over 30 yrs
- 99.0%
Air-quality risk 2/10 · Minimal
- Unhealthy air days now
- 0 days/yr
- Unhealthy air days in 30 yrs
- 1 days/yr
Risk factors via First Street. Map © Google.
Why this score? — see what drove the C- grade
The composite is a weighted blend of 9 inputs, each scored 0–100. Each bar is that input's sub-score; the figure is the points it added to the 100-point composite (weight × sub-score).
- Cash flow +17.6/30.0
- ARV discount +8.5/15.0
- DSCR +5.5/10.0
- Schools +5.3/10.0
- 1% rule +4.0/10.0
- Livability +3.9/5.0
- Rent growth +3.6/5.0
- Condition / age +2.5/5.0
- Appreciation +0.0/10.0
$249,900
🖨 Deal sheet (PDF) 📄 Offer letter ✓ Due diligence
Listing remarks
100% Updated 3/2 With 1-Car Garage — Move-In Ready! 1/2 Acres +/- Grab this one — a fully updated 3 bedroom, 2 bathroom home with a 1-car garage, completely refreshed from top to bottom! This property features a brand-new roof, new AC, and a new hot water heater. The home includes a new kitchen with granite countertops and stainless steel appliances, plus fresh interior and exterior paint, new fans and lighting, and all-new flooring throughout for a clean, modern finish. Everything has been updated — just move in and enjoy.
Key facts
- New kitchen
- New hot water heater
- Granite countertops
Tags
Property features AI
Finance
- Other: Property is not new construction; Appliances included: dishwasher, microwave, refrigerator, electric water heater
- HOA & community: No homeowners association
Exterior
- Parking: Attached garage with one covered space; Garage includes front entrance and garage door opener; Total of 1 parking space
- Security: Smoke detectors installed
- Utilities: Public water; Septic tank sewer; Copper electrical wiring
- Home design: Single-story home; Resale property; Not attached to another property
- Construction: Brick construction; Slab foundation; Shingle roof; One level
- Exterior features: Back yard with privacy fencing; Patio; Paved road access; County-maintained road; Central access, interior lot
Interior
- Kitchen: Updated kitchen with granite counters; New appliances and lighting (updated within the last year); Microwave; Dishwasher; Refrigerator
- Bedrooms: Master bedroom on the first floor; Other bedrooms on the first floor
- Flooring: Tile; Carpet; Laminate
- Bathrooms: Two full bathrooms; Bathrooms recently updated (new vanity, toilet, lights, flooring)
- Heating & cooling: Central heating; Central air conditioning; Ceiling fan cooling
- Interior features: Ceiling fans; Storm windows; Blinds
- Laundry & utility: Laundry located inside with washer/dryer hookups; Electric water heater
Neighborhood map
What this means for you Summary
Snapshot
- This is a 3-bed/2.0-bath single-family listed at $250k.
Deal economics
- At list price, monthly cash flow is $198 ($2k/yr) — positive.
- The deal already cash-flows at list — no discount required.
- To meet the 1% rule (rent ≥ 1% of price), the offer needs to be $226k (9.7% below list).
- Recommended offer: $226k (9.7% below list) — sets the bar for 1% rule.
- Cap rate 7.2% vs local median 4.6% in East Milton — top-decile yield for the area; either an underpriced asset or a hidden risk that comps aren't pricing in. Stress-test before assuming the spread holds.
Location & tenants
- Location reads 77/100 on livability (#199 in FL, #3,139 nationally) — a middle-class / working-renter tenant base. Strengths: cost of living A+, housing A+, health & safety A+; Watch: crime C-, amenities C-, commute F.
- Santa Rosa (suburban): math 63% / reading 60% proficiency, ranked #8 of 73 in FL (top 11%) — acceptable for families but not a draw, mixed tenant base, ~2y average lease.
- Market conditions: Rents rising fast (+4.5%/yr); 806 active listings in the ZIP; 2 comparable units currently listed for rent nearby; solid renter incomes; 1,983 units permitted in Santa Rosa County in 2024 (128 in 5+ unit buildings).
- This rent runs 32% of the median local income ($85k/yr) — at the standard rent-burdened threshold; future hikes will face affordability resistance.
Forward outlook
- Local home prices are declining (-3.0%/yr); year-one equity from $2k of loan paydown is wiped out by about $7k of value loss. Plan a longer hold.
- Santa Rosa County population projected at +31% by 2050 — long-run rental-demand tailwind backs the buy-and-hold thesis.
Negotiation context
- Only 8 days on market — expect competitive offers; lowballing is unlikely to land.
- 7 sale attempts since 16y ago with the ask held roughly flat each time — persistent listings suggest the price (not the market) is what's stuck; bring a comps-based counter.
- Current owner paid $147k; list at $250k implies a 70% gain — meaningful room to come down on a strong offer.
Risks & watch-outs
- Climate carrying-cost: severe wind risk, 99% chance of damaging wind over 30y; extreme-heat days projected 7→19/yr by 2055 (HVAC capex compounding) — expect insurance premiums to compound above CPI over the hold.
Questions for the listing agent
- Is there a deadline driving the sale (1031 exchange, divorce, estate, relocation)? That informs how much negotiation room exists.
- Schools are B-rated — typically a magnet for longer-tenancy family renters. What's the average tenant stay here, and is there a school-zone premium baked into asking?
- What's the average days-on-market for RENTAL listings here right now (not sales)? A rising rental-DOM trend means longer vacancies and softer asking-rent achievability than the comps imply.
- What's the recent tenant-quality profile in this submarket — average credit score on applications, eviction rate, late-payment / NSF rate, and stable-employment percentage? A property-management company in the area should have these aggregated.
- How much new for-sale + rental construction is in the pipeline within 1–3 miles? Heavy new supply typically softens prices + rents 12–24 months out; constrained supply supports both.
Investment metrics
- 1% rule
- 0.90% ✗
- Cap rate
- 7.24%
- Cash-on-cash
- 3.39%
- DSCR
- 1.15
- GRM
- 9.2
CMA / ARV
- ARV (on-the-fly)
- $255,532
- Comps found
- 10
Show comp detail 10 sales within ~0.75 mi
| Address | Dist | Beds/Ba | Sqft | Sold | Price | $/sf | Match |
|---|---|---|---|---|---|---|---|
| 5344 Traci Dr | 0.08mi | 3/2.0 | 1,302 (-2%) | 6mo | $250,000 | $192 | 88 |
| 8401 Sierra Echo Ln | 0.27mi | 3/2.0 | 1,378 (+4%) | 11mo | $222,000 | $161 | 72 |
| 6761 Twister Ln | 0.54mi | 3/2.0 | 1,352 (+2%) | 1mo | $324,650 | $240 | 71 |
| 6793 Twister Ln | 0.54mi | 3/2.0 | 1,352 (+2%) | 4mo | $315,000 | $233 | 68 |
| 6777 Twister Ln | 0.54mi | 3/2.0 | 1,385 (+5%) | 0mo | $315,000 | $227 | 67 |
| 5500 Cox Rd | 0.39mi | 3/2.0 | 1,412 (+7%) | 10mo | $300,000 | $212 | 63 |
| 5299 Cox Rd | 0.22mi | 3/2.0 | 1,442 (+9%) | 20mo | $247,000 | $171 | 58 |
| 8687 John Hamm Rd | 0.38mi | 4/2.0 (+1) | 1,425 (+8%) | 9mo | $203,000 | $142 | 57 |
| 5426 Cox Rd | 0.23mi | 3/2.0 | 1,176 (-11%) | 24mo | $215,000 | $183 | 51 |
| 5199 Pine Berry Rd | 0.63mi | 3/2.0 | 1,504 (+14%) | 8mo | $290,000 | $193 | 42 |
Match score weights: distance 35% · size 25% · config 20% · recency 20%. Top-matched comps best support the ARV.
Projected returns pro-forma
-3.0% appreciation · 4.53% rent growth · sell at horizon
- IRR
- -9.4%
- Equity multiple
- 0.65×
- Total profit
- $-24,412
- Equity at exit
- $37,261
- IRR
- 1.8%
- Equity multiple
- 1.14×
- Total profit
- $9,698
- Equity at exit
- $21,607
Cash invested: $69,972 (down + closing). Projections, not guarantees.
Landlord ↔ Tenant lean methodology
- Overall (STATE)
- 87 Strongly Landlord-Friendly
- State Florida
- 87 Strongly Landlord-Friendly · R+3
- County
- — inherits STATE
- City
- — inherits STATE
ZIP-level market 32583
- Home prices YoY
- -11.3%
- Rents YoY
- 4.5%
- Active inventory
- 806
- Price-to-rent
- 9.2×
Monthly cashflow live
- Estimated rent
- $2,257 medium interval (Pro) →
- Mortgage (P&I)
- −$1,311
- Tax from tax record
- −$171 /mo · $2,048/yr
- Insurance
- −$104
- HOA
- −$0
- Vacancy / Maint / Mgmt
- −$474
- Net cashflow
- $198
Break-even live
Sensitivity live
| Price | -10% $339 | -5% $269 | +0% $198 | +5% $127 | +10% $56 |
|---|---|---|---|---|---|
| Rent | -10% $20 | -5% $109 | +0% $198 | +5% $287 | +10% $376 |
| Rate | -1.0pp $324 | -0.5pp $262 | base $198 | +0.5pp $133 | +1.0pp $67 |
UW: 25.0% down · 7.5% · 30yr · 1.5% tax · 5.0% vac · 8.0% maint · 8.0% mgmt
Financing live
Cash to close
- Down payment
- $62,475
- Closing costs
- $7,497
- Reserves months
- —
- Total cash needed
- —
Loan-product check · same deal, 3 products live
Conventional
25% down · 7.5% · 30yr
- Down + closing
- —
- Monthly P&I
- —
- Monthly cashflow
- —
- DSCR
- —
- Eligible?
- —
Personal DTI + credit; lowest rate.
DSCR
20% down · 8.5% · 30yr
- Down + closing
- —
- Monthly P&I
- —
- Monthly cashflow
- —
- DSCR
- —
- Eligible?
- —
No personal income docs; deal must DSCR.
Hard money
10% down · 12.0% · 12mo
- Down + closing
- —
- Monthly P&I
- —
- Monthly cashflow
- —
- DSCR
- —
- Eligible?
- —
Short-term bridge; refi at stabilization.
Rent comps 2 comps
| Address | Beds | Baths | Sqft | Rent | $/sqft | DOM | Units | Dist |
|---|---|---|---|---|---|---|---|---|
| 8617 Tarsus Dr Milton, FL | 4.0 | 2.0 | 1830 | $2,200 | $1.20 | 24d | 1 | 0.32mi |
| 9330 Tara Cir Milton, FL | 4.0 | 2.0 | 1786 | $2,000 | $1.12 | 15d | 1 | 0.59mi |
Listing history 7 events
-
2026-06-18days on market $249,900 Active 8 DOM
-
2026-06-17days on market $249,900 Active 7 DOM
-
2026-06-16days on market $249,900 Active 6 DOM
-
2026-06-15days on market $249,900 Active 5 DOM
-
2026-06-14days on market $249,900 Active 3 DOM
-
2026-06-13remarks 530-char remark
-
2026-06-13$249,900 Active 2 DOM
ⓘ Source: listings_history table (triggers on properties + properties_extension) + one-shot
backfill from property_details.listing_events for pre-trigger history.
Tax reassessment forecast FL · Resets to sale price
- Current annual tax
- $2,048 · $171/mo
- Projected year-2 tax
- $2,074 · $173/mo
- Expected delta
- +$26/yr (+$2/mo · 1.3%)
ⓘ Screening estimate from a state-policy table — verify with the county assessor before closing.
Climate risk First Street
- Flood 1/10 Low FEMA zone X (unshaded) · 0% chance over 30 yrs
- Wildfire 3/10 Moderate
- Heat 9/10 Extreme 7 d/yr ≥105°F today · 19 d/yr by 30 yrs out
- Wind 9/10 Extreme 99% chance of damaging wind over 30 yrs
- Air quality 2/10 Low 0 unhealthy d/yr today · 1 by 30 yrs out
Nearby sold comps map
Loading sold comps map…
Walkable amenities ~0.75 mi
Loading nearby amenities…
Taxation est. · year 1
- Rental income
- $27,088
- − Mortgage interest
- −$13,998
- − Property taxes
- −$2,048
- − Insurance
- −$1,250
- − Repairs & maintenance
- −$2,167
- − Management
- −$2,167
- − Depreciation
- −$7,270
- Taxable loss
- −$1,812
- Est. tax savings @ 24.0%
- +$435
- After-tax cash flow
- $2,810/yr
For passive investors: Depreciation is non-cash, so a rental often shows a tax loss while cash-flowing — sheltering income. Rental losses are passive: they offset passive income freely, and up to $25,000/yr can offset ordinary (W-2) income if you actively participate and your MAGI is under $100k (phasing out to $0 by $150k); unused losses carry forward. On sale, claimed depreciation is recaptured at up to 25%, and gains may owe capital-gains tax (a 1031 exchange can defer both). Figures are a year-1 estimate at your 24.0% rate — not tax advice; consult a CPA.
Schools (NCES district)
- District
- Santa Rosa
- NCES district ID
- 1201650
- Math proficiency
- 63% ▼ -6.00%
- Reading proficiency
- 60% ▼ -5.00%
- Median HH income
- $58,161
- Composite
- 53.12/100
- National rank
- #1511
- State rank
- #8 of 73 in FL
Livability — East Milton
- Score
- 77/100
- State rank
- #199
- US rank
- #3139
Category grades
Schools grade is shown separately in the Schools card above.
Census & demographics
- Census place
- East Milton, FL
- County
- Santa Rosa County · 194,764 people
- City population
- 31,415
- Metro
- Pensacola-Ferry Pass-Brent, FL
- Population (ZIP)
- 31,828
- Household income
- $85,440
- Rent vs Own
- Severe rent burden
- 122.0
Population outlook (Santa Rosa County) Hauer SSP2
- Today (2025)
- 195,978 people
- By 2030
- 209,782 · +7.0%
- By 2040
- 235,293 · +20.1%
- By 2050
- 256,408 · +30.8%
- By 2075
- 298,074 · +52.1%
- By 2100
- 303,216 · +54.7%
Race, ethnicity, and origin ACS 2023
- Neighborhood character
- Predominantly White (74%)
- Race & ethnicity
- White 74% Black 11% Two or more races 10% Hispanic / Latino 6% Asian 1%
- Hispanic origin (detail)
- Mexican 3% Puerto Rican 2% Cuban 1%
- Common ancestry
- Italian 3% Slovak 2% Serbian 2%
- Foreign-born
- 3% · Canada
- Languages at home
- 94% English-only · Spanish 3%
Political lean MEDSL · Santa Rosa
- 2024 margin
- Solid R (+51.0) · D 24.1% · R 75.0%
- 2008→2024 swing
- -3.0pp toward R · 2008: -47.9pp · 2024: -51.0pp
- All cycles
- 2024: R+51.0 2020: R+46.5 2016: R+53.5 2012: R+52.6 2008: R+47.9
Not yet ingested
- Civics
- —
Market trends
- HPI YoY
- ▼ -38.35%
- Current HPI
- 301.8819
- Rent YoY
- ▲ 4.53%
- Metro
- Pensacola-Ferry Pass-Brent, FL
- State GDP YoY
- ▲ 3.28%
- F500 in state
- 36
Industry mix (Fortune 500 HQ in FL)
| Industry | F500 HQs | Revenue |
|---|---|---|
| Industrial Technology | 2 | $29B |
|
||
| Insurance | 2 | $17B |
|
||
| Retail | 1 | $60B |
|
||
| Technology Distribution | 1 | $58B |
|
||
| Homebuilding | 1 | $35B |
|
||
| Technology Manufacturing | 1 | $35B |
|
||
Price history
+1461.9% since first listed22 events — show timeline
- 2026-06-10 Listed $249,900 PARMLS
- 2026-04-27 Listed $5,000 NFMLS
- 2024-02-06 Pending — PARMLS
- 2024-02-05 Contingent — PARMLS
- 2024-02-05 Listing Removed — PARMLS
- 2024-01-31 Price Changed $189,700 PARMLS
- 2024-01-25 Price Changed $191,500 PARMLS
- 2024-01-17 Price Changed $192,400 PARMLS
- 2024-01-15 Price Changed $193,000 PARMLS
- 2024-01-07 Relisted — PARMLS
- 2024-01-02 Listing Removed — PARMLS
- 2023-11-28 Listed $195,000 PARMLS
- 2019-04-24 Sold (Public Records) $146,600 Public Records
- 2019-04-18 Sold (MLS) $146,000 PARMLS
- 2018-09-04 Listed $147,000 PARMLS
- 2014-03-24 Sold (Public Records) $85,000 Public Records
- 2014-03-19 Sold (MLS) $85,000 PARMLS
- 2013-09-30 Listed $85,000 PARMLS
- 2011-03-08 Listing Removed — PARMLS
- 2010-03-24 Listed $134,999 PARMLS
- 2004-10-15 Sold (Public Records) $21,000 Public Records
- 1984-09-01 Sold (Public Records) $16,000 Public Records
Property tax history
+5.5%/yrLatest (2025): $2,048 · +8.1% YoY. Source: county tax records.
Cash-flow waterfall
monthlySold comps — $/sqft
last 12 mo · ≤1 miLoading sold comps…