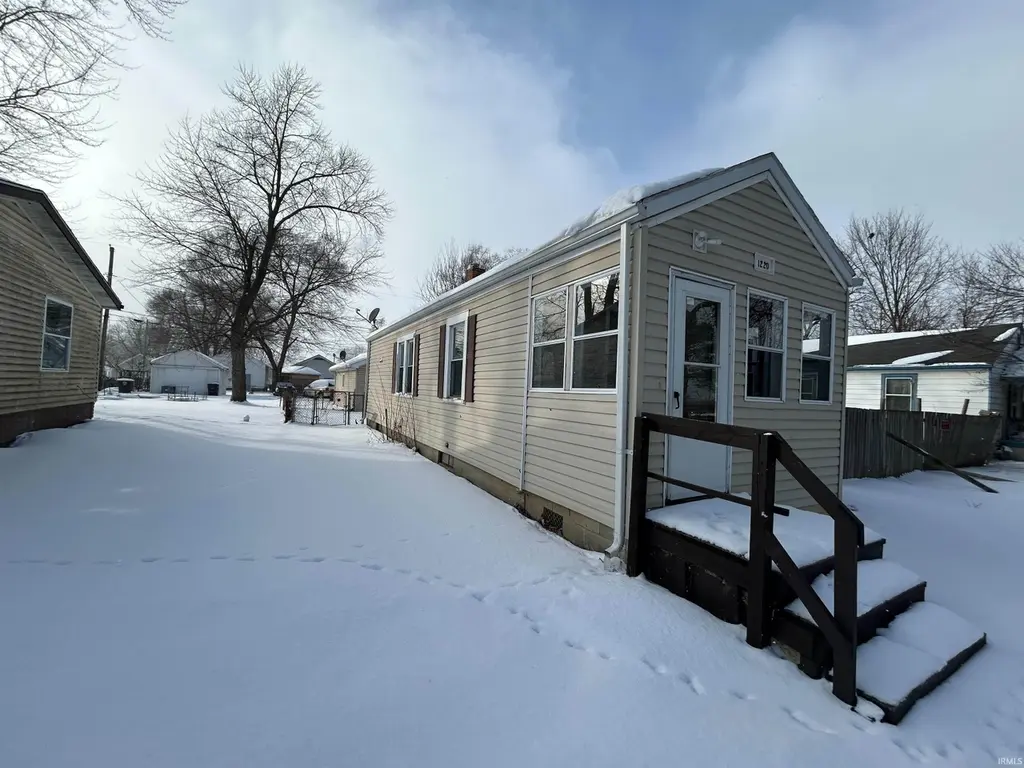
1220 Fairview Ave · Fort Wayne, IN
Flood risk 1/10 · Minimal
- FEMA flood zone
- X (unshaded)
- Chance of flooding over 30 yrs
- 0.0%
- Est. flood insurance / yr
- $473 – $860
Fire risk 1/10 · Minimal
- Est. fire insurance / yr
- $717 – $1,331
Heat risk 3/10 · Minor
- Hot days now (above 100°F)
- 7 days/yr
- Hot days in 30 yrs
- 17 days/yr
Wind risk 2/10 · Minimal
- Chance of severe wind over 30 yrs
- —
Air-quality risk 3/10 · Minor
- Unhealthy air days now
- 2 days/yr
- Unhealthy air days in 30 yrs
- 3 days/yr
Risk factors via First Street. Map © Google.
Why this score? — see what drove the B grade
The composite is a weighted blend of 9 inputs, each scored 0–100. Each bar is that input's sub-score; the figure is the points it added to the 100-point composite (weight × sub-score).
- Cash flow +22.7/30.0
- ARV discount +13.1/15.0
- Appreciation +10.0/10.0
- DSCR +7.3/10.0
- 1% rule +6.5/10.0
- Livability +4.2/5.0
- Rent growth +2.5/5.0
- Condition / age +2.5/5.0
- Schools +2.2/10.0
$85,000
🖨 Deal sheet 📄 Offer letter ✓ Due diligence
Listing remarks MLS
This one-story, 2-bedroom, 1-bath home in the ’03 offers the perfect blend of classic appeal and modern touches. Featuring hardwood flooring throughout, a cozy and inviting layout, and a one-car detached garage, it offers both comfort and functionality. Conveniently located near local parks, popular eateries, downtown, and Indiana Tech, it provides easy access to everyday conveniences!
Key facts
- Hardwood flooring
- Popular eateries
- Easy access
Tags
Neighborhood map
What this means for you Summary
Snapshot
- This is a 2-bed/1.0-bath single-family listed at $85k.
Deal economics
- At list price, monthly cash flow is $147 ($2k/yr) — positive.
- The deal already cash-flows at list — no discount required.
- Meets the 1% rule at list price ($974 rent vs $85k).
- Recommended offer: $84k (1.5% below list) — sets the bar for market timing.
- Cap rate 8.4% vs local median 4.8% in Fort Wayne — top-decile yield for the area; either an underpriced asset or a hidden risk that comps aren't pricing in. Stress-test before assuming the spread holds.
Location & tenants
- Location reads 84/100 on livability (#6 in IN, #676 nationally) — a professional / high-income tenant draw. Strengths: amenities A+, commute A+, cost of living A+; Watch: crime C-, schools D+, employment D+.
- Fort Wayne Community Schools (urban): math 22% / reading 29% proficiency, ranked #263 of 301 in IN (top 87%) — low school quality limits family demand, transient renter base, plan for 1-2y turnover; 60% free/reduced lunch — lower-income household profile, screen leases tightly.
- Market conditions: 52 active listings in the ZIP; 7 comparable units currently listed for rent nearby; rentals at typical pace (median 21d on market — plan ~3-4 weeks tenant-placement turnaround); lower-income renter base — watch delinquency; 1,861 units permitted in Allen County in 2024 (576 in 5+ unit buildings).
- This rent runs 34% of the median local income ($34k/yr) — at the standard rent-burdened threshold; future hikes will face affordability resistance.
Forward outlook
- In year one you build about $9k of equity ($588 loan paydown + $8k appreciation (10.0% local appreciation)).
- Allen County population projected at +10% by 2050 — modest demand growth; plan on rents tracking national, not racing it.
- At projected returns (10.0% appreciation + 3.0% rent growth), your $24k cash investment doubles in ~3 years — after that, you're playing with house money.
- By year 4, paydown + projected appreciation supports a ~$32k cash-out refi (75% LTV) — recoverable capital for the next deal without selling this one.
Negotiation context
- It's been on market 28 days — a 2% lower offer ($84k) is reasonable based on typical stale-listing flexibility.
- 4 sale attempts since 3y ago with the ask held roughly flat each time — persistent listings suggest the price (not the market) is what's stuck; bring a comps-based counter.
Risks & watch-outs
- Watch-outs: built in 1924 — expect roof / HVAC / electrical / plumbing capex.
Questions for the listing agent
- Built in 1924 — when were the roof, HVAC, electrical panel, plumbing, and water heater last replaced?
- Is there a deadline driving the sale (1031 exchange, divorce, estate, relocation)? That informs how much negotiation room exists.
- Schools are D-rated, which usually means shorter tenancies and higher turnover. Who's the typical renter profile here, and what's been the actual vacancy rate?
- What's the average days-on-market for RENTAL listings here right now (not sales)? A rising rental-DOM trend means longer vacancies and softer asking-rent achievability than the comps imply.
- What's the recent tenant-quality profile in this submarket — average credit score on applications, eviction rate, late-payment / NSF rate, and stable-employment percentage? A property-management company in the area should have these aggregated.
- How much new for-sale + rental construction is in the pipeline within 1–3 miles? Heavy new supply typically softens prices + rents 12–24 months out; constrained supply supports both.
Investment metrics
- 1% rule
- 1.15% ✓
- Cap rate
- 8.37%
- Cash-on-cash
- 7.41%
- DSCR
- 1.33
- GRM
- 7.3
CMA / ARV
- ARV (median comp)
- $97,203
- List price
- $85,000
- Delta
- -12.55%
- Verdict
- UNDERPRICED
- Comps
- 20 within 1.0 mi
Show comp detail 12 sales within ~0.75 mi
| Address | Dist | Beds/Ba | Sqft | Sold | Price | $/sf | Match |
|---|---|---|---|---|---|---|---|
| 1220 Fairview Ave | 0.00mi | 2/1.0 | 720 (0%) | 1mo | $81,000 | $113 | 99 |
| 2720 Pennsylvania St | 0.20mi | 2/1.0 | 720 (0%) | 7mo | $120,000 | $167 | 85 |
| 3031 Pennsylvania St | 0.20mi | 2/1.0 | 720 (0%) | 16mo | $124,900 | $173 | 78 |
| 1418 Kitch St | 0.25mi | 2/1.0 | 720 (0%) | 14mo | $95,000 | $132 | 77 |
| 2910 Chestnut St | 0.41mi | 2/1.0 | 720 (0%) | 6mo | $82,400 | $114 | 76 |
| 2250 Chestnut St | 0.55mi | 2/1.0 | 738 (+2%) | 0mo | $33,000 | $45 | 70 |
| 3124 Mcdonald St | 0.30mi | 2/1.0 | 780 (+8%) | 6mo | $116,000 | $149 | 67 |
| 3116 Pittsburg St | 0.21mi | 2/1.0 | 648 (-10%) | 16mo | $49,000 | $76 | 60 |
| 3227 Rodgers Ave | 0.68mi | 2/1.0 | 672 (-7%) | 2mo | $110,000 | $164 | 55 |
| 1715 Fleetwood Ave | 0.50mi | 2/1.0 | 678 (-6%) | 22mo | $51,000 | $75 | 49 |
| 3205 Schele Ave | 0.61mi | 2/1.0 | 672 (-7%) | 18mo | $95,000 | $141 | 46 |
| 3226 Rodgers Ave | 0.70mi | 3/1.0 (+1) | 755 (+5%) | 17mo | $84,500 | $112 | 40 |
Match score weights: distance 35% · size 25% · config 20% · recency 20%. Top-matched comps best support the ARV.
Projected returns pro-forma
10.0% appreciation · 3.0% rent growth · sell at horizon
- IRR
- 29.7%
- Equity multiple
- 3.34×
- Total profit
- $55,685
- Equity at exit
- $76,575
- IRR
- 25.8%
- Equity multiple
- 7.58×
- Total profit
- $156,698
- Equity at exit
- $165,136
Cash invested: $23,800 (down + closing). Projections, not guarantees.
Landlord ↔ Tenant lean methodology
- Overall (STATE)
- 90 Strongly Landlord-Friendly
- State Indiana
- 90 Strongly Landlord-Friendly · R+11
- County
- — inherits STATE
- City
- — inherits STATE
ZIP-level market 46803
- Active inventory
- 52
- Price-to-rent
- 7.3×
Monthly cashflow live
- Estimated rent
- $974 high interval (Pro) →
- Mortgage (P&I)
- −$446
- Tax from tax record
- −$141 /mo · $1,694/yr
- Insurance
- −$35
- HOA
- −$0
- Vacancy / Maint / Mgmt
- −$204
- Net cashflow
- $147
Break-even live
UW: 25.0% down · 7.5% · 30yr · 1.5% tax · 5.0% vac · 8.0% maint · 8.0% mgmt
Financing live
Cash to close
- Down payment
- $21,250
- Closing costs
- $2,550
- Reserves months
- —
- Total cash needed
- —
Loan-product check · same deal, 3 products live
Conventional
25% down · 7.5% · 30yr
- Down + closing
- —
- Monthly P&I
- —
- Monthly cashflow
- —
- DSCR
- —
- Eligible?
- —
Personal DTI + credit; lowest rate.
DSCR
20% down · 8.5% · 30yr
- Down + closing
- —
- Monthly P&I
- —
- Monthly cashflow
- —
- DSCR
- —
- Eligible?
- —
No personal income docs; deal must DSCR.
Hard money
10% down · 12.0% · 12mo
- Down + closing
- —
- Monthly P&I
- —
- Monthly cashflow
- —
- DSCR
- —
- Eligible?
- —
Short-term bridge; refi at stabilization.
Rent comps 7 comps
| Address | Beds | Baths | Sqft | Rent | $/sqft | DOM | Units | Dist |
|---|---|---|---|---|---|---|---|---|
| 3127 Pennsylvania St Fort Wayne, IN | 2.0 | 1.0 | 696 | $1,000 | $1.44 | 13d | 1 | 0.23mi |
| 1520 E Berry St Unit 210 Fort Wayne, IN | 1.0 | 1.0 | 550 | $950 | $1.73 | 43d | 1 | 0.96mi |
| 1710 Tilden Ave Fort Wayne, IN | 1.0 | 1.0 | 609 | $800 | $1.31 | 21d | 1 | 1.20mi |
| 2117 Eckart St Fort Wayne, IN | 1.0 | 1.0 | 468 | $975 | $2.08 | 21d | 1 | 1.33mi |
| 1115 Edgewater Ave Unit 1115-2 Fort Wayne, IN | 1.0 | 1.0 | 550 | $825 | $1.50 | 13d | 1 | 1.37mi |
| 859 Buchanan St Fort Wayne, IN | 1.0–4.0 | 1.0 | 887 | $900 | $1.01 | 21d | 1 | 1.37mi |
| 1005 Columbia Ave Unit 1005-1 Fort Wayne, IN | 2.0 | 1.0 | 680 | $950 | $1.40 | 13d | 1 | 1.49mi |
Listing history 9 events
-
2026-05-18status Pending 394-char remark
Show marketing remark (394 chars)
This one-story, 2-bedroom, 1-bath home in the ’03 offers the perfect blend of classic appeal and modern touches. Featuring hardwood flooring throughout, a cozy and inviting layout, and a one-car detached garage, it offers both comfort and functionality. Conveniently located near local parks, popular eateries, downtown, and Indiana Tech, it provides easy access to everyday conveniences!
-
2026-05-06historical Active Under Contract 394-char remark
Show marketing remark (394 chars)
This one-story, 2-bedroom, 1-bath home in the ’03 offers the perfect blend of classic appeal and modern touches. Featuring hardwood flooring throughout, a cozy and inviting layout, and a one-car detached garage, it offers both comfort and functionality. Conveniently located near local parks, popular eateries, downtown, and Indiana Tech, it provides easy access to everyday conveniences!
-
2026-04-24historical $900
-
2026-04-20$85,000 Active 394-char remark
Show marketing remark (394 chars)
This one-story, 2-bedroom, 1-bath home in the ’03 offers the perfect blend of classic appeal and modern touches. Featuring hardwood flooring throughout, a cozy and inviting layout, and a one-car detached garage, it offers both comfort and functionality. Conveniently located near local parks, popular eateries, downtown, and Indiana Tech, it provides easy access to everyday conveniences!
-
2026-01-13$900
-
2024-01-26historical $900
-
2023-12-30$900
-
2023-12-16historical $900
-
2023-11-15$900
ⓘ Source: listings_history table (triggers on properties + properties_extension) + one-shot
backfill from property_details.listing_events for pre-trigger history.
Tax reassessment forecast IN · Partial reset (capped growth)
- Current annual tax
- $1,694 · $141/mo
- Projected year-2 tax
- $1,694 · $141/mo
- Expected delta
- $0/yr ($0/mo · 0.0%)
ⓘ Screening estimate from a state-policy table — verify with the county assessor before closing.
Climate risk First Street
- Flood 1/10 Low FEMA zone X (unshaded) · 0% chance over 30 yrs
- Wildfire 1/10 Low
- Heat 3/10 Moderate 7 d/yr ≥100°F today · 17 d/yr by 30 yrs out
- Wind 2/10 Low
- Air quality 3/10 Moderate 2 unhealthy d/yr today · 3 by 30 yrs out
Nearby sold comps map
Loading sold comps map…
Walkable amenities ~0.75 mi
Loading nearby amenities…
Taxation est. · year 1
- Rental income
- $11,685
- − Mortgage interest
- −$4,761
- − Property taxes
- −$1,694
- − Insurance
- −$425
- − Repairs & maintenance
- −$935
- − Management
- −$935
- − Depreciation
- −$2,473
- Taxable income
- $462
- Est. tax owed @ 24.0%
- −$111
- After-tax cash flow
- $1,652/yr
For passive investors: Depreciation is non-cash, so a rental often shows a tax loss while cash-flowing — sheltering income. Rental losses are passive: they offset passive income freely, and up to $25,000/yr can offset ordinary (W-2) income if you actively participate and your MAGI is under $100k (phasing out to $0 by $150k); unused losses carry forward. On sale, claimed depreciation is recaptured at up to 25%, and gains may owe capital-gains tax (a 1031 exchange can defer both). Figures are a year-1 estimate at your 24.0% rate — not tax advice; consult a CPA.
Schools (NCES district)
- District
- Fort Wayne Community Schools
- NCES district ID
- 1803630
- Math proficiency
- 22% ▼ -11.00%
- Reading proficiency
- 29% ▼ -7.00%
- Median HH income
- $41,951
- Composite
- 21.68/100
- National rank
- #8275
- State rank
- #263 of 301 in IN
Livability — Fort Wayne
- Score
- 84/100
- State rank
- #6
- US rank
- #676
Category grades
Schools grade is shown separately in the Schools card above.
Census & demographics
- Census place
- Fort Wayne, IN
- County
- Allen County · 326,813 people
- City population
- 326,813
- Metro
- Fort Wayne, IN
- Population (ZIP)
- 10,994
- Household income
- $34,381
- Rent vs Own
- Severe rent burden
- 660.0
Population outlook (Allen County) Hauer SSP2
- Today (2025)
- 394,020 people
- By 2030
- 405,128 · +2.8%
- By 2040
- 423,476 · +7.5%
- By 2050
- 435,137 · +10.4%
- By 2075
- 450,293 · +14.3%
- By 2100
- 424,101 · +7.6%
Race, ethnicity, and origin ACS 2023
- Neighborhood character
- Diverse neighborhood (Simpson 0.69)
- Race & ethnicity
- Black 42% White 27% Hispanic / Latino 24% Two or more races 10% Native American 2% Asian 1%
- Hispanic origin (detail)
- Mexican 17% Puerto Rican 1%
- Common ancestry
- Lithuanian 1% Iranian 1% Serbian 1%
- Foreign-born
- 11% · Canada, Philippines
- Languages at home
- 81% English-only · Spanish 16% Other Asian/Pacific 1% French/Haitian/Cajun 1%
Political lean MEDSL · Allen
- 2024 margin
- R (+12.5) · D 42.9% · R 55.4% · Other 1.7%
- 2008→2024 swing
- -8.1pp toward R · 2008: -4.3pp · 2024: -12.5pp
- All cycles
- 2024: R+12.5 2020: R+11.2 2016: R+19.6 2012: R+16.8 2008: R+4.3
Not yet ingested
- Civics
- —
Market trends
- HPI YoY
- ▲ 107.58%
- Current HPI
- 404.7976
- Rent YoY
- —
- Metro
- Fort Wayne, IN
- State GDP YoY
- ▲ 2.90%
- F500 in state
- 18
Industry mix (Fortune 500 HQ in IN)
| Industry | F500 HQs | Revenue |
|---|---|---|
| Industrial Machinery | 2 | $37B |
|
||
| Healthcare | 1 | $177B |
|
||
| Pharmaceuticals | 1 | $45B |
|
||
| Metals / Steel | 1 | $18B |
|
||
| Agriculture | 1 | $17B |
|
||
| Packaging | 1 | $12B |
|
||
Price history
9 events — show timeline
- 2026-05-18 Pending — IRMLS
- 2026-05-06 Contingent — IRMLS
- 2026-04-24 Rental Removed $900 BUILDIUM
- 2026-04-20 Listed $85,000 IRMLS
- 2026-01-13 Listed for Rent $900 BUILDIUM
- 2024-01-26 Rental Removed $900 APPFOLIO
- 2023-12-30 Listed for Rent $900 APPFOLIO
- 2023-12-16 Rental Removed $900 APPFOLIO
- 2023-11-15 Listed for Rent $900 APPFOLIO
Property tax history
+11.3%/yrLatest (2024): $1,694 · +25.6% YoY. Source: county tax records.
Cash-flow waterfall
monthlySold comps — $/sqft
last 12 mo · ≤1 miLoading sold comps…