3162 Lincoln St · Lorain, OH
Flood risk 1/10 · Minimal
- FEMA flood zone
- X (unshaded)
- Chance of flooding over 30 yrs
- 0.0%
- Est. flood insurance / yr
- $473 – $860
Fire risk 1/10 · Minimal
- Est. fire insurance / yr
- $713 – $1,323
Heat risk 3/10 · Minor
- Hot days now (above 97°F)
- 7 days/yr
- Hot days in 30 yrs
- 16 days/yr
Wind risk 1/10 · Minimal
- Chance of severe wind over 30 yrs
- —
Air-quality risk 2/10 · Minimal
- Unhealthy air days now
- 1 days/yr
- Unhealthy air days in 30 yrs
- 1 days/yr
Risk factors via First Street. Map © Google.
Why this score? — see what drove the B grade
The composite is a weighted blend of 9 inputs, each scored 0–100. Each bar is that input's sub-score; the figure is the points it added to the 100-point composite (weight × sub-score).
- Cash flow +30.0/30.0
- ARV discount +15.0/15.0
- DSCR +10.0/10.0
- 1% rule +8.8/10.0
- Rent growth +3.5/5.0
- Livability +3.4/5.0
- Condition / age +2.5/5.0
- Schools +1.6/10.0
- Appreciation +0.0/10.0
$89,900
🖨 Deal sheet (PDF) 📄 Offer letter ✓ Due diligence
Listing remarks MLS
Investor special, bring your tools and creativity to be part of the rehab revitalizing of Lorain! SELLER TO DO NO REPAIRS, SELLING AS IS
Key facts
- 4,792 sq ft lot
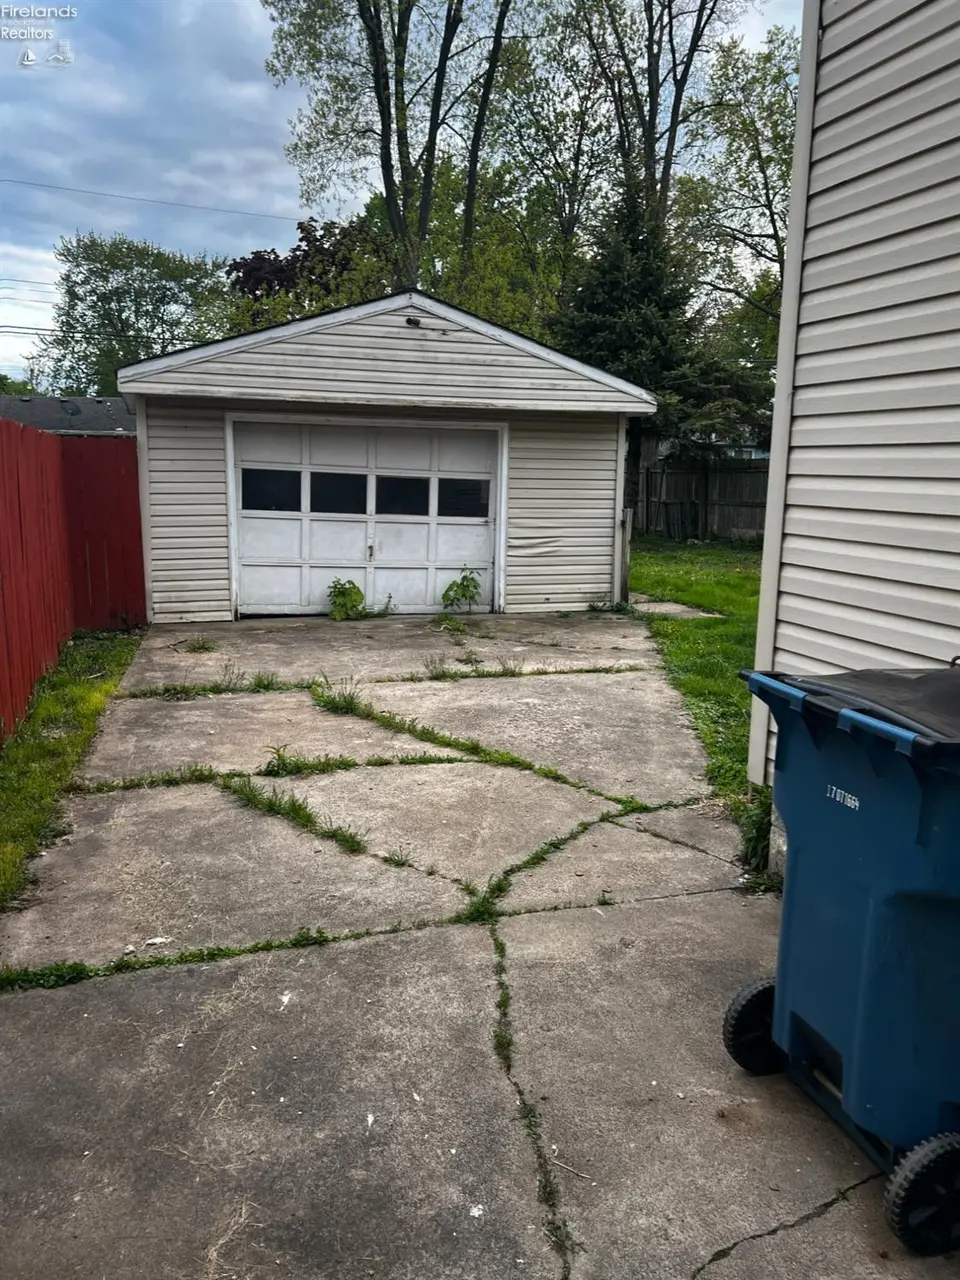
- Garage
- Built 1945
Property features AI
Exterior
- Parking: Detached 1-car garage
- Utilities: Public water; Public sewer
- Home design: Single-family residence; Residential property
- Construction: Vinyl siding
- Exterior features: Asphalt/fiberglass roof
Interior
- Kitchen: Range; Refrigerator
- Bathrooms: 1 full bathroom
- Heating & cooling: Natural gas forced-air heating
- Interior features: Range; Refrigerator; Full basement
Neighborhood map
What this means for you Summary
Snapshot
- This is a 3-bed/1.0-bath single-family listed at $90k.
Deal economics
- At list price, monthly cash flow is $373 ($4k/yr) — positive.
- The deal already cash-flows at list — no discount required.
- Meets the 1% rule at list price ($1k rent vs $90k).
- Cap rate 11.3% vs local median 5.7% in Lorain — top-decile yield for the area; either an underpriced asset or a hidden risk that comps aren't pricing in. Stress-test before assuming the spread holds.
Location & tenants
- Location reads 67/100 on livability (#595 in OH) — a middle-class / working-renter tenant base. Strengths: cost of living A+, housing A+; Watch: amenities D, health & safety D, crime F.
- Lorain City (suburban): math 13% / reading 26% proficiency, ranked #633 of 656 in OH (top 96%) — low school quality limits family demand, transient renter base, plan for 1-2y turnover; 80% free/reduced lunch — lower-income household profile, screen leases tightly.
- Zoned schools: Larkmoor Elementary School (math 22% / reading 32%, grade F, #1,193 of 1,584 statewide, top 76%, 438 students, 0% FRL); Longfellow Middle School (math 9% / reading 23%, grade F, #624 of 654 statewide, top 96%, 390 students, 0% FRL); Lorain High School (math 17% / reading 34%, grade F, #638 of 781 statewide, top 82%, 1,722 students, 0% FRL) — zoned schools average 0% FRL vs 80% district-wide (80 pts lower); this property's tenant base skews higher-income than the district average.
- Market conditions: Rents rising fast (+4.1%/yr); 135 active listings in the ZIP; 9 comparable units currently listed for rent nearby; rentals leasing fast (median 10d on market — plan ~1-2 weeks tenant-placement turnaround); 1,098 units permitted in Lorain County in 2024 (20 in 5+ unit buildings).
- This rent runs 33% of the median local income ($45k/yr) — at the standard rent-burdened threshold; future hikes will face affordability resistance.
Forward outlook
- Local home prices are declining (-3.0%/yr); year-one equity from $622 of loan paydown is wiped out by about $3k of value loss. Plan a longer hold.
- At projected returns (-3.0% appreciation + 4.1% rent growth), your $25k cash investment doubles in ~7 years — after that, you're playing with house money.
Negotiation context
- Only 6 days on market — expect competitive offers; lowballing is unlikely to land.
- 7 sale attempts since 30y ago with the ask held roughly flat each time — persistent listings suggest the price (not the market) is what's stuck; bring a comps-based counter.
Risks & watch-outs
- Watch-outs: built in 1945 — expect roof / HVAC / electrical / plumbing capex.
Questions for the listing agent
- Built in 1945 — when were the roof, HVAC, electrical panel, plumbing, and water heater last replaced?
- Is there a deadline driving the sale (1031 exchange, divorce, estate, relocation)? That informs how much negotiation room exists.
- Crime grade is F in this area — have there been break-ins, vandalism, or insurance claims at this property in the last 3 years? What carrier currently insures it and at what premium?
- What's the average days-on-market for RENTAL listings here right now (not sales)? A rising rental-DOM trend means longer vacancies and softer asking-rent achievability than the comps imply.
- What's the recent tenant-quality profile in this submarket — average credit score on applications, eviction rate, late-payment / NSF rate, and stable-employment percentage? A property-management company in the area should have these aggregated.
- How much new for-sale + rental construction is in the pipeline within 1–3 miles? Heavy new supply typically softens prices + rents 12–24 months out; constrained supply supports both.
Investment metrics
- 1% rule
- 1.38% ✓
- Cap rate
- 11.28%
- Cash-on-cash
- 17.80%
- DSCR
- 1.79
- GRM
- 6.0
CMA / ARV
- ARV (median comp)
- $136,843
- List price
- $89,900
- Delta
- -34.30%
- Verdict
- UNDERPRICED
- Comps
- 20 within 1.0 mi
Show comp detail 12 sales within ~0.75 mi
| Address | Dist | Beds/Ba | Sqft | Sold | Price | $/sf | Match |
|---|---|---|---|---|---|---|---|
| 3162 Lincoln St | 0.00mi | 3/1.0 | 1,015 (0%) | 1mo | $80,500 | $79 | 99 |
| 1008 Euclid Ave | 0.13mi | 3/1.0 | 1,033 (+2%) | 2mo | $75,000 | $73 | 89 |
| 1622 New Jersey Ave | 0.53mi | 3/1.0 | 1,040 (+2%) | 2mo | $131,000 | $126 | 70 |
| 914 Leroy St | 0.30mi | 3/1.0 | 928 (-9%) | 3mo | $85,000 | $92 | 69 |
| 1001 Euclid Ave | 0.11mi | 2/1.0 (-1) | 1,138 (+12%) | 3mo | $122,000 | $107 | 67 |
| 2222 Adams St | 0.62mi | 3/2.0 | 1,025 (+1%) | 5mo | $91,000 | $89 | 61 |
| 1609 Nevada Ave | 0.55mi | 3/2.0 | 972 (-4%) | 5mo | $155,000 | $159 | 59 |
| 1623 Nevada Ave | 0.58mi | 3/1.0 | 936 (-8%) | 5mo | $133,000 | $142 | 56 |
| 2201 Eastlawn St | 0.66mi | 3/1.5 | 936 (-8%) | 2mo | $149,000 | $159 | 53 |
| 2235 Crehore St | 0.65mi | 4/2.0 (+1) | 972 (-4%) | 1mo | $163,000 | $168 | 53 |
| 2149 Hancock St | 0.72mi | 4/1.0 (+1) | 1,073 (+6%) | 2mo | $126,000 | $117 | 51 |
| 1605 Ohio Ave | 0.46mi | 2/1.0 (-1) | 1,163 (+15%) | 5mo | $95,000 | $82 | 45 |
Match score weights: distance 35% · size 25% · config 20% · recency 20%. Top-matched comps best support the ARV.
Projected returns pro-forma
-3.0% appreciation · 4.09% rent growth · sell at horizon
- IRR
- 10.5%
- Equity multiple
- 1.42×
- Total profit
- $10,609
- Equity at exit
- $13,404
- IRR
- 20.5%
- Equity multiple
- 2.82×
- Total profit
- $45,704
- Equity at exit
- $7,773
Cash invested: $25,172 (down + closing). Projections, not guarantees.
Landlord ↔ Tenant lean methodology
- Overall (STATE)
- 73 Landlord-Friendly
- State Ohio
- 73 Landlord-Friendly · R+6
- County
- — inherits STATE
- City
- — inherits STATE
ZIP-level market 44052
- Home prices YoY
- -28.1%
- Rents YoY
- 4.1%
- Active inventory
- 135
- Price-to-rent
- 6.0×
Monthly cashflow live
- Estimated rent
- $1,245 high interval (Pro) →
- Mortgage (P&I)
- −$471
- Tax from tax record
- −$101 /mo · $1,214/yr
- Insurance
- −$37
- HOA
- −$0
- Vacancy / Maint / Mgmt
- −$261
- Net cashflow
- $373
Break-even live
Sensitivity live
| Price | -10% $424 | -5% $399 | +0% $373 | +5% $348 | +10% $323 |
|---|---|---|---|---|---|
| Rent | -10% $275 | -5% $324 | +0% $373 | +5% $423 | +10% $472 |
| Rate | -1.0pp $419 | -0.5pp $396 | base $373 | +0.5pp $350 | +1.0pp $326 |
UW: 25.0% down · 7.5% · 30yr · 1.5% tax · 5.0% vac · 8.0% maint · 8.0% mgmt
Financing live
Cash to close
- Down payment
- $22,475
- Closing costs
- $2,697
- Reserves months
- —
- Total cash needed
- —
Loan-product check · same deal, 3 products live
Conventional
25% down · 7.5% · 30yr
- Down + closing
- —
- Monthly P&I
- —
- Monthly cashflow
- —
- DSCR
- —
- Eligible?
- —
Personal DTI + credit; lowest rate.
DSCR
20% down · 8.5% · 30yr
- Down + closing
- —
- Monthly P&I
- —
- Monthly cashflow
- —
- DSCR
- —
- Eligible?
- —
No personal income docs; deal must DSCR.
Hard money
10% down · 12.0% · 12mo
- Down + closing
- —
- Monthly P&I
- —
- Monthly cashflow
- —
- DSCR
- —
- Eligible?
- —
Short-term bridge; refi at stabilization.
Rent comps 9 comps
| Address | Beds | Baths | Sqft | Rent | $/sqft | DOM | Units | Dist |
|---|---|---|---|---|---|---|---|---|
| 1109 Euclid Ave Lorain, OH | 3.0 | 1.0 | 1066 | $995 | $0.93 | 3d | 1 | 0.12mi |
| 716 Dakota Ave Lorain, OH | 3.0 | 2.0 | 1490 | $1,650 | $1.11 | 0d | 1 | 0.22mi |
| 629 Vermont Dr Lorain, OH | 3.0 | 1.0 | 840 | $1,195 | $1.42 | 0d | 1 | 0.32mi |
| 619 Root Rd Lorain, OH | 2.0 | 1.5 | 900 | $1,100 | $1.22 | 0d | 1 | 0.38mi |
| 1630 Euclid Ave Lorain, OH | 3.0 | 1.0 | 900 | $1,100 | $1.22 | 45d | 1 | 0.51mi |
| 2327 S Jefferson Blvd Lorain, OH | 3.0 | 1.0 | 1485 | $1,531 | $1.03 | 23d | 1 | 0.63mi |
| 1508 Fillmore Ave Unit 1510 Fillmore Ave: Left Unit Lorain, OH | 3.0 | 1.0 | 896 | $900 | $1.00 | 9d | 1 | 0.92mi |
| 1510 Fillmore Ave Lorain, OH | 3.0 | 1.0 | 896 | $900 | $1.00 | 9d | 1 | 0.93mi |
| 860 Colorado Ave Lorain, OH | 2.0 | 1.0 | 825 | $1,225 | $1.48 | 45d | 1 | 1.47mi |
Listing history 13 events
-
2026-05-09$89,900 Active 136-char remark
-
2026-05-06$89,900 Active 149-char remark
Show marketing remark (149 chars)
Investor special, bring your tools and creativity to be part of the rehab revitalizing of Lorain! SELLER TO DO NO REPAIRS, SELLING AS IS
-
2004-10-10historical
-
2004-09-15$59,343
-
2004-09-10historical
-
2004-07-22historical
-
2004-06-16$69,343
-
2004-04-27$85,900
-
1999-08-26historical
-
1999-02-26$84,900
-
1996-08-26soldstatus $64,000
-
1996-08-26soldstatus $61,000
-
1996-07-07$64,900
ⓘ Source: listings_history table (triggers on properties + properties_extension) + one-shot
backfill from property_details.listing_events for pre-trigger history.
Tax reassessment forecast OH · Partial reset (capped growth)
- Current annual tax
- $1,214 · $101/mo
- Projected year-2 tax
- $1,308 · $109/mo
- Expected delta
- +$94/yr (+$8/mo · 7.8%)
ⓘ Screening estimate from a state-policy table — verify with the county assessor before closing.
Climate risk First Street
- Flood 1/10 Low FEMA zone X (unshaded) · 0% chance over 30 yrs
- Wildfire 1/10 Low
- Heat 3/10 Moderate 7 d/yr ≥97°F today · 16 d/yr by 30 yrs out
- Wind 1/10 Low
- Air quality 2/10 Low 1 unhealthy d/yr today · 1 by 30 yrs out
Nearby sold comps map
Loading sold comps map…
Walkable amenities ~0.75 mi
Loading nearby amenities…
Taxation est. · year 1
- Rental income
- $14,940
- − Mortgage interest
- −$5,036
- − Property taxes
- −$1,214
- − Insurance
- −$450
- − Repairs & maintenance
- −$1,195
- − Management
- −$1,195
- − Depreciation
- −$2,615
- Taxable income
- $3,235
- Est. tax owed @ 24.0%
- −$776
- After-tax cash flow
- $3,705/yr
For passive investors: Depreciation is non-cash, so a rental often shows a tax loss while cash-flowing — sheltering income. Rental losses are passive: they offset passive income freely, and up to $25,000/yr can offset ordinary (W-2) income if you actively participate and your MAGI is under $100k (phasing out to $0 by $150k); unused losses carry forward. On sale, claimed depreciation is recaptured at up to 25%, and gains may owe capital-gains tax (a 1031 exchange can defer both). Figures are a year-1 estimate at your 24.0% rate — not tax advice; consult a CPA.
Schools (NCES district)
- District
- Lorain City
- NCES district ID
- 3904426
- Math proficiency
- 13% ▼ -24.00%
- Reading proficiency
- 26% ▼ -10.00%
- Median HH income
- $32,823
- Composite
- 15.81/100
- National rank
- #9266
- State rank
- #633 of 656 in OH
Livability — Lorain
- Score
- 67/100
- State rank
- #595
- US rank
- #10183
Category grades
Schools grade is shown separately in the Schools card above.
Census & demographics
- Census place
- Lorain, OH
- County
- Lorain County · 219,437 people
- City population
- 69,409
- Metro
- Cleveland-Elyria, OH
- Population (ZIP)
- 28,282
- Household income
- $45,023
- Rent vs Own
- Severe rent burden
- 1423.0
Population outlook (Lorain County) Hauer SSP2
- Today (2025)
- 314,924 people
- By 2030
- 317,546 · +0.8%
- By 2040
- 317,962 · +1.0%
- By 2050
- 312,872 · -0.7%
- By 2075
- 301,806 · -4.2%
- By 2100
- 278,271 · -11.6%
Race, ethnicity, and origin ACS 2023
- Neighborhood character
- Diverse neighborhood (Simpson 0.66)
- Race & ethnicity
- White 49% Hispanic / Latino 24% Black 21% Two or more races 16%
- Hispanic origin (detail)
- Mexican 5% Puerto Rican 17%
- Common ancestry
- Romanian 6% Lithuanian 1% Iranian 1%
- Foreign-born
- 3% · Canada, Vietnam
- Languages at home
- 84% English-only · Spanish 14%
Political lean MEDSL · Lorain
- 2024 margin
- Lean R (+5.7) · D 46.7% · R 52.4%
- 2008→2024 swing
- -23.6pp toward R · 2008: 17.9pp · 2024: -5.7pp
- All cycles
- 2024: R+5.7 2020: R+2.5 2016: R+0.3 2012: D+14.4 2008: D+17.9
Not yet ingested
- Civics
- —
Market trends
- HPI YoY
- ▼ -73.23%
- Current HPI
- 186.9657
- Rent YoY
- ▲ 4.09%
- Metro
- Cleveland-Elyria, OH
- State GDP YoY
- ▲ 1.98%
- F500 in state
- 48
Industry mix (Fortune 500 HQ in OH)
| Industry | F500 HQs | Revenue |
|---|---|---|
| Insurance | 3 | $145B |
|
||
| Industrial Machinery | 3 | $49B |
|
||
| Financial Services | 3 | $24B |
|
||
| Consumer Goods | 2 | $93B |
|
||
| Aerospace / Defense | 2 | $47B |
|
||
| Utilities | 2 | $33B |
|
||
Price history
+24.0% since first listed18 events — show timeline
- 2026-05-28 Sold (Public Records) $80,500 Public Records
- 2026-05-28 Sold (MLS) $80,500 FAOR
- 2026-05-28 Sold (MLS) $80,500 MLSNOW
- 2026-05-19 Pending — FAOR
- 2026-05-19 Pending — MLSNOW
- 2026-05-09 Listed $89,900 FAOR
- 2026-05-06 Listed $89,900 MLSNOW
- 2004-10-10 Listing Removed — MLSNOW
- 2004-09-15 Listed $59,343 MLSNOW
- 2004-09-10 Listing Removed — MLSNOW
- 2004-07-22 Listing Removed — MLSNOW
- 2004-06-16 Listed $69,343 MLSNOW
- 2004-04-27 Listed $85,900 MLSNOW
- 1999-08-26 Listing Removed — MLSNOW
- 1999-02-26 Listed $84,900 MLSNOW
- 1996-08-26 Sold (Public Records) $61,000 Public Records
- 1996-08-26 Sold (MLS) $64,000 MLSNOW
- 1996-07-07 Listed $64,900 MLSNOW
Property tax history
+0.4%/yrLatest (2025): $1,214 · -4.9% YoY. Source: county tax records.
Cash-flow waterfall
monthlySold comps — $/sqft
last 12 mo · ≤1 miLoading sold comps…