 Duplex
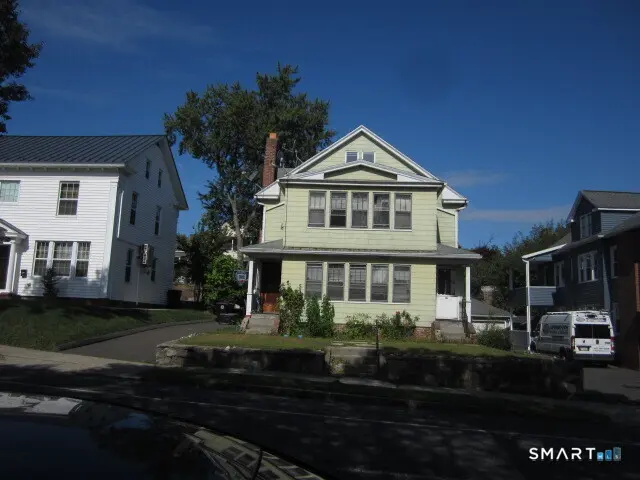
225-227 Beech St · Holyoke, MA
Flood risk 1/10 · Minimal
- FEMA flood zone
- X (unshaded)
- Chance of flooding over 30 yrs
- 0.0%
- Est. flood insurance / yr
- $473 – $860
Fire risk 2/10 · Minimal
- Est. fire insurance / yr
- $915 – $1,699
Heat risk 4/10 · Minor
- Hot days now (above 98°F)
- 7 days/yr
- Hot days in 30 yrs
- 16 days/yr
Wind risk 5/10 · Moderate
- Chance of severe wind over 30 yrs
- 23.0%
Air-quality risk 2/10 · Minimal
- Unhealthy air days now
- 1 days/yr
- Unhealthy air days in 30 yrs
- 1 days/yr
Risk factors via First Street. Map © Google.
Why this score? — see what drove the C+ grade
The composite is a weighted blend of 9 inputs, each scored 0–100. Each bar is that input's sub-score; the figure is the points it added to the 100-point composite (weight × sub-score).
- Cash flow +26.1/30.0
- ARV discount +13.5/15.0
- DSCR +8.8/10.0
- 1% rule +6.9/10.0
- Livability +3.1/5.0
- Rent growth +2.5/5.0
- Condition / age +2.2/5.0
- Schools +0.8/10.0
- Appreciation +0.0/10.0
$290,000
🖨 Deal sheet 📄 Offer letter ✓ Due diligence
Multi-family units
County records classify this as Multi-Family (2-4 Unit). Listing-text estimate: 2 units. confirmed
Listing remarks MLS
Two family, featuring ten rooms, four bedrooms and two full bathrooms. Easy access to highways, shopping and many more amenities. See below on how to place an offer.
Key facts
- 6,098 sq ft lot
- Built 1920
- Listed 143 days
Neighborhood map
What this means for you Summary
Snapshot
- This is a 2 × 2-bed/1.0-bath units multifamily listed at $290k. Condition is rated fair.
Deal economics
- At list price, monthly cash flow is $733 ($9k/yr) — positive. Per door: $367/mo.
- The deal already cash-flows at list — no discount required.
- Meets the 1% rule at list price ($3k rent vs $290k).
- Recommended offer: $255k (12.0% below list) — sets the bar for market timing.
- Cap rate 9.3% vs local median 5.3% in Holyoke — top-decile yield for the area; either an underpriced asset or a hidden risk that comps aren't pricing in. Stress-test before assuming the spread holds.
Location & tenants
- Location reads 62/100 on livability (#203 in MA) — a middle-class / working-renter tenant base. Strengths: commute A+, health & safety A+, housing B; Watch: schools F, crime F, amenities F.
- Holyoke (suburban): math 5% / reading 14% proficiency, ranked #302 of 302 in MA (top 100%) — low school quality limits family demand, transient renter base, plan for 1-2y turnover; 82% free/reduced lunch — lower-income household profile, screen leases tightly.
- Market conditions: 43 active listings in the ZIP; 453 units permitted in Hampden County in 2024 (116 in 5+ unit buildings).
- At $3,465/mo this rent would consume 78% of the median local household income ($54k/yr) (locally 2404% of renters already pay >50% of income on rent) — very limited rent-growth headroom before tenants either downsize or default.
Forward outlook
- Local home prices are declining (-3.0%/yr); year-one equity from $2k of loan paydown is wiped out by about $9k of value loss. Plan a longer hold.
- Hampden County population projected at +5% by 2050 — modest demand growth; plan on rents tracking national, not racing it.
- At projected returns (-3.0% appreciation + 3.0% rent growth), your $81k cash investment doubles in ~10 years — after that, you're playing with house money.
Negotiation context
- It's been on market 143 days — a 12% lower offer ($255k) is reasonable based on typical stale-listing flexibility.
- 3 sale attempts since 18y ago; this cycle's ask is 14214% above the opening price — seller raised mid-cycle; expect resistance to lowballs.
- Current owner paid $140k; list at $290k implies a 107% gain — meaningful room to come down on a strong offer.
Risks & watch-outs
- Watch-outs: built in 1920 — expect roof / HVAC / electrical / plumbing capex.
- Climate carrying-cost: moderate wind risk, 23% chance of damaging wind over 30y — expect insurance premiums to compound above CPI over the hold.
Questions for the listing agent
- It's been on market 143 days. Have you received any prior offers? Is the seller open to a 12% concession, seller financing, or rate buy-down credit?
- Can we see the unit-by-unit rent roll, current vacancy, and any below-market leases? What's the average tenancy length?
- What capital expenditures (roof, boiler, parking lot, exteriors) have been made in the last 5 years, and what's planned in the next 2?
- Have any recent inspections been done? Can we get a copy of the seller's disclosures and any deferred-maintenance estimates?
- Built in 1920 — when were the roof, HVAC, electrical panel, plumbing, and water heater last replaced?
- Why hasn't it sold? Are there any deal-killer items the seller is aware of (foundation, flood, title, zoning, code violations)?
- Is there a deadline driving the sale (1031 exchange, divorce, estate, relocation)? That informs how much negotiation room exists.
- Schools are F-rated, which usually means shorter tenancies and higher turnover. Who's the typical renter profile here, and what's been the actual vacancy rate?
- Crime grade is F in this area — have there been break-ins, vandalism, or insurance claims at this property in the last 3 years? What carrier currently insures it and at what premium?
- What's the average days-on-market for RENTAL listings here right now (not sales)? A rising rental-DOM trend means longer vacancies and softer asking-rent achievability than the comps imply.
- What's the recent tenant-quality profile in this submarket — average credit score on applications, eviction rate, late-payment / NSF rate, and stable-employment percentage? A property-management company in the area should have these aggregated.
- How much new apartment / multifamily construction is in the pipeline within 1–3 miles? Heavy new supply (>2% of stock underway) typically softens rents 12–24 months out; light construction supports rent growth.
Investment metrics
- 1% rule
- 1.19% ✓
- Cap rate
- 9.33%
- Cash-on-cash
- 10.84%
- DSCR
- 1.48
- GRM
- 7.0
CMA / ARV
- ARV (median comp)
- $334,462
- List price
- $290,000
- Delta
- -13.29%
- Verdict
- UNDERPRICED
- Comps
- 20 within 1.0 mi
Show comp detail 12 sales within ~0.75 mi
| Address | Dist | Beds/Ba | Sqft | Sold | Price | $/sf | Match |
|---|---|---|---|---|---|---|---|
| 1-3 Munroe St | 0.14mi | 4/2.0 | 2,382 (-5%) | 16mo | $182,000 | $76 | 73 |
| 180 Pine St | 0.16mi | 5/3.0 (+1) | 2,658 (+6%) | 10mo | $370,000 | $139 | 65 |
| 1421 Dwight St | 0.56mi | 4/2.0 | 2,410 (-4%) | 5mo | $275,000 | $114 | 64 |
| 194-196 W Franklin St | 0.35mi | 4/2.5 | 2,644 (+6%) | 16mo | $326,000 | $123 | 59 |
| 1-3 Monroe St | 0.48mi | 4/2.0 | 2,382 (-5%) | 13mo | $430,000 | $181 | 59 |
| 66 Taylor St | 0.58mi | 4/2.0 | 2,654 (+6%) | 6mo | $370,000 | $139 | 58 |
| 15-17 Oconnor Ave | 0.39mi | 5/2.5 (+1) | 2,799 (+12%) | 2mo | $412,000 | $147 | 53 |
| 4 Faille Ave | 0.50mi | 4/2.0 | 2,244 (-10%) | 10mo | $300,000 | $134 | 51 |
| 1657 Northampton St | 0.73mi | 4/2.0 | 2,718 (+9%) | 9mo | $402,000 | $148 | 44 |
| 264 Sargeant St | 0.48mi | 5/3.0 (+1) | 2,682 (+7%) | 19mo | $304,000 | $113 | 41 |
| 1357-1359 Dwight St | 0.52mi | 5/3.5 (+1) | 2,761 (+10%) | 9mo | $425,000 | $154 | 40 |
| 1683 Northampton St | 0.73mi | 3/2.0 (-1) | 2,212 (-12%) | 21mo | $280,000 | $127 | 24 |
Match score weights: distance 35% · size 25% · config 20% · recency 20%. Top-matched comps best support the ARV.
Projected returns pro-forma
-3.0% appreciation · 3.0% rent growth · sell at horizon
- IRR
- -0.1%
- Equity multiple
- 1.00×
- Total profit
- $-241
- Equity at exit
- $43,240
- IRR
- 9.6%
- Equity multiple
- 1.74×
- Total profit
- $60,136
- Equity at exit
- $25,074
Cash invested: $81,200 (down + closing). Projections, not guarantees.
Landlord ↔ Tenant lean methodology
- Overall (STATE)
- 20 Strongly Tenant-Friendly
- State Massachusetts
- 20 Strongly Tenant-Friendly · D+15
- County
- — inherits STATE
- City
- — inherits STATE
ZIP-level market 01040
- Home prices YoY
- -33.2%
- Active inventory
- 43
- Price-to-rent
- 14.0×
Monthly cashflow live
- Estimated rent
- $3,465 high interval (Pro) →
- Mortgage (P&I)
- −$1,521
- Tax est. 1.5%
- −$362 /mo · $4,350/yr
- Insurance
- −$121
- HOA
- −$0
- Vacancy / Maint / Mgmt
- −$728
- Net cashflow
- $733
Break-even live
2-unit breakdown (identical units grouped — click to expand)
| Units | Beds | Baths | Est. rent |
|---|---|---|---|
| 2× units | 2 | 1 | $3,464 |
| #1 | 2 | 1 | $1,732 |
| #2 | 2 | 1 | $1,732 |
| Total (2 units) | $3,465 | ||
UW: 25.0% down · 7.5% · 30yr · 1.5% tax · 5.0% vac · 8.0% maint · 8.0% mgmt
Financing live
Cash to close
- Down payment
- $72,500
- Closing costs
- $8,700
- Reserves months
- —
- Total cash needed
- —
Loan-product check · same deal, 3 products live
Conventional
25% down · 7.5% · 30yr
- Down + closing
- —
- Monthly P&I
- —
- Monthly cashflow
- —
- DSCR
- —
- Eligible?
- —
Personal DTI + credit; lowest rate.
DSCR
20% down · 8.5% · 30yr
- Down + closing
- —
- Monthly P&I
- —
- Monthly cashflow
- —
- DSCR
- —
- Eligible?
- —
No personal income docs; deal must DSCR.
Hard money
10% down · 12.0% · 12mo
- Down + closing
- —
- Monthly P&I
- —
- Monthly cashflow
- —
- DSCR
- —
- Eligible?
- —
Short-term bridge; refi at stabilization.
Listing history 21 events
-
2026-06-18days on market $290,000 Active 143 DOM
-
2026-06-17days on market $290,000 Active 142 DOM
-
2026-06-16days on market $290,000 Active 141 DOM
-
2026-06-15days on market $290,000 Active 140 DOM
-
2026-06-14days on market $290,000 Active 138 DOM
-
2026-06-10days on market $290,000 Active 135 DOM
-
2026-06-09days on market $290,000 Active 134 DOM
-
2026-06-08days on market $290,000 Active 133 DOM
-
2026-06-07days on market $290,000 Active 132 DOM
-
2026-06-03days on market $290,000 Active 128 DOM
-
2026-06-02days on market $290,000 Active 127 DOM
-
2026-06-01days on market $290,000 Active 126 DOM
-
2026-05-31days on market $290,000 Active 125 DOM
-
2026-05-30days on market $290,000 Active 124 DOM
-
2026-04-15price $290,000 165-char remark
Show marketing remark (165 chars)
Two family, featuring ten rooms, four bedrooms and two full bathrooms. Easy access to highways, shopping and many more amenities. See below on how to place an offer.
-
2026-04-03status Active 165-char remark
Show marketing remark (165 chars)
Two family, featuring ten rooms, four bedrooms and two full bathrooms. Easy access to highways, shopping and many more amenities. See below on how to place an offer.
-
2026-04-01historical 165-char remark
Show marketing remark (165 chars)
Two family, featuring ten rooms, four bedrooms and two full bathrooms. Easy access to highways, shopping and many more amenities. See below on how to place an offer.
-
2026-01-27price $300,000 165-char remark
Show marketing remark (165 chars)
Two family, featuring ten rooms, four bedrooms and two full bathrooms. Easy access to highways, shopping and many more amenities. See below on how to place an offer.
-
2025-10-25$2,026 Active 165-char remark
Show marketing remark (165 chars)
Two family, featuring ten rooms, four bedrooms and two full bathrooms. Easy access to highways, shopping and many more amenities. See below on how to place an offer.
-
2009-03-02soldstatus $140,000 254-char remark
Show marketing remark (254 chars)
A good investment and a good place to live. Buy this well cared for classic two9 family home in Holyoke at a great price. Hardwood floors, pantry and fireplaces in both units. Lots of old style woodwork. First floor bath is more modern in good shape.
-
2008-12-03$155,000 254-char remark
Show marketing remark (254 chars)
A good investment and a good place to live. Buy this well cared for classic two9 family home in Holyoke at a great price. Hardwood floors, pantry and fireplaces in both units. Lots of old style woodwork. First floor bath is more modern in good shape.
ⓘ Source: listings_history table (triggers on properties + properties_extension) + one-shot
backfill from property_details.listing_events for pre-trigger history.
Climate risk First Street
- Flood 1/10 Low FEMA zone X (unshaded) · 0% chance over 30 yrs
- Wildfire 2/10 Low
- Heat 4/10 Moderate 7 d/yr ≥98°F today · 16 d/yr by 30 yrs out
- Wind 5/10 Major 23% chance of damaging wind over 30 yrs
- Air quality 2/10 Low 1 unhealthy d/yr today · 1 by 30 yrs out
Nearby sold comps map
Loading sold comps map…
Walkable amenities ~0.75 mi
Loading nearby amenities…
Taxation est. · year 1
- Rental income
- $41,580
- − Mortgage interest
- −$16,245
- − Property taxes
- −$4,350
- − Insurance
- −$1,450
- − Repairs & maintenance
- −$3,326
- − Management
- −$3,326
- − Depreciation
- −$8,436
- Taxable income
- $4,446
- Est. tax owed @ 24.0%
- −$1,067
- After-tax cash flow
- $7,732/yr
For passive investors: Depreciation is non-cash, so a rental often shows a tax loss while cash-flowing — sheltering income. Rental losses are passive: they offset passive income freely, and up to $25,000/yr can offset ordinary (W-2) income if you actively participate and your MAGI is under $100k (phasing out to $0 by $150k); unused losses carry forward. On sale, claimed depreciation is recaptured at up to 25%, and gains may owe capital-gains tax (a 1031 exchange can defer both). Figures are a year-1 estimate at your 24.0% rate — not tax advice; consult a CPA.
Condition & rehab AI · 3 photos
This two-family home requires moderate renovations, including exterior siding, interior walls, and landscaping, to improve its condition and value.
Repairs flagged
- Major exterior siding — Severe peeling
- Major interior walls — Severe peeling
- Major landscaping — Overgrown vegetation
Value-add opportunities
- Both landscaping — Improves curb appeal and property value
- Both exterior siding — Enhances property value and curb appeal
- Both interior walls — Improves property value and rental appeal
Renovation cost estimate screening
| Repair item | Severity | Est. cost |
|---|---|---|
| exterior siding · Severe peeling | Major | $15,000–50,000 |
| interior walls · Severe peeling | Major | $15,000–50,000 |
| landscaping · Overgrown vegetation | Major | $15,000–50,000 |
| Total estimated repair cost · 3 items | $45,000–150,000 |
Value-add ROI direction
- Both landscaping — Improves curb appeal and property value ↑
- Both exterior siding — Enhances property value and curb appeal ↑
- Both interior walls — Improves property value and rental appeal ↑
ⓘ Cost ranges are severity-bucket heuristics (US national rule-of-thumb). Get contractor quotes + a written scope before underwriting a rehab budget.
Schools (NCES district)
- District
- Holyoke
- NCES district ID
- 2506270
- Math proficiency
- 5% ▼ -7.00%
- Reading proficiency
- 14% ▼ -5.00%
- Median HH income
- $35,495
- Composite
- 7.79/100
- National rank
- #9934
- State rank
- #302 of 302 in MA
Livability — Holyoke
- Score
- 62/100
- State rank
- #203
- US rank
- #16308
Category grades
Schools grade is shown separately in the Schools card above.
Census & demographics
- Census place
- Holyoke, MA
- County
- Hampden County · 230,965 people
- City population
- 37,813
- Metro
- Springfield, MA
- Population (ZIP)
- 37,813
- Household income
- $53,605
- Rent vs Own
- Severe rent burden
- 2404.0
Population outlook (Hampden County) Hauer SSP2
- Today (2025)
- 485,646 people
- By 2030
- 491,517 · +1.2%
- By 2040
- 500,539 · +3.1%
- By 2050
- 508,827 · +4.8%
- By 2075
- 539,167 · +11.0%
- By 2100
- 545,698 · +12.4%
Race, ethnicity, and origin ACS 2023
- Neighborhood character
- Majority Hispanic (52%)
- Race & ethnicity
- Hispanic / Latino 52% White 43% Two or more races 23% Black 2%
- Hispanic origin (detail)
- Puerto Rican 45% Dominican 2%
- Common ancestry
- Lithuanian 5% Romanian 4% Slovak 1%
- Foreign-born
- 6% · Canada, Jamaica
- Languages at home
- 58% English-only · Spanish 39% Russian/Polish/Slavic 1% French/Haitian/Cajun 1%
Political lean MEDSL · Hampden
- 2024 margin
- Lean D (+8.9) · D 53.4% · R 44.5% · Other 2.1%
- 2008→2024 swing
- -16.4pp toward R · 2008: 25.3pp · 2024: 8.9pp
- All cycles
- 2024: D+8.9 2020: D+17.7 2016: D+16.0 2012: D+25.4 2008: D+25.3
Not yet ingested
- Civics
- —
Market trends
- HPI YoY
- ▼ -146.03%
- Current HPI
- 293.93
- Rent YoY
- —
- Metro
- Springfield, MA
- State GDP YoY
- ▲ 2.28%
- F500 in state
- 38
Industry mix (Fortune 500 HQ in MA)
| Industry | F500 HQs | Revenue |
|---|---|---|
| Technology | 3 | $17B |
|
||
| Insurance | 2 | $84B |
|
||
| Retail | 2 | $76B |
|
||
| Life Sciences | 1 | $43B |
|
||
| Energy Technology | 1 | $31B |
|
||
| Aerospace / Defense | 1 | $18B |
|
||
Price history
+87.1% since first listed7 events — show timeline
- 2026-04-15 Price Changed $290,000 Smart MLS
- 2026-04-03 Relisted — Smart MLS
- 2026-04-01 Listing Removed — Smart MLS
- 2026-01-27 Price Changed $300,000 Smart MLS
- 2025-10-25 Listed $2,026 Smart MLS
- 2009-03-02 Sold (MLS) $140,000 MLS PIN
- 2008-12-03 Listed $155,000 MLS PIN
Cash-flow waterfall
monthlySold comps — $/sqft
last 12 mo · ≤1 miLoading sold comps…