7278 Hazelcrest Dr · Hazelwood, MO
Flood risk 4/10 · Minor
- FEMA flood zone
- X (unshaded)
- Chance of flooding over 30 yrs
- 0.2%
- Est. flood insurance / yr
- $507 – $1,088
Fire risk 1/10 · Minimal
- Est. fire insurance / yr
- $1,054 – $1,958
Heat risk 5/10 · Moderate
- Hot days now (above 105°F)
- 7 days/yr
- Hot days in 30 yrs
- 22 days/yr
Wind risk 2/10 · Minimal
- Chance of severe wind over 30 yrs
- 1.0%
Air-quality risk 3/10 · Minor
- Unhealthy air days now
- 3 days/yr
- Unhealthy air days in 30 yrs
- 5 days/yr
Risk factors via First Street. Map © Google.
Why this score? — see what drove the C+ grade
The composite is a weighted blend of 9 inputs, each scored 0–100. Each bar is that input's sub-score; the figure is the points it added to the 100-point composite (weight × sub-score).
- Cash flow +26.7/30.0
- 1% rule +10.0/10.0
- DSCR +9.2/10.0
- ARV discount +4.9/15.0
- Rent growth +3.6/5.0
- Livability +3.1/5.0
- Condition / age +2.5/5.0
- Schools +1.2/10.0
- Appreciation +0.0/10.0
$83,900
🖨 Deal sheet 📄 Offer letter ✓ Due diligence
Listing remarks
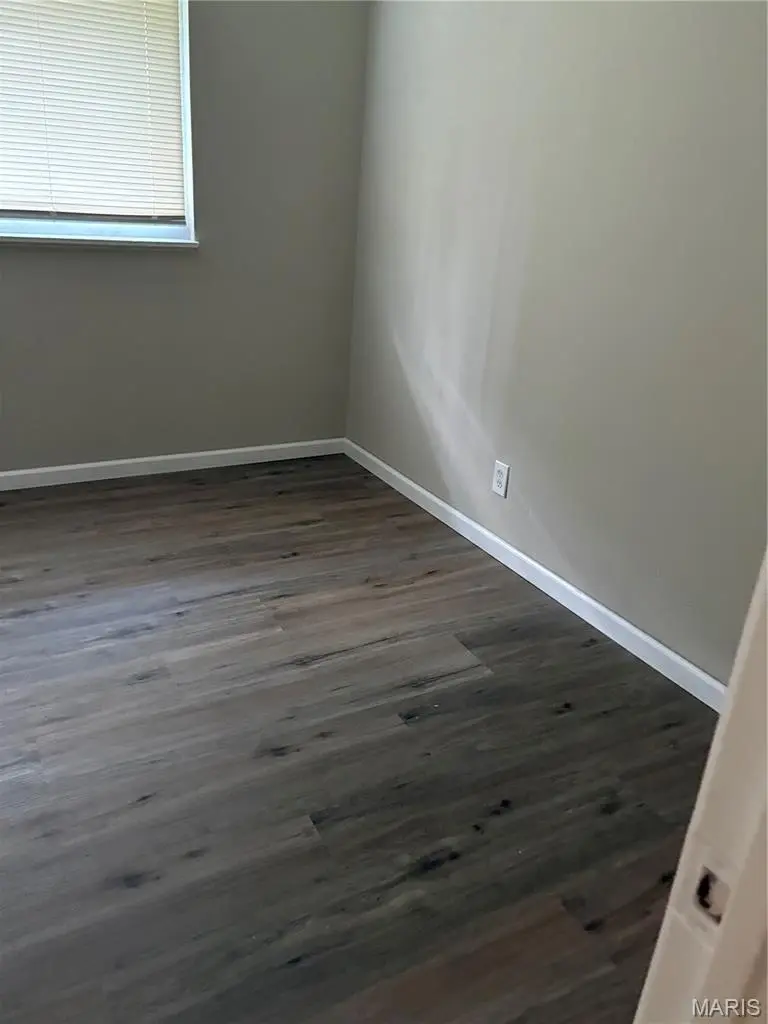
Recently remodeled and updated featuring all new kitchen cabinets, countertops, faucet, appliances (electric range, microwave, dishwasher and disposal), all new luxury vinyl plank flooring on main floor and upstairs bathroom. Newer windows installed by Window World (prior to my ownership). Newer carpeting on steps and bedrooms. Newer blinds, six panel doors/door hardware and lighting. Both bathrooms have new vanities, faucets, toilets, water lines and flooring. Upstairs bathroom has newer tub and tile surround/medicine cabinet. Most baseboard heaters are newer along with a few thermostats. There are 3 window/ wall acs! Master bedroom has a walk-in closet and new countertop. Nice fenced in p
Key facts
- Newer carpeting
- New kitchen cabinets
- New appliances
Tags
Property features AI
Finance
- Other: Community features include sidewalks, street lights, public bus access, and storm sewer; 498 units in the community
- Financial info: Lease not considered
- HOA & community: HOA: Hazelcrest; Monthly association fee of $380; HOA amenities include clubhouse and parking; Association fee covers grounds maintenance, parking/roads maintenance, common area maintenance, exterior maintenance, management, roof, sewer, snow removal, trash, and water
Exterior
- Parking: Community parking (association provides parking)
- Security: Private entrance
- Utilities: Community water; Public sewer; Electric service available/connected; Cable available; Water and sewer available/connected
- Home design: Residential condominium; Updated/remodeled condition; Two levels; Private ownership
- Construction: Brick construction; Asbestos shingle roof
- Exterior features: Patio; Courtyard; Private entrance; Private yard; Storage; No-step entry; Fenced yard with vinyl fencing; Level lot; Near public transit
Interior
- Kitchen: Stainless steel appliances; Dishwasher; Disposal; Microwave; Electric range
- Bedrooms: 3 bedrooms total; All bedrooms located on the upper level
- Flooring: Carpet
- Bathrooms: 1 full bathroom; 1 half bathroom (main level)
- Heating & cooling: Baseboard heating; Electric cooling with wall unit(s)
- Interior features: Kitchen/dining room combo; Pantry; Walk-in closet(s); Blinds and window coverings; Insulated windows with screens; Tilt-in windows
- Laundry & utility: Washer hookup; Electric dryer hookup; Laundry located on main level; Electric water heater
Neighborhood map
What this means for you Summary
Snapshot
- This is a 3-bed/1.5-bath condo listed at $84k.
Deal economics
- At list price, monthly cash flow is $227 ($3k/yr) — positive.
- The deal already cash-flows at list — no discount required.
- Meets the 1% rule at list price ($1k rent vs $84k).
- Recommended offer: $81k (3.0% below list) — sets the bar for market timing.
- Cap rate 9.5% vs local median 7.2% in Hazelwood — top-decile yield for the area; either an underpriced asset or a hidden risk that comps aren't pricing in. Stress-test before assuming the spread holds.
Location & tenants
- Location reads 62/100 on livability (#395 in MO) — a middle-class / working-renter tenant base. Strengths: cost of living A+, housing A+; Watch: crime F, amenities F, commute F.
- Ferguson-Florissant R-II (suburban): math 7% / reading 20% proficiency, ranked #311 of 324 in MO (top 96%) — low school quality limits family demand, transient renter base, plan for 1-2y turnover; 70% free/reduced lunch — lower-income household profile, screen leases tightly.
- Zoned schools: Combs Elementary (math 7% / reading 17%, grade F, #1,016 of 1,115 statewide, top 92%, 295 students, 99% FRL); Mccluer High (math 0% / reading 17%, grade F, #511 of 521 statewide, top 98%, 1,181 students, 100% FRL) — zoned schools average 99% FRL vs 70% district-wide (30 pts higher); higher-poverty schools than district average — tighter screening recommended.
- Market conditions: Rents rising fast (+4.5%/yr); 68 active listings in the ZIP; 39 comparable units currently listed for rent nearby; rentals at typical pace (median 24d on market — plan ~3-4 weeks tenant-placement turnaround); 920 units permitted in St. Louis County in 2024 (250 in 5+ unit buildings).
- This rent runs 35% of the median local income ($49k/yr) — at the standard rent-burdened threshold; future hikes will face affordability resistance.
Forward outlook
- Local home prices are declining (-3.0%/yr); year-one equity from $580 of loan paydown is wiped out by about $3k of value loss. Plan a longer hold.
- At projected returns (-3.0% appreciation + 4.5% rent growth), your $23k cash investment doubles in ~8 years — after that, you're playing with house money.
Negotiation context
- It's been on market 36 days — a 3% lower offer ($81k) is reasonable based on typical stale-listing flexibility.
Risks & watch-outs
- Watch-outs: HOA is 26% of rent.
- Climate carrying-cost: extreme-heat days projected 7→22/yr by 2055 (HVAC capex compounding) — expect insurance premiums to compound above CPI over the hold.
Questions for the listing agent
- It's been on market 36 days. Have you received any prior offers? Is the seller open to a 3% concession, seller financing, or rate buy-down credit?
- Built in 1965 — when were the roof, HVAC, electrical panel, plumbing, and water heater last replaced?
- What does the HOA fee cover, when was the last increase, and are there any pending special assessments or reserve-fund shortfalls?
- Any open or pending special assessments — roof, HVAC, plumbing, elevator, façade? What's the per-unit balance and payoff schedule, and is the seller paying it off at close or rolling it to the buyer?
- Is there a deadline driving the sale (1031 exchange, divorce, estate, relocation)? That informs how much negotiation room exists.
- Schools are D-rated, which usually means shorter tenancies and higher turnover. Who's the typical renter profile here, and what's been the actual vacancy rate?
- Crime grade is F in this area — have there been break-ins, vandalism, or insurance claims at this property in the last 3 years? What carrier currently insures it and at what premium?
- What's the average days-on-market for RENTAL listings here right now (not sales)? A rising rental-DOM trend means longer vacancies and softer asking-rent achievability than the comps imply.
- What's the recent tenant-quality profile in this submarket — average credit score on applications, eviction rate, late-payment / NSF rate, and stable-employment percentage? A property-management company in the area should have these aggregated.
- How much new apartment / multifamily construction is in the pipeline within 1–3 miles? Heavy new supply (>2% of stock underway) typically softens rents 12–24 months out; light construction supports rent growth.
Investment metrics
- 1% rule
- 1.72% ✓
- Cap rate
- 9.54%
- Cash-on-cash
- 11.61%
- DSCR
- 1.52
- GRM
- 4.8
CMA / ARV
- ARV (median comp)
- $79,340
- List price
- $83,900
- Delta
- 5.75%
- Verdict
- FAIR
- Comps
- 20 within 1.0 mi
Projected returns pro-forma
-3.0% appreciation · 4.45% rent growth · sell at horizon
- IRR
- 3.5%
- Equity multiple
- 1.14×
- Total profit
- $3,246
- Equity at exit
- $12,510
- IRR
- 15.0%
- Equity multiple
- 2.34×
- Total profit
- $31,422
- Equity at exit
- $7,254
Cash invested: $23,492 (down + closing). Projections, not guarantees.
Landlord ↔ Tenant lean methodology
- Overall (STATE)
- 81 Strongly Landlord-Friendly
- State Missouri
- 81 Strongly Landlord-Friendly · R+10
- County
- — inherits STATE
- City
- — inherits STATE
ZIP-level market 63042
- Rents YoY
- 4.5%
- Active inventory
- 68
- Price-to-rent
- 4.8×
Monthly cashflow live
- Estimated rent
- $1,444 high interval (Pro) →
- Mortgage (P&I)
- −$440
- Tax from tax record
- −$58 /mo · $701/yr
- Insurance
- −$35
- HOA
- −$380
- Vacancy / Maint / Mgmt
- −$303
- Net cashflow
- $227
Break-even live
UW: 25.0% down · 7.5% · 30yr · 1.5% tax · 5.0% vac · 8.0% maint · 8.0% mgmt
Financing live
Cash to close
- Down payment
- $20,975
- Closing costs
- $2,517
- Reserves months
- —
- Total cash needed
- —
Loan-product check · same deal, 3 products live
Conventional
25% down · 7.5% · 30yr
- Down + closing
- —
- Monthly P&I
- —
- Monthly cashflow
- —
- DSCR
- —
- Eligible?
- —
Personal DTI + credit; lowest rate.
DSCR
20% down · 8.5% · 30yr
- Down + closing
- —
- Monthly P&I
- —
- Monthly cashflow
- —
- DSCR
- —
- Eligible?
- —
No personal income docs; deal must DSCR.
Hard money
10% down · 12.0% · 12mo
- Down + closing
- —
- Monthly P&I
- —
- Monthly cashflow
- —
- DSCR
- —
- Eligible?
- —
Short-term bridge; refi at stabilization.
Rent comps 39 comps
| Address | Beds | Baths | Sqft | Rent | $/sqft | DOM | Units | Dist |
|---|---|---|---|---|---|---|---|---|
| 7437 Hazelcrest Dr Unit H Hazelwood, MO | 3.0 | 1.0 | 1000 | $1,000 | $1.00 | 7d | 1 | 0.24mi |
| 16 Mary Rose Ct Hazelwood, MO | 3.0 | 2.0 | 1506 | $1,706 | $1.13 | 14d | 1 | 0.51mi |
| 8507 Tally Ho Dr Hazelwood, MO | 2.0 | 1.5 | 1478 | $1,300 | $0.88 | 43d | 5 | 0.54mi |
| 240 Chez Vant Ct Hazelwood, MO | 2.0 | 1.5 | 1440 | $1,350 | $0.94 | 43d | 1 | 0.59mi |
| 17 Valley Dr Florissant, MO | 2.0 | 2.0 | 1356 | $1,525 | $1.12 | 43d | 1 | 0.89mi |
| 7025 Richwood Ln Hazelwood, MO | 3.0 | 1.0 | 936 | $1,375 | $1.47 | 17d | 1 | 1.00mi |
| 446 Olian Dr Hazelwood, MO | 2.0 | 1.0 | 880 | $975 | $1.11 | 2d | 1 | 1.03mi |
| 116 Graham Rd Florissant, MO | 3.0 | 2.0 | 1578 | $1,495 | $0.95 | 2d | 1 | 1.03mi |
| 5 Santa Cruz Dr Florissant, MO | 2.0 | 1.0 | 1410 | $1,411 | $1.00 | 16d | 1 | 1.06mi |
| 221 Barto Dr Saint Louis, MO | 3.0 | 2.0 | 958 | $1,295 | $1.35 | 20d | 1 | 1.10mi |
| 1180 S New Florissant Rd Florissant, MO | 3.0 | 1.0 | 925 | $1,225 | $1.32 | 23d | 1 | 1.12mi |
| 263 Sadonia Ave Saint Louis, MO | 3.0 | 2.0 | 888 | $1,350 | $1.52 | 43d | 1 | 1.13mi |
| 6698 Amora Ave Berkeley, MO | 2.0–3.0 | 1.5 | 1625 | $1,500 | $0.92 | 43d | 1 | 1.15mi |
| 260 Sadonia Ave Saint Louis, MO | 3.0 | 2.0 | 1088 | $1,623 | $1.49 | 20d | 1 | 1.16mi |
| 8412 Chalons Ct Saint Louis, MO | 3.0 | 1.0 | 1380 | $1,370 | $0.99 | 23d | 1 | 1.16mi |
| 1250 S New Florissant Rd Florissant, MO | 2.0 | 1.0 | 1150 | $1,500 | $1.30 | 14d | 1 | 1.16mi |
| 14 Bruce Dr Unit Bruce 14-4 Florissant, MO | 2.0 | 1.0 | 880 | $975 | $1.11 | 43d | 1 | 1.19mi |
| 13 Bruce Dr Unit Bruce 13-2 Florissant, MO | 2.0 | 1.0 | 880 | $975 | $1.11 | 43d | 1 | 1.20mi |
| 13 Bruce Dr Florissant, MO | 2.0 | 1.0 | 880 | $975 | $1.11 | 23d | 1 | 1.20mi |
| 1455 S New Florissant Rd Florissant, MO | 4.0 | 1.0 | 1584 | $1,721 | $1.09 | 43d | 1 | 1.21mi |
| 8330 Woodhurst Dr Saint Louis, MO | 3.0 | 1.0 | 1120 | $1,000 | $0.89 | 7d | 1 | 1.25mi |
| 785 Florland Dr Florissant, MO | 3.0 | 1.0 | 1100 | $1,700 | $1.55 | 17d | 1 | 1.25mi |
| 532 Holiday Ave Hazelwood, MO | 3.0 | 1.0 | 912 | $1,350 | $1.48 | 43d | 1 | 1.26mi |
| 858 Hazelvalley Dr Hazelwood, MO | 3.0 | 1.5 | 912 | $1,450 | $1.59 | 43d | 1 | 1.26mi |
| 508 Saratoga Ln Hazelwood, MO | 3.0 | 1.0 | 988 | $1,306 | $1.32 | 23d | 1 | 1.31mi |
| 1465 W Duchesne Dr Florissant, MO | 3.0 | 1.0 | 896 | $1,500 | $1.67 | 43d | 1 | 1.31mi |
| 537 Lynn Haven Ln Hazelwood, MO | 3.0 | 2.0 | 1242 | $1,675 | $1.35 | 23d | 1 | 1.33mi |
| 8418 Bayberry Dr Saint Louis, MO | 3.0 | 2.0 | 1288 | $1,350 | $1.05 | 21d | 1 | 1.36mi |
| 1600 Washington St Florissant, MO | 3.0 | 1.5 | 1095 | $1,250 | $1.14 | 20d | 1 | 1.36mi |
| 8437 January Ave Saint Louis, MO | 3.0 | 2.0 | 1288 | $1,350 | $1.05 | 43d | 1 | 1.36mi |
| 36 Connolly Dr Saint Louis, MO | 3.0 | 1.0 | 1024 | $1,149 | $1.12 | 23d | 1 | 1.37mi |
| 1545 Washington St Florissant, MO | 3.0 | 1.5 | 1337 | $2,055 | $1.54 | 3d | 1 | 1.37mi |
| 1280 Saint Catherine St Florissant, MO | 3.0 | 1.0 | 1274 | $1,600 | $1.26 | 14d | 1 | 1.38mi |
| 171 Elbring Dr Saint Louis, MO | 3.0 | 1.5 | 1008 | $1,395 | $1.38 | 12d | 1 | 1.41mi |
| 107 Anistasia Dr Saint Louis, MO | 2.0 | 2.0 | 1030 | $1,400 | $1.36 | 23d | 1 | 1.42mi |
| 153 Bascom Dr Saint Louis, MO | 3.0 | 1.0 | 1076 | $1,195 | $1.11 | 19d | 1 | 1.47mi |
| 8439 Alder Ave Saint Louis, MO | 3.0 | 1.5 | 1176 | $1,425 | $1.21 | 23d | 1 | 1.48mi |
| 11 Anistasia Dr Saint Louis, MO | 3.0 | 1.5 | 1120 | $1,345 | $1.20 | 23d | 1 | 1.48mi |
| 297 Saint Eugene Ln Florissant, MO | 2.0 | 1.0 | 1100 | $1,100 | $1.00 | 43d | 1 | 1.49mi |
HOA detail condo
- Monthly dues
- $380 · $4,560/yr
- Likely covers
- waterelectric
- Assessments
- None detected in remarks — confirm with the listing agent.
Listing history 12 events
-
2026-06-08statusdays on market $83,900 Pending 36 DOM
-
2026-06-07days on market $83,900 Active 35 DOM
-
2026-06-05days on market $83,900 Active 32 DOM
-
2026-06-03days on market $83,900 Active 31 DOM
-
2026-06-02days on market $83,900 Active 30 DOM
-
2026-06-01days on market $83,900 Active 29 DOM
-
2026-05-31days on market $83,900 Active 28 DOM
-
2026-05-18price $88,500 802-char remark
-
2026-05-14price $89,000 802-char remark
-
2026-05-03$89,900 Active 802-char remark
-
1980-07-01soldstatus
-
1979-02-01soldstatus
ⓘ Source: listings_history table (triggers on properties + properties_extension) + one-shot
backfill from property_details.listing_events for pre-trigger history.
Tax reassessment forecast MO · Resets to sale price
- Current annual tax
- $701 · $58/mo
- Projected year-2 tax
- $814 · $68/mo
- Expected delta
- +$113/yr (+$9/mo · 16.1%)
ⓘ Screening estimate from a state-policy table — verify with the county assessor before closing.
Climate risk First Street
- Flood 4/10 Moderate FEMA zone X (unshaded) · 20% chance over 30 yrs
- Wildfire 1/10 Low
- Heat 5/10 Major 7 d/yr ≥105°F today · 22 d/yr by 30 yrs out
- Wind 2/10 Low 100% chance of damaging wind over 30 yrs
- Air quality 3/10 Moderate 3 unhealthy d/yr today · 5 by 30 yrs out
Nearby sold comps map
Loading sold comps map…
Walkable amenities ~0.75 mi
Loading nearby amenities…
Taxation est. · year 1
- Rental income
- $17,327
- − Mortgage interest
- −$4,700
- − Property taxes
- −$701
- − Insurance
- −$420
- − Repairs & maintenance
- −$1,386
- − Management
- −$1,386
- − HOA
- −$4,560
- − Depreciation
- −$2,441
- Taxable income
- $1,733
- Est. tax owed @ 24.0%
- −$416
- After-tax cash flow
- $2,312/yr
For passive investors: Depreciation is non-cash, so a rental often shows a tax loss while cash-flowing — sheltering income. Rental losses are passive: they offset passive income freely, and up to $25,000/yr can offset ordinary (W-2) income if you actively participate and your MAGI is under $100k (phasing out to $0 by $150k); unused losses carry forward. On sale, claimed depreciation is recaptured at up to 25%, and gains may owe capital-gains tax (a 1031 exchange can defer both). Figures are a year-1 estimate at your 24.0% rate — not tax advice; consult a CPA.
Schools (NCES district)
- District
- Ferguson-Florissant R-II
- NCES district ID
- 2912010
- Math proficiency
- 7% ▼ -9.00%
- Reading proficiency
- 20% ▼ -6.00%
- Median HH income
- $44,610
- Composite
- 11.96/100
- National rank
- #9666
- State rank
- #311 of 324 in MO
Livability — Hazelwood
- Score
- 62/100
- State rank
- #395
- US rank
- #16956
Category grades
Schools grade is shown separately in the Schools card above.
Census & demographics
- Census place
- Hazelwood, MO
- County
- Saint Louis County · 888,823 people
- City population
- 17,813
- Metro
- St. Louis, MO-IL
- Population (ZIP)
- 17,813
- Household income
- $49,453
- Rent vs Own
- Severe rent burden
- 766.0
Population outlook (St. Louis County) Hauer SSP2
- Today (2025)
- 1,025,227 people
- By 2030
- 1,028,023 · +0.3%
- By 2040
- 1,020,940 · -0.4%
- By 2050
- 1,007,280 · -1.8%
- By 2075
- 987,277 · -3.7%
- By 2100
- 921,984 · -10.1%
Race, ethnicity, and origin ACS 2023
- Neighborhood character
- Diverse neighborhood (Simpson 0.64)
- Race & ethnicity
- White 46% Black 38% Two or more races 10% Hispanic / Latino 4% Asian 2%
- Common ancestry
- Lithuanian 3% Romanian 1% Italian 1%
- Foreign-born
- 5% · Canada, Vietnam
- Languages at home
- 94% English-only · Spanish 3% Vietnamese 1% Tagalog/Filipino 1%
Political lean MEDSL · St. Louis
- 2024 margin
- Strong D (+23.4) · D 60.8% · R 37.4% · Other 1.7%
- 2008→2024 swing
- +3.5pp toward D · 2008: 19.9pp · 2024: 23.4pp
- All cycles
- 2024: D+23.4 2020: D+24.0 2016: D+16.2 2012: D+13.7 2008: D+19.9
Not yet ingested
- Civics
- —
Market trends
- HPI YoY
- ▼ -204.48%
- Current HPI
- 234.7353
- Rent YoY
- ▲ 4.45%
- Metro
- St. Louis, MO-IL
- State GDP YoY
- ▲ 1.84%
- F500 in state
- 20
Industry mix (Fortune 500 HQ in MO)
| Industry | F500 HQs | Revenue |
|---|---|---|
| Healthcare | 1 | $163B |
|
||
| Insurance | 1 | $21B |
|
||
| Industrial Technology | 1 | $17B |
|
||
| Retail | 1 | $16B |
|
||
| Industrial Distribution | 1 | $10B |
|
||
| Utilities | 1 | $9B |
|
||
Price history
-6.7% since first listed9 events — show timeline
- 2026-06-08 Pending — MARIS as Distributed by MLS Grid
- 2026-05-29 Price Changed $83,900 MARIS as Distributed by MLS Grid
- 2026-05-22 Price Changed $85,000 MARIS as Distributed by MLS Grid
- 2026-05-21 Price Changed $87,900 MARIS as Distributed by MLS Grid
- 2026-05-18 Price Changed $88,500 MARIS as Distributed by MLS Grid
- 2026-05-14 Price Changed $89,000 MARIS as Distributed by MLS Grid
- 2026-05-03 Listed $89,900 MARIS as Distributed by MLS Grid
- 1980-07-01 Sold (Public Records) — Public Records
- 1979-02-01 Sold (Public Records) — Public Records
Property tax history
-0.5%/yrLatest (2022): $701 · +0.6% YoY. Source: county tax records.
Cash-flow waterfall
monthlySold comps — $/sqft
last 12 mo · ≤1 miLoading sold comps…