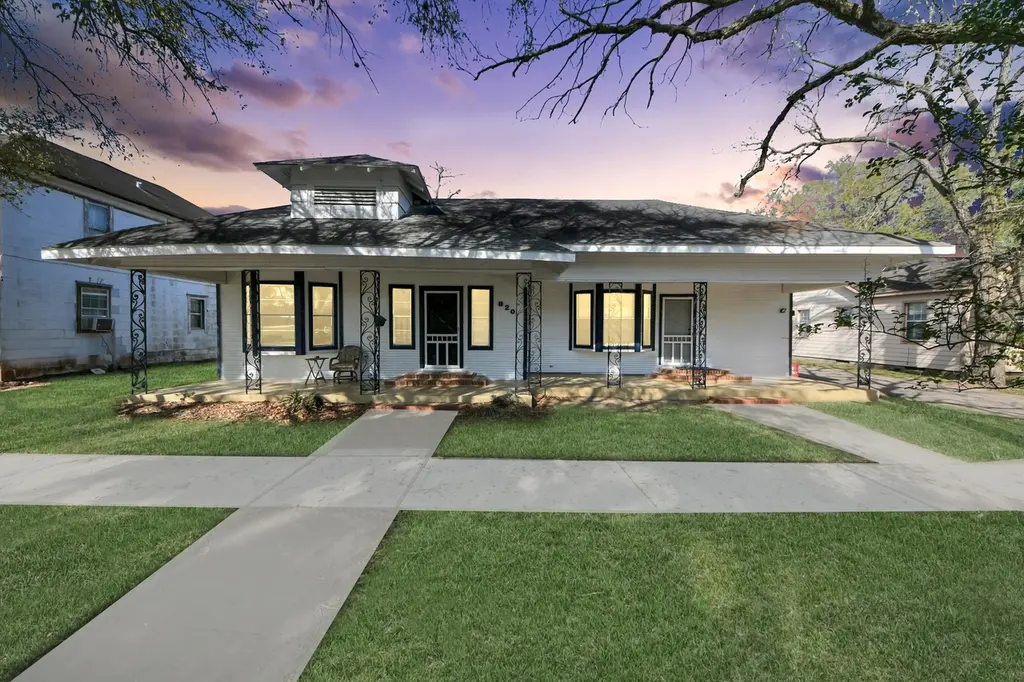
820 6th St · Rosenberg, TX
Flood risk 3/10 · Minor
- FEMA flood zone
- X (unshaded)
- Chance of flooding over 30 yrs
- 0.2%
- Est. flood insurance / yr
- $507 – $1,088
Fire risk 1/10 · Minimal
- Est. fire insurance / yr
- $1,222 – $2,270
Heat risk 9/10 · Severe
- Hot days now (above 110°F)
- 7 days/yr
- Hot days in 30 yrs
- 23 days/yr
Wind risk 9/10 · Severe
- Chance of severe wind over 30 yrs
- 99.0%
Air-quality risk 2/10 · Minimal
- Unhealthy air days now
- 1 days/yr
- Unhealthy air days in 30 yrs
- 1 days/yr
Risk factors via First Street. Map © Google.
Why this score? — see what drove the D grade
The composite is a weighted blend of 9 inputs, each scored 0–100. Each bar is that input's sub-score; the figure is the points it added to the 100-point composite (weight × sub-score).
- Cash flow +14.0/30.0
- ARV discount +7.5/15.0
- Schools +4.6/10.0
- DSCR +4.2/10.0
- 1% rule +3.4/10.0
- Livability +3.1/5.0
- Condition / age +2.5/5.0
- Rent growth +2.3/5.0
- Appreciation +0.0/10.0
$299,990
🖨 Deal sheet 📄 Offer letter ✓ Due diligence
Listing remarks MLS
UNBELIEVABLE Investment Opportunity! GREAT LOCATION in the heart of Downtown Rosenberg. Duplex property with detached rear quarters. 3 separate units and an outdoor storage shed. Recent Improvements and well-manicure grounds. Generous size rooms and spacious living areas. This property is unique and ready for its next owner. This opportunity will not last. HURRY AND CALL YOU REALTOR BEFORE THIS GEM IS GONE!!
Key facts
- 3 separate units
- Duplex property
- Recent improvements
Tags
Neighborhood map
What this means for you Summary
Snapshot
- This is a 4-bed/3.0-bath townhouse listed at $300k.
Deal economics
- At list price, monthly cash flow is $37 ($444/yr) — positive.
- The deal already cash-flows at list — no discount required.
- To meet the 1% rule (rent ≥ 1% of price), the offer needs to be $251k (16.3% below list).
- Recommended offer: $251k (16.3% below list) — sets the bar for 1% rule.
- Cap rate 6.4% vs local median 3.4% in Rosenberg — top-decile yield for the area; either an underpriced asset or a hidden risk that comps aren't pricing in. Stress-test before assuming the spread holds.
Location & tenants
- Location reads 62/100 on livability (#922 in TX) — a middle-class / working-renter tenant base. Strengths: cost of living A+, housing A+, crime B; Watch: schools D-, amenities F, commute F.
- Lamar CISD (suburban): math 50% / reading 53% proficiency, ranked #116 of 826 in TX (top 14%) — acceptable for families but not a draw, mixed tenant base, ~2y average lease.
- Market conditions: Rents soft (-1.0%/yr); 716 active listings in the ZIP; 2 comparable units currently listed for rent nearby; 12,093 units permitted in Fort Bend County in 2024 (815 in 5+ unit buildings).
- This rent runs 41% of the median local income ($73k/yr) — at the standard rent-burdened threshold; future hikes will face affordability resistance.
Forward outlook
- Local home prices are declining (-3.0%/yr); year-one equity from $2k of loan paydown is wiped out by about $9k of value loss. Plan a longer hold.
- Fort Bend County population projected at +75% by 2050 — long-run rental-demand tailwind backs the buy-and-hold thesis.
Negotiation context
- It's been on market 83 days — a 6% lower offer ($282k) is reasonable based on typical stale-listing flexibility.
- 2 sale attempts; this cycle's ask has dropped $25k (8%) from the opening price — seller is motivated, your offer sets the floor, not the list.
Risks & watch-outs
- Watch-outs: built in 1935 — expect roof / HVAC / electrical / plumbing capex.
- Climate carrying-cost: severe wind risk, 99% chance of damaging wind over 30y; extreme-heat days projected 7→23/yr by 2055 (HVAC capex compounding) — expect insurance premiums to compound above CPI over the hold.
Questions for the listing agent
- It's been on market 83 days. Have you received any prior offers? Is the seller open to a 16% concession, seller financing, or rate buy-down credit?
- Built in 1935 — when were the roof, HVAC, electrical panel, plumbing, and water heater last replaced?
- Why hasn't it sold? Are there any deal-killer items the seller is aware of (foundation, flood, title, zoning, code violations)?
- Is there a deadline driving the sale (1031 exchange, divorce, estate, relocation)? That informs how much negotiation room exists.
- Schools are D-rated, which usually means shorter tenancies and higher turnover. Who's the typical renter profile here, and what's been the actual vacancy rate?
- The area grade is low — what's the realistic commute time and amenity access for the typical tenant pool here? Any planned neighborhood developments (good or bad) we should know about?
- What's the average days-on-market for RENTAL listings here right now (not sales)? A rising rental-DOM trend means longer vacancies and softer asking-rent achievability than the comps imply.
- What's the recent tenant-quality profile in this submarket — average credit score on applications, eviction rate, late-payment / NSF rate, and stable-employment percentage? A property-management company in the area should have these aggregated.
- How much new for-sale + rental construction is in the pipeline within 1–3 miles? Heavy new supply typically softens prices + rents 12–24 months out; constrained supply supports both.
Investment metrics
- 1% rule
- 0.84% ✗
- Cap rate
- 6.44%
- Cash-on-cash
- 0.53%
- DSCR
- 1.02
- GRM
- 10.0
CMA / ARV
No comps found within radius.
Projected returns pro-forma
-3.0% appreciation · 0.0% rent growth · sell at horizon
- IRR
- -18.7%
- Equity multiple
- 0.36×
- Total profit
- $-53,658
- Equity at exit
- $44,729
- IRR
- -18.2%
- Equity multiple
- 0.14×
- Total profit
- $-72,301
- Equity at exit
- $25,938
Cash invested: $83,997 (down + closing). Projections, not guarantees.
Landlord ↔ Tenant lean methodology
- Overall (STATE)
- 87 Strongly Landlord-Friendly
- State Texas
- 87 Strongly Landlord-Friendly · R+5
- County
- — inherits STATE
- City
- — inherits STATE
ZIP-level market 77471
- Home prices YoY
- -19.3%
- Rents YoY
- -1.0%
- Active inventory
- 716
- Price-to-rent
- 10.0×
Monthly cashflow live
- Estimated rent
- $2,512 medium interval (Pro) →
- Mortgage (P&I)
- −$1,573
- Tax from tax record
- −$249 /mo · $2,990/yr
- Insurance
- −$125
- HOA
- −$0
- Vacancy / Maint / Mgmt
- −$527
- Net cashflow
- $37
Break-even live
UW: 25.0% down · 7.5% · 30yr · 1.5% tax · 5.0% vac · 8.0% maint · 8.0% mgmt
Financing live
Cash to close
- Down payment
- $74,998
- Closing costs
- $9,000
- Reserves months
- —
- Total cash needed
- —
Loan-product check · same deal, 3 products live
Conventional
25% down · 7.5% · 30yr
- Down + closing
- —
- Monthly P&I
- —
- Monthly cashflow
- —
- DSCR
- —
- Eligible?
- —
Personal DTI + credit; lowest rate.
DSCR
20% down · 8.5% · 30yr
- Down + closing
- —
- Monthly P&I
- —
- Monthly cashflow
- —
- DSCR
- —
- Eligible?
- —
No personal income docs; deal must DSCR.
Hard money
10% down · 12.0% · 12mo
- Down + closing
- —
- Monthly P&I
- —
- Monthly cashflow
- —
- DSCR
- —
- Eligible?
- —
Short-term bridge; refi at stabilization.
Rent comps 2 comps
| Address | Beds | Baths | Sqft | Rent | $/sqft | DOM | Units | Dist |
|---|---|---|---|---|---|---|---|---|
| 1317 Tobola St Rosenberg, TX | 4.0 | 3.0 | 2568 | $2,995 | $1.17 | 5d | 1 | 0.90mi |
| 909 Klare Ave Rosenberg, TX | 3.0 | 2.0 | 1836 | $1,895 | $1.03 | 43d | 1 | 1.16mi |
Listing history 19 events
-
2026-06-18days on market $299,990 Active 83 DOM
-
2026-06-17days on market $299,990 Active 82 DOM
-
2026-06-16days on market $299,990 Active 81 DOM
-
2026-06-15days on market $299,990 Active 80 DOM
-
2026-06-13days on market $299,990 Active 78 DOM
-
2026-06-10days on market $299,990 Active 74 DOM
-
2026-06-08days on market $299,990 Active 73 DOM
-
2026-06-07days on market $299,990 Active 72 DOM
-
2026-06-04days on market $299,990 Active 69 DOM
-
2026-06-03days on market $299,990 Active 68 DOM
-
2026-06-02days on market $299,990 Active 67 DOM
-
2026-06-01days on market $299,990 Active 66 DOM
-
2026-05-31days on market $299,990 Active 65 DOM
-
2026-05-06price $299,990 411-char remark
Show marketing remark (411 chars)
UNBELIEVABLE Investment Opportunity! GREAT LOCATION in the heart of Downtown Rosenberg. Duplex property with detached rear quarters. 3 separate units and an outdoor storage shed. Recent Improvements and well-manicure grounds. Generous size rooms and spacious living areas. This property is unique and ready for its next owner. This opportunity will not last. HURRY AND CALL YOU REALTOR BEFORE THIS GEM IS GONE!!
-
2026-04-07status Active 411-char remark
Show marketing remark (411 chars)
UNBELIEVABLE Investment Opportunity! GREAT LOCATION in the heart of Downtown Rosenberg. Duplex property with detached rear quarters. 3 separate units and an outdoor storage shed. Recent Improvements and well-manicure grounds. Generous size rooms and spacious living areas. This property is unique and ready for its next owner. This opportunity will not last. HURRY AND CALL YOU REALTOR BEFORE THIS GEM IS GONE!!
-
2026-04-01historical 411-char remark
Show marketing remark (411 chars)
UNBELIEVABLE Investment Opportunity! GREAT LOCATION in the heart of Downtown Rosenberg. Duplex property with detached rear quarters. 3 separate units and an outdoor storage shed. Recent Improvements and well-manicure grounds. Generous size rooms and spacious living areas. This property is unique and ready for its next owner. This opportunity will not last. HURRY AND CALL YOU REALTOR BEFORE THIS GEM IS GONE!!
-
2026-03-21$325,000 Active 411-char remark
Show marketing remark (411 chars)
UNBELIEVABLE Investment Opportunity! GREAT LOCATION in the heart of Downtown Rosenberg. Duplex property with detached rear quarters. 3 separate units and an outdoor storage shed. Recent Improvements and well-manicure grounds. Generous size rooms and spacious living areas. This property is unique and ready for its next owner. This opportunity will not last. HURRY AND CALL YOU REALTOR BEFORE THIS GEM IS GONE!!
-
2020-07-30soldstatus
-
2020-07-30soldstatus
ⓘ Source: listings_history table (triggers on properties + properties_extension) + one-shot
backfill from property_details.listing_events for pre-trigger history.
Tax reassessment forecast TX · Resets to sale price
- Current annual tax
- $2,990 · $249/mo
- Projected year-2 tax
- $5,490 · $457/mo
- Expected delta
- +$2,500/yr (+$208/mo · 83.6%)
ⓘ Screening estimate from a state-policy table — verify with the county assessor before closing.
Climate risk First Street
- Flood 3/10 Moderate FEMA zone X (unshaded) · 20% chance over 30 yrs
- Wildfire 1/10 Low
- Heat 9/10 Extreme 7 d/yr ≥110°F today · 23 d/yr by 30 yrs out
- Wind 9/10 Extreme 99% chance of damaging wind over 30 yrs
- Air quality 2/10 Low 1 unhealthy d/yr today · 1 by 30 yrs out
Nearby sold comps map
Loading sold comps map…
Walkable amenities ~0.75 mi
Loading nearby amenities…
Taxation est. · year 1
- Rental income
- $30,142
- − Mortgage interest
- −$16,804
- − Property taxes
- −$2,990
- − Insurance
- −$1,500
- − Repairs & maintenance
- −$2,411
- − Management
- −$2,411
- − Depreciation
- −$8,727
- Taxable loss
- −$4,702
- Est. tax savings @ 24.0%
- +$1,129
- After-tax cash flow
- $1,572/yr
For passive investors: Depreciation is non-cash, so a rental often shows a tax loss while cash-flowing — sheltering income. Rental losses are passive: they offset passive income freely, and up to $25,000/yr can offset ordinary (W-2) income if you actively participate and your MAGI is under $100k (phasing out to $0 by $150k); unused losses carry forward. On sale, claimed depreciation is recaptured at up to 25%, and gains may owe capital-gains tax (a 1031 exchange can defer both). Figures are a year-1 estimate at your 24.0% rate — not tax advice; consult a CPA.
Schools (NCES district)
- District
- Lamar CISD
- NCES district ID
- 4826580
- Math proficiency
- 50% ▼ -12.00%
- Reading proficiency
- 53% ▼ -4.00%
- Median HH income
- $75,213
- Composite
- 46.43/100
- National rank
- #2452
- State rank
- #116 of 826 in TX
Livability — Rosenberg
- Score
- 62/100
- State rank
- #922
- US rank
- #16414
Category grades
Schools grade is shown separately in the Schools card above.
Census & demographics
- Census place
- Rosenberg, TX
- County
- Fort Bend County · 836,777 people
- City population
- 115,151
- Metro
- Houston-The Woodlands-Sugar Land, TX
- Population (ZIP)
- 45,325
- Household income
- $73,186
- Rent vs Own
- Severe rent burden
- 1688.0
Population outlook (Fort Bend County) Hauer SSP2
- Today (2025)
- 1,004,526 people
- By 2030
- 1,153,104 · +14.8%
- By 2040
- 1,453,718 · +44.7%
- By 2050
- 1,753,781 · +74.6%
- By 2075
- 2,455,772 · +144.5%
- By 2100
- 2,930,528 · +191.7%
Race, ethnicity, and origin ACS 2023
- Neighborhood character
- Diverse neighborhood (Simpson 0.61)
- Race & ethnicity
- Hispanic / Latino 56% White 23% Two or more races 21% Black 12% Asian 7%
- Hispanic origin (detail)
- Mexican 46%
- Common ancestry
- Romanian 1% Lithuanian 1% Slovak 1%
- Foreign-born
- 18% · Canada, China, Vietnam
- Languages at home
- 57% English-only · Spanish 35% Tagalog/Filipino 2% Other Indo-European 1%
Political lean MEDSL · Fort Bend
- 2024 margin
- Toss-up / Even · D 49.5% · R 47.9% · Other 2.6%
- 2008→2024 swing
- +4.0pp toward D · 2008: -2.4pp · 2024: 1.6pp
- All cycles
- 2024: D+1.6 2020: D+10.6 2016: D+6.6 2012: R+6.8 2008: R+2.4
Not yet ingested
- Civics
- —
Market trends
- HPI YoY
- ▼ -74.06%
- Current HPI
- 309.5425
- Rent YoY
- ▼ -0.97%
- Metro
- Houston-The Woodlands-Sugar Land, TX
- State GDP YoY
- ▲ 3.95%
- F500 in state
- 110
Industry mix (Fortune 500 HQ in TX)
| Industry | F500 HQs | Revenue |
|---|---|---|
| Energy | 16 | $1,198B |
|
||
| Technology | 5 | $198B |
|
||
| Engineering / Construction | 4 | $72B |
|
||
| Energy Services | 3 | $60B |
|
||
| Utilities | 3 | $41B |
|
||
| Healthcare | 2 | $330B |
|
||
Price history
-7.7% since first listed6 events — show timeline
- 2026-05-06 Price Changed $299,990 HARMLS
- 2026-04-07 Relisted — HARMLS
- 2026-04-01 Listing Removed — HARMLS
- 2026-03-21 Listed $325,000 HARMLS
- 2020-07-30 Sold (Public Records) — Public Records
- 2020-07-30 Sold (Public Records) — Public Records
Property tax history
+1.2%/yrLatest (2025): $2,990 · +1.5% YoY. Source: county tax records.
Cash-flow waterfall
monthlySold comps — $/sqft
last 12 mo · ≤1 miLoading sold comps…