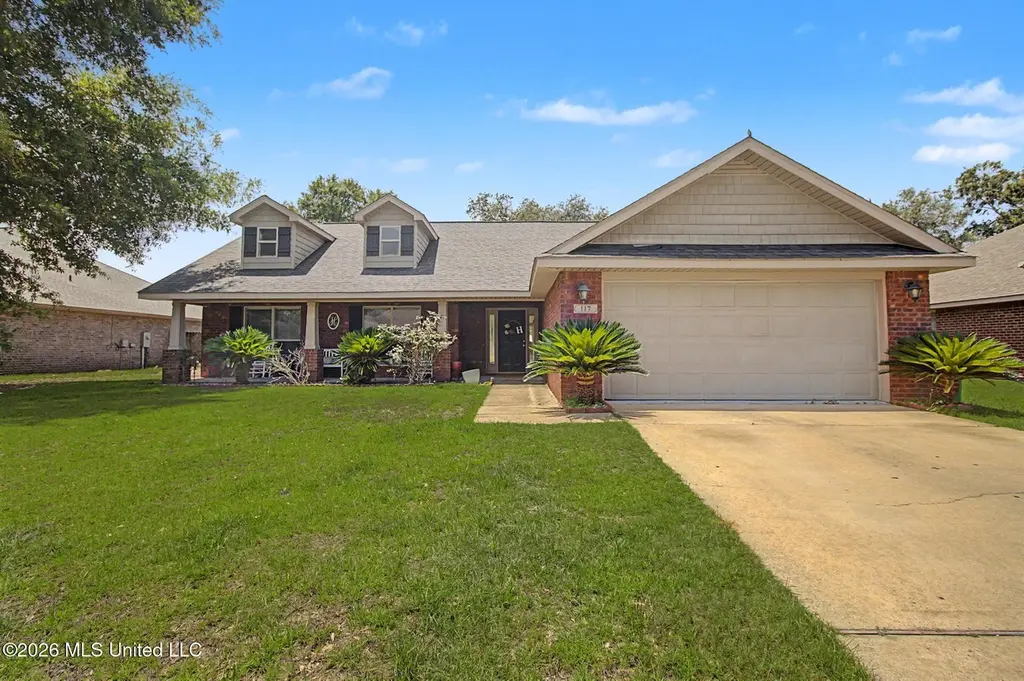
117 Brackish Pl · Gautier, MS
Flood risk 4/10 · Minor
- FEMA flood zone
- X (shaded)
- Chance of flooding over 30 yrs
- 0.22%
- Est. flood insurance / yr
- $507 – $1,088
Fire risk 5/10 · Moderate
- Est. fire insurance / yr
- $1,241 – $2,305
Heat risk 10/10 · Severe
- Hot days now (above 105°F)
- 7 days/yr
- Hot days in 30 yrs
- 25 days/yr
Wind risk 9/10 · Severe
- Chance of severe wind over 30 yrs
- 99.0%
Air-quality risk 2/10 · Minimal
- Unhealthy air days now
- 1 days/yr
- Unhealthy air days in 30 yrs
- 2 days/yr
Risk factors via First Street. Map © Google.
Why this score? — see what drove the C+ grade
The composite is a weighted blend of 9 inputs, each scored 0–100. Each bar is that input's sub-score; the figure is the points it added to the 100-point composite (weight × sub-score).
- Cash flow +23.0/30.0
- ARV discount +13.5/15.0
- DSCR +7.4/10.0
- 1% rule +5.3/10.0
- Schools +5.3/10.0
- Livability +3.3/5.0
- Rent growth +2.8/5.0
- Condition / age +2.5/5.0
- Appreciation +0.0/10.0
$230,000
🖨 Deal sheet 📄 Offer letter ✓ Due diligence
Listing remarks MLS
INSURANCE AVAILABLE NOT IN WIND POOL. NOT IN FLOOD ZONE 30-year Architectural Shingles! ENERGY EFFICIENT!!! 10yr Bondd Builder Warranty! :D
Key facts
- Open-concept layout
- 8,276 sq ft lot
- 2 garage spots
Tags
Property features AI
Finance
- Other: Private above-ground pool
- HOA & community: Homeowners association with annual fee of $250 covering grounds maintenance; Sidewalks in the community
Exterior
- Parking: Attached 2-car garage; Concrete driveway
- Utilities: Public water; Public sewer; Electricity connected; Cable available
- Home design: Single-family house; One level; Move-in ready
- Construction: Brick construction; Architectural shingle roof; Slab foundation
- Exterior features: Front porch; Private yard; Fenced backyard (wood); Shed(s); Level lot
Interior
- Kitchen: Dishwasher; Microwave; Refrigerator; Pantry
- Bedrooms: Primary bedroom on main level
- Flooring: Carpet; Tile; Wood
- Bathrooms: 2 full bathrooms
- Heating & cooling: Central heating (electric); Central air conditioning
- Interior features: Ceiling fans; Pantry; Vaulted ceilings; Walk-in closets; Double vanity
- Laundry & utility: Laundry room inside
Neighborhood map
What this means for you Summary
Snapshot
- This is a 4-bed/2.0-bath single-family listed at $230k.
Deal economics
- At list price, monthly cash flow is $409 ($5k/yr) — positive.
- The deal already cash-flows at list — no discount required.
- Meets the 1% rule at list price ($2k rent vs $230k).
- Cap rate 8.4% vs local median 4.2% in Gautier — top-decile yield for the area; either an underpriced asset or a hidden risk that comps aren't pricing in. Stress-test before assuming the spread holds.
Location & tenants
- Location reads 66/100 on livability (#89 in MS) — a middle-class / working-renter tenant base. Strengths: cost of living A+, housing A+; Watch: health & safety D+, employment D, amenities F.
- Ocean Springs School District (suburban): math 64% / reading 59% proficiency, ranked #1 of 130 in MS (top 1%) — acceptable for families but not a draw, mixed tenant base, ~2y average lease.
- Zoned schools: Magnolia Park Elementary (math 62% / reading 52%, grade C+, #37 of 375 statewide, top 10%, 635 students, 100% FRL); Ocean Springs Middle School (math 66% / reading 61%, grade B+, #3 of 179 statewide, top 2%, 967 students, 100% FRL); Ocean Springs High School (math 77% / reading 64%, grade B+, #1 of 197 statewide, top 0%, 1,899 students, 100% FRL) — zoned schools average 100% FRL vs 33% district-wide (67 pts higher); higher-poverty schools than district average — tighter screening recommended.
- Market conditions: Rents rising (+1.3%/yr); 714 active listings in the ZIP; 9 comparable units currently listed for rent nearby; rentals leasing fast (median 14d on market — plan ~1-2 weeks tenant-placement turnaround); solid renter incomes; 516 units permitted in Jackson County in 2024 (6 in 5+ unit buildings).
- This rent runs 36% of the median local income ($79k/yr) — at the standard rent-burdened threshold; future hikes will face affordability resistance.
Forward outlook
- Local home prices are declining (-3.0%/yr); year-one equity from $2k of loan paydown is wiped out by about $7k of value loss. Plan a longer hold.
Negotiation context
- Only 12 days on market — expect competitive offers; lowballing is unlikely to land.
- 3 sale attempts since 14y ago with the ask held roughly flat each time — persistent listings suggest the price (not the market) is what's stuck; bring a comps-based counter.
Risks & watch-outs
- Climate carrying-cost: severe wind risk, 99% chance of damaging wind over 30y; moderate wildfire risk; extreme-heat days projected 7→25/yr by 2055 (HVAC capex compounding) — expect insurance premiums to compound above CPI over the hold.
Questions for the listing agent
- What does the HOA fee cover, when was the last increase, and are there any pending special assessments or reserve-fund shortfalls?
- Is there a deadline driving the sale (1031 exchange, divorce, estate, relocation)? That informs how much negotiation room exists.
- Schools are D-rated, which usually means shorter tenancies and higher turnover. Who's the typical renter profile here, and what's been the actual vacancy rate?
- What's the average days-on-market for RENTAL listings here right now (not sales)? A rising rental-DOM trend means longer vacancies and softer asking-rent achievability than the comps imply.
- What's the recent tenant-quality profile in this submarket — average credit score on applications, eviction rate, late-payment / NSF rate, and stable-employment percentage? A property-management company in the area should have these aggregated.
- How much new for-sale + rental construction is in the pipeline within 1–3 miles? Heavy new supply typically softens prices + rents 12–24 months out; constrained supply supports both.
Investment metrics
- 1% rule
- 1.03% ✓
- Cap rate
- 8.43%
- Cash-on-cash
- 7.62%
- DSCR
- 1.34
- GRM
- 8.1
CMA / ARV
- ARV (on-the-fly)
- $265,060
- Comps found
- 12
Show comp detail 12 sales within ~0.75 mi
| Address | Dist | Beds/Ba | Sqft | Sold | Price | $/sf | Match |
|---|---|---|---|---|---|---|---|
| 116 Saltmeadow Cir | 0.36mi | 4/2.0 | 1,828 (0%) | 4mo | $250,000 | $137 | 80 |
| 112 Brackish Pl | 0.04mi | 3/2.0 (-1) | 1,731 (-5%) | 6mo | $281,000 | $162 | 79 |
| 6821 Sweetclover Dr | 0.51mi | 4/2.0 | 1,886 (+3%) | 1mo | $269,900 | $143 | 70 |
| 7348 Shearwater Way | 0.57mi | 4/2.0 | 1,835 (+0%) | 8mo | $259,000 | $141 | 66 |
| 63 Saltmeadow Cir | 0.37mi | 3/2.0 (-1) | 1,685 (-8%) | 1mo | $285,000 | $169 | 64 |
| 74 Tantallon Dr | 0.14mi | 3/2.0 (-1) | 1,625 (-11%) | 9mo | $269,900 | $166 | 63 |
| 609 Tantallon Dr | 0.70mi | 3/2.0 (-1) | 1,797 (-2%) | 7mo | $339,900 | $189 | 53 |
| 1236 Spruce St | 0.60mi | 4/3.0 | 1,724 (-6%) | 7mo | $215,000 | $125 | 53 |
| 6911 Pinehurst Dr | 0.70mi | 3/2.0 (-1) | 1,690 (-8%) | 1mo | $245,000 | $145 | 49 |
| 242 Tantallon Dr | 0.60mi | 3/3.0 (-1) | 1,728 (-6%) | 6mo | $299,000 | $173 | 49 |
| 6825 Sweetclover Dr | 0.53mi | 4/2.0 | 2,098 (+15%) | 3mo | $304,999 | $145 | 49 |
| 6896 Sweetclover Dr | 0.75mi | 4/2.0 | 2,094 (+15%) | 3mo | $294,000 | $140 | 38 |
Match score weights: distance 35% · size 25% · config 20% · recency 20%. Top-matched comps best support the ARV.
Projected returns pro-forma
-3.0% appreciation · 1.31% rent growth · sell at horizon
- IRR
- -6.5%
- Equity multiple
- 0.76×
- Total profit
- $-15,238
- Equity at exit
- $34,294
- IRR
- 1.0%
- Equity multiple
- 1.07×
- Total profit
- $4,349
- Equity at exit
- $19,886
Cash invested: $64,400 (down + closing). Projections, not guarantees.
Landlord ↔ Tenant lean methodology
- Overall (STATE)
- 90 Strongly Landlord-Friendly
- State Mississippi
- 90 Strongly Landlord-Friendly · R+11
- County
- — inherits STATE
- City
- — inherits STATE
ZIP-level market 39564
- Home prices YoY
- -26.8%
- Rents YoY
- 1.3%
- Active inventory
- 714
- Price-to-rent
- 8.1×
Monthly cashflow live
- Estimated rent
- $2,376 high interval (Pro) →
- Mortgage (P&I)
- −$1,206
- Tax from tax record
- −$145 /mo · $1,744/yr
- Insurance
- −$96
- HOA
- −$21
- Vacancy / Maint / Mgmt
- −$499
- Net cashflow
- $409
Break-even live
UW: 25.0% down · 7.5% · 30yr · 1.5% tax · 5.0% vac · 8.0% maint · 8.0% mgmt
Financing live
Cash to close
- Down payment
- $57,500
- Closing costs
- $6,900
- Reserves months
- —
- Total cash needed
- —
Loan-product check · same deal, 3 products live
Conventional
25% down · 7.5% · 30yr
- Down + closing
- —
- Monthly P&I
- —
- Monthly cashflow
- —
- DSCR
- —
- Eligible?
- —
Personal DTI + credit; lowest rate.
DSCR
20% down · 8.5% · 30yr
- Down + closing
- —
- Monthly P&I
- —
- Monthly cashflow
- —
- DSCR
- —
- Eligible?
- —
No personal income docs; deal must DSCR.
Hard money
10% down · 12.0% · 12mo
- Down + closing
- —
- Monthly P&I
- —
- Monthly cashflow
- —
- DSCR
- —
- Eligible?
- —
Short-term bridge; refi at stabilization.
Rent comps 9 comps
| Address | Beds | Baths | Sqft | Rent | $/sqft | DOM | Units | Dist |
|---|---|---|---|---|---|---|---|---|
| 413 Sturnidae Cv Ocean Springs, MS | 3.0 | 2.0 | 1676 | $1,900 | $1.13 | 44d | 1 | 0.18mi |
| 62 Tantallon Dr Ocean Springs, MS | 4.0 | 2.0 | 1966 | $2,450 | $1.25 | 13d | 1 | 0.19mi |
| 6453 Chickory Way Ocean Springs, MS | 4.0 | 2.5 | 2516 | $2,500 | $0.99 | 43d | 1 | 0.33mi |
| 1070 Brackish Pl Ocean Springs, MS | 4.0 | 2.5 | 2353 | $2,500 | $1.06 | 13d | 1 | 0.42mi |
| 1208 Carraway Cv Ocean Springs, MS | 4.0 | 3.0 | 2486 | $2,800 | $1.13 | 13d | 1 | 0.45mi |
| 6717 Belle Fontaine Dr Unit 1032111P Ocean Springs, MS | 3.0 | 3.0 | 1991 | $7,902 | $3.97 | 13d | 1 | 0.77mi |
| 1608 Hunt St Ocean Springs, MS | 3.0 | 2.0 | 1550 | $1,700 | $1.10 | 43d | 1 | 0.87mi |
| 8001 Westwood Cir Ocean Springs, MS | 3.0–5.0 | 2.0–3.0 | 1996 | $2,425 | $1.21 | 13d | 1 | 1.15mi |
| 1632 Emerald Lakes Dr Ocean Springs, MS | 3.0–4.0 | 2.0 | 1585 | $2,350 | $1.48 | 13d | 1 | 1.22mi |
HOA detail
- Monthly dues
- $21 · $252/yr
- Likely covers
- pool
Listing history 11 events
-
2026-06-17status $230,000 Pending 12 DOM
-
2026-06-17days on market $230,000 Active 12 DOM
-
2026-06-16days on market $230,000 Active 11 DOM
-
2026-06-15days on market $230,000 Active 10 DOM
-
2026-06-14days on market $230,000 Active 8 DOM
-
2026-06-13days on market $230,000 Active 7 DOM
-
2026-06-10days on market $230,000 Active 5 DOM
-
2026-06-09days on market $230,000 Active 4 DOM
-
2026-06-08days on market $230,000 Active 3 DOM
-
2026-06-07remarks 686-char remark
-
2026-06-07$230,000 Active 2 DOM
ⓘ Source: listings_history table (triggers on properties + properties_extension) + one-shot
backfill from property_details.listing_events for pre-trigger history.
Tax reassessment forecast MS · Resets to sale price
- Current annual tax
- $1,744 · $145/mo
- Projected year-2 tax
- $1,817 · $151/mo
- Expected delta
- +$73/yr (+$6/mo · 4.2%)
ⓘ Screening estimate from a state-policy table — verify with the county assessor before closing.
Climate risk First Street
- Flood 4/10 Moderate FEMA zone X (shaded) · 22% chance over 30 yrs
- Wildfire 5/10 Major
- Heat 10/10 Extreme 7 d/yr ≥105°F today · 25 d/yr by 30 yrs out
- Wind 9/10 Extreme 99% chance of damaging wind over 30 yrs
- Air quality 2/10 Low 1 unhealthy d/yr today · 2 by 30 yrs out
Nearby sold comps map
Loading sold comps map…
Walkable amenities ~0.75 mi
Loading nearby amenities…
Taxation est. · year 1
- Rental income
- $28,515
- − Mortgage interest
- −$12,884
- − Property taxes
- −$1,744
- − Insurance
- −$1,150
- − Repairs & maintenance
- −$2,281
- − Management
- −$2,281
- − HOA
- −$252
- − Depreciation
- −$6,691
- Taxable income
- $1,232
- Est. tax owed @ 24.0%
- −$296
- After-tax cash flow
- $4,611/yr
For passive investors: Depreciation is non-cash, so a rental often shows a tax loss while cash-flowing — sheltering income. Rental losses are passive: they offset passive income freely, and up to $25,000/yr can offset ordinary (W-2) income if you actively participate and your MAGI is under $100k (phasing out to $0 by $150k); unused losses carry forward. On sale, claimed depreciation is recaptured at up to 25%, and gains may owe capital-gains tax (a 1031 exchange can defer both). Figures are a year-1 estimate at your 24.0% rate — not tax advice; consult a CPA.
Schools (NCES district)
- District
- Ocean Springs School District
- NCES district ID
- 2803360
- Math proficiency
- 64% ▼ -3.00%
- Reading proficiency
- 59% ▲ 1.00%
- Median HH income
- $60,485
- Composite
- 53.35/100
- National rank
- #1477
- State rank
- #1 of 130 in MS
Livability — Gautier
- Score
- 66/100
- State rank
- #89
- US rank
- #11250
Category grades
Schools grade is shown separately in the Schools card above.
Census & demographics
- County
- Jackson County · 82,196 people
- City population
- 17,225
- Metro
- Gulfport-Biloxi, MS
- Population (ZIP)
- 43,240
- Household income
- $78,596
- Rent vs Own
- Severe rent burden
- 734.0
Population outlook (Jackson County) Hauer SSP2
- Today (2025)
- 146,926 people
- By 2030
- 148,442 · +1.0%
- By 2040
- 149,631 · +1.8%
- By 2050
- 148,723 · +1.2%
- By 2075
- 147,845 · +0.6%
- By 2100
- 144,510 · -1.6%
Race, ethnicity, and origin ACS 2023
- Neighborhood character
- Predominantly White (74%)
- Race & ethnicity
- White 74% Black 10% Hispanic / Latino 8% Two or more races 7% Asian 4%
- Hispanic origin (detail)
- Mexican 3% Puerto Rican 2%
- Common ancestry
- Lithuanian 5% Slovak 4% Romanian 2%
- Foreign-born
- 5% · Canada, South Korea, Vietnam
- Languages at home
- 93% English-only · Spanish 3% Vietnamese 2% Tagalog/Filipino 1%
Political lean MEDSL · Jackson
- 2024 margin
- Solid R (+39.9) · D 29.5% · R 69.4% · Other 1.1%
- 2008→2024 swing
- -6.4pp toward R · 2008: -33.5pp · 2024: -39.9pp
- All cycles
- 2024: R+39.9 2020: R+34.6 2016: R+39.9 2012: R+36.1 2008: R+33.5
Not yet ingested
- Civics
- —
Market trends
- HPI YoY
- ▼ -74.77%
- Current HPI
- 204.2244
- Rent YoY
- ▲ 1.31%
- Metro
- Gulfport-Biloxi, MS
- State GDP YoY
- —
- F500 in state
- 0
Price history
+49.2% since first listed6 events — show timeline
- 2026-06-05 Listed $230,000 MLSU
- 2026-03-17 Listing Removed — MLSU
- 2026-02-18 Price Changed $249,900 MLSU
- 2026-02-05 Listed $265,000 MLSU
- 2013-03-25 Sold (MLS) — MLSU
- 2012-05-06 Listed $154,200 MLSU
Property tax history
+0.2%/yrLatest (2025): $1,744 · +5.7% YoY. Source: county tax records.
Cash-flow waterfall
monthlySold comps — $/sqft
last 12 mo · ≤1 miLoading sold comps…