 🏷️ Likely Rental
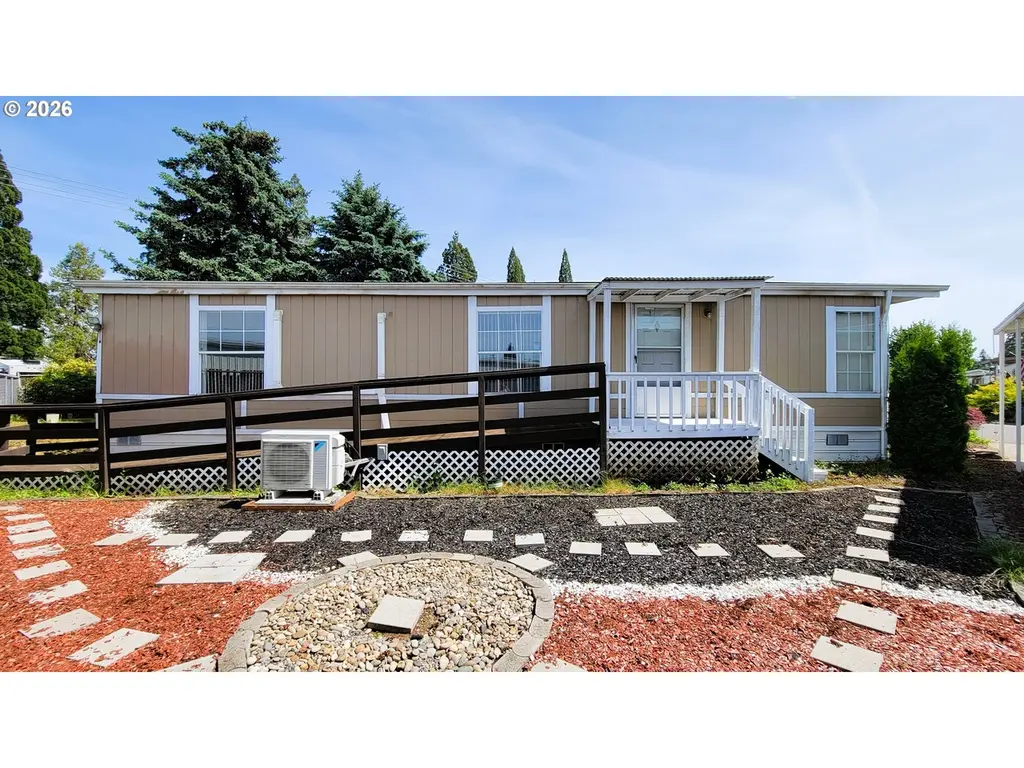
5335 Main St #181 · Springfield, OR
Flood risk 1/10 · Minimal
- FEMA flood zone
- X (unshaded)
- Chance of flooding over 30 yrs
- 0.0%
- Est. flood insurance / yr
- $507 – $1,088
Fire risk 5/10 · Moderate
- Est. fire insurance / yr
- $498 – $926
Heat risk 4/10 · Minor
- Hot days now (above 91°F)
- 7 days/yr
- Hot days in 30 yrs
- 15 days/yr
Wind risk 1/10 · Minimal
- Chance of severe wind over 30 yrs
- —
Air-quality risk 10/10 · Severe
- Unhealthy air days now
- 13 days/yr
- Unhealthy air days in 30 yrs
- 15 days/yr
Risk factors via First Street. Map © Google.
Why this score? — see what drove the B- grade
The composite is a weighted blend of 9 inputs, each scored 0–100. Each bar is that input's sub-score; the figure is the points it added to the 100-point composite (weight × sub-score).
- Cash flow +30.0/30.0
- 1% rule +10.0/10.0
- DSCR +10.0/10.0
- ARV discount +7.5/15.0
- Livability +4.2/5.0
- Rent growth +3.3/5.0
- Condition / age +2.5/5.0
- Schools +2.4/10.0
- Appreciation +0.0/10.0
$45,000
🖨 Deal sheet (PDF) 📄 Offer letter ✓ Due diligence
Listing remarks
Charming home in the lovely 55+ Santiago Estates! This special home features 3 roomy bedrooms, 2 full bathrooms and mini-splits in almost every room to keep you comfy all year round! The primary bedroom includes a large walk-in closet and an attached bath with a walk-in shower. The kitchen offers tons of cabinet space, an eat bar and a dining area. Accessible ramp entry, tool shed with power, NEW water heater, and fenced yard! In the heart of it all, you're just minutes away from shopping, restaurants, and entertainment. Santiago Estates amenities include a seasonal pool and jacuzzi, bocce ball court, putting green, horseshoe pit and a clubhouse with a full gym. Space rent is $1,025/mo. All
Key facts
- Fenced yard
- Walk-in closet
- Bocce ball court
Tags
Property features AI
Finance
- Other: Lot rent: $1,025 monthly; Property type: Residential — Manufactured Home in Park; Not land-lease; No view
- HOA & community: Community: Santiago Estates; Association amenities include athletic court, gym, meeting room, pool, and spa/hot tub; Zoning: R1
Exterior
- Parking: Carport (1 space)
- Utilities: Public water; Public sewer; Electric fuel; Cable internet available
- Home design: Manufactured home in a park (Fleetwood); Single-story; Approximately 1,296 main-level area; Built in 1991; Skirting around foundation; Unit dimensions approx. 48' x 27'
- Construction: Built in 1991; T-111 siding; Composition roof; Skirting foundation
- Exterior features: Fenced yard; Porch; Tool shed; Yard; T-111 siding; Composition roof; Level lot with trees; Paved road access
Interior
- Kitchen: Dishwasher; Free-standing range; Free-standing refrigerator; Eat bar
- Bedrooms: Primary bedroom on main level with attached bathroom and walk-in closet; Second bedroom (main level) with closet; Third bedroom (main level) with closet
- Flooring: Wall-to-wall carpet in living spaces and bedrooms; Laminate flooring in some areas
- Bathrooms: Two full bathrooms, both on the main level; Primary bathroom has a walk-in shower
- Heating & cooling: Forced air heating; Ductless heating option; Mini-split cooling
- Interior features: Ceiling fan(s); Laundry area; Natural lighting; One-level living; Minimal steps; Exterior entry to living area; Walk-in shower; Walk-in closet; Wall-to-wall carpet in multiple rooms; Laminate flooring; Crawl space foundation access; Washer and dryer included
- Laundry & utility: Dedicated laundry room on main level with exterior entry; Washer and dryer included; Hot water: electric
Neighborhood map
What this means for you Summary
Snapshot
- This is a 3-bed/2.0-bath manufactured listed at $45k.
Deal economics
- At list price, monthly cash flow is $1k ($13k/yr) — positive.
- The deal already cash-flows at list — no discount required.
- Meets the 1% rule at list price ($2k rent vs $45k).
- Cap rate 34.7% vs local median 3.0% in Springfield — top-decile yield for the area; either an underpriced asset or a hidden risk that comps aren't pricing in. Stress-test before assuming the spread holds.
Location & tenants
- Location reads 83/100 on livability (#40 in OR, #934 nationally) — a professional / high-income tenant draw. Strengths: amenities A+, commute A+, housing A+; Watch: crime D+, employment D+.
- Springfield SD 19 (suburban): math 19% / reading 38% proficiency, ranked #48 of 58 in OR (top 83%) — low school quality limits family demand, transient renter base, plan for 1-2y turnover.
- Zoned schools: Mt Vernon Elementary School (math 5% / reading 34%, grade F, #366 of 412 statewide, top 91%, 412 students, 63% FRL); Agnes Stewart Middle School (math 16% / reading 36%, grade F, #101 of 128 statewide, top 80%, 513 students, 63% FRL); Thurston High School (math 22% / reading 52%, grade F, #85 of 143 statewide, top 61%, 1,277 students, 65% FRL).
- Market conditions: Rents rising (+3.4%/yr); 263 active listings in the ZIP; 18 comparable units currently listed for rent nearby; rentals at typical pace (median 15d on market — plan ~3-4 weeks tenant-placement turnaround); solid renter incomes; 1,808 units permitted in Lane County in 2024 (972 in 5+ unit buildings).
Forward outlook
- Local home prices are declining (-3.0%/yr); year-one equity from $311 of loan paydown is wiped out by about $1k of value loss. Plan a longer hold.
- Lane County population projected at +15% by 2050 — long-run rental-demand tailwind backs the buy-and-hold thesis.
- At projected returns (-3.0% appreciation + 3.4% rent growth), your $13k cash investment doubles in ~2 years — after that, you're playing with house money.
Negotiation context
- Only 1 days on market — expect competitive offers; lowballing is unlikely to land.
Risks & watch-outs
- Climate carrying-cost: moderate wildfire risk — expect insurance premiums to compound above CPI over the hold.
Questions for the listing agent
- Is there a deadline driving the sale (1031 exchange, divorce, estate, relocation)? That informs how much negotiation room exists.
- Schools are D-rated, which usually means shorter tenancies and higher turnover. Who's the typical renter profile here, and what's been the actual vacancy rate?
- Crime grade is D in this area — have there been break-ins, vandalism, or insurance claims at this property in the last 3 years? What carrier currently insures it and at what premium?
- What's the average days-on-market for RENTAL listings here right now (not sales)? A rising rental-DOM trend means longer vacancies and softer asking-rent achievability than the comps imply.
- What's the recent tenant-quality profile in this submarket — average credit score on applications, eviction rate, late-payment / NSF rate, and stable-employment percentage? A property-management company in the area should have these aggregated.
- How much new for-sale + rental construction is in the pipeline within 1–3 miles? Heavy new supply typically softens prices + rents 12–24 months out; constrained supply supports both.
Investment metrics
- 1% rule
- 3.93% ✓
- Cap rate
- 34.73%
- Cash-on-cash
- 101.56%
- DSCR
- 5.52
- GRM
- 2.1
CMA / ARV
- ARV (on-the-fly)
- $256,608
- Comps found
- 12
Show comp detail 12 sales within ~0.75 mi
| Address | Dist | Beds/Ba | Sqft | Sold | Price | $/sf | Match |
|---|---|---|---|---|---|---|---|
| 5335 Main St #197 | 0.00mi | 2/2.0 (-1) | 1,200 (-7%) | 2mo | $57,000 | $48 | 81 |
| 5660 Daisy St #69 | 0.35mi | 3/2.0 | 1,296 (0%) | 4mo | $295,000 | $228 | 81 |
| 5335 S Main St #155 | 0.00mi | 3/2.0 | 1,188 (-8%) | 8mo | $54,000 | $45 | 79 |
| 5335 Main St #214 | 0.00mi | 3/2.0 | 1,188 (-8%) | 8mo | $74,500 | $63 | 79 |
| 658 S 57th St #81 | 0.33mi | 3/2.0 | 1,344 (+4%) | 4mo | $57,000 | $42 | 75 |
| 205 S 54th St #109 | 0.16mi | 2/2.0 (-1) | 1,236 (-5%) | 9mo | $69,000 | $56 | 73 |
| 5254 Forsythia Dr | 0.27mi | 3/2.0 | 1,440 (+11%) | 3mo | $286,000 | $199 | 66 |
| 569 S 51st Pl | 0.31mi | 3/2.0 | 1,152 (-11%) | 2mo | $275,000 | $239 | 65 |
| 5660 Daisy St #48 | 0.35mi | 2/2.0 (-1) | 1,188 (-8%) | 1mo | $263,000 | $221 | 64 |
| 205 S 54th St #37 | 0.16mi | 3/2.0 | 1,488 (+15%) | 7mo | $57,500 | $39 | 62 |
| 578 S 53rd St | 0.24mi | 2/2.0 (-1) | 1,440 (+11%) | 8mo | $285,000 | $198 | 58 |
| 5089 D St | 0.52mi | 3/2.0 | 1,456 (+12%) | 2mo | $349,000 | $240 | 54 |
Match score weights: distance 35% · size 25% · config 20% · recency 20%. Top-matched comps best support the ARV.
Projected returns pro-forma
-3.0% appreciation · 3.38% rent growth · sell at horizon
- IRR
- —
- Equity multiple
- 5.87×
- Total profit
- $61,343
- Equity at exit
- $6,710
- IRR
- —
- Equity multiple
- 12.42×
- Total profit
- $143,841
- Equity at exit
- $3,891
Cash invested: $12,600 (down + closing). Projections, not guarantees.
Landlord ↔ Tenant lean methodology
- Overall (STATE)
- 28 Tenant-Leaning
- State Oregon
- 28 Tenant-Leaning · D+6
- County
- — inherits STATE
- City
- — inherits STATE
ZIP-level market 97478
- Rents YoY
- 3.4%
- Active inventory
- 263
- Price-to-rent
- 2.1×
Monthly cashflow live
- Estimated rent
- $1,771 high interval (Pro) →
- Mortgage (P&I)
- −$236
- Tax from tax record
- −$78 /mo · $932/yr
- Insurance
- −$19
- HOA
- −$0
- Vacancy / Maint / Mgmt
- −$372
- Net cashflow
- $1,066
Break-even live
Sensitivity live
| Price | -10% $1,092 | -5% $1,079 | +0% $1,066 | +5% $1,054 | +10% $1,041 |
|---|---|---|---|---|---|
| Rent | -10% $926 | -5% $996 | +0% $1,066 | +5% $1,136 | +10% $1,206 |
| Rate | -1.0pp $1,089 | -0.5pp $1,078 | base $1,066 | +0.5pp $1,055 | +1.0pp $1,043 |
UW: 25.0% down · 7.5% · 30yr · 1.5% tax · 5.0% vac · 8.0% maint · 8.0% mgmt
Financing live
Cash to close
- Down payment
- $11,250
- Closing costs
- $1,350
- Reserves months
- —
- Total cash needed
- —
Loan-product check · same deal, 3 products live
Conventional
25% down · 7.5% · 30yr
- Down + closing
- —
- Monthly P&I
- —
- Monthly cashflow
- —
- DSCR
- —
- Eligible?
- —
Personal DTI + credit; lowest rate.
DSCR
20% down · 8.5% · 30yr
- Down + closing
- —
- Monthly P&I
- —
- Monthly cashflow
- —
- DSCR
- —
- Eligible?
- —
No personal income docs; deal must DSCR.
Hard money
10% down · 12.0% · 12mo
- Down + closing
- —
- Monthly P&I
- —
- Monthly cashflow
- —
- DSCR
- —
- Eligible?
- —
Short-term bridge; refi at stabilization.
Rent comps 18 comps
| Address | Beds | Baths | Sqft | Rent | $/sqft | DOM | Units | Dist |
|---|---|---|---|---|---|---|---|---|
| 176 S 53rd St Unit 04 Springfield, OR | 2.0 | 1.5 | 971 | $1,250 | $1.29 | 44d | 1 | 0.10mi |
| 421 S 58th St Unit 00136 Springfield, OR | 2.0 | 1.0 | 1100 | $1,600 | $1.45 | 14d | 1 | 0.50mi |
| 5817 Aster St Apt 3 Springfield, OR | 2.0 | 1.5 | 1000 | $1,295 | $1.29 | 14d | 1 | 0.51mi |
| 4830 Elderberry Loop Springfield, OR | 2.0 | 1.0 | 950 | $1,595 | $1.68 | 44d | 1 | 0.58mi |
| 4885 Aster St Springfield, OR | 2.0 | 1.5 | 1000 | $1,734 | $1.73 | 14d | 18 | 0.64mi |
| 4800 B St Springfield, OR | 2.0 | 2.0 | 968 | $1,662 | $1.72 | 14d | 1 | 0.69mi |
| 5040 E St #1 Springfield, OR | 3.0 | 1.0 | 1000 | $1,895 | $1.90 | 14d | 1 | 0.69mi |
| 5040 E St #12 Springfield, OR | 3.0 | 1.0 | 912 | $1,895 | $2.08 | 44d | 1 | 0.69mi |
| 5040 E St #21 Springfield, OR | 3.0 | 1.0 | 1000 | $1,795 | $1.79 | 14d | 1 | 0.69mi |
| 1012 53rd St Springfield, OR | 3.0 | 2.0 | 1249 | $2,195 | $1.76 | 14d | 1 | 0.81mi |
| 1075 56th Pl Springfield, OR | 3.0 | 1.0 | 904 | $1,795 | $1.99 | 44d | 1 | 0.83mi |
| 274 S 47th St Unit B Springfield, OR | 2.0 | 1.0 | 940 | $1,150 | $1.22 | 22d | 1 | 0.84mi |
| 1152 S 43rd Pl Springfield, OR | 3.0 | 2.5 | 1539 | $2,595 | $1.69 | 14d | 1 | 1.29mi |
| 339 S 42nd St Unit 317 Springfield, OR | 3.0 | 2.5 | 1444 | $1,895 | $1.31 | 14d | 1 | 1.31mi |
| 4173 Glacier View Dr Springfield, OR | 3.0 | 2.5 | 1250 | $2,175 | $1.74 | 14d | 1 | 1.40mi |
| 490 67th St Springfield, OR | 3.0 | 2.0 | 1278 | $2,800 | $2.19 | 44d | 1 | 1.44mi |
| 617 S 41st Ct Unit 610 Springfield, OR | 3.0 | 2.5 | 1500 | $2,050 | $1.37 | 14d | 1 | 1.46mi |
| 617 S 41st Ct Unit 606 Springfield, OR | 3.0 | 2.5 | 1500 | $2,100 | $1.40 | 14d | 1 | 1.46mi |
Listing history 2 events
-
2026-05-22status Pending
-
2026-05-21$45,000 Active
ⓘ Source: listings_history table (triggers on properties + properties_extension) + one-shot
backfill from property_details.listing_events for pre-trigger history.
Tax reassessment forecast OR · Resets to sale price
- Current annual tax
- $932 · $78/mo
- Projected year-2 tax
- $932 · $78/mo
- Expected delta
- $0/yr ($0/mo · 0.0%)
ⓘ Screening estimate from a state-policy table — verify with the county assessor before closing.
Climate risk First Street
- Flood 1/10 Low FEMA zone X (unshaded) · 0% chance over 30 yrs
- Wildfire 5/10 Major
- Heat 4/10 Moderate 7 d/yr ≥91°F today · 15 d/yr by 30 yrs out
- Wind 1/10 Low
- Air quality 10/10 Extreme 13 unhealthy d/yr today · 15 by 30 yrs out
Nearby sold comps map
Loading sold comps map…
Walkable amenities ~0.75 mi
Loading nearby amenities…
Taxation est. · year 1
- Rental income
- $21,246
- − Mortgage interest
- −$2,521
- − Property taxes
- −$932
- − Insurance
- −$225
- − Repairs & maintenance
- −$1,700
- − Management
- −$1,700
- − Depreciation
- −$1,309
- Taxable income
- $12,860
- Est. tax owed @ 24.0%
- −$3,087
- After-tax cash flow
- $9,710/yr
For passive investors: Depreciation is non-cash, so a rental often shows a tax loss while cash-flowing — sheltering income. Rental losses are passive: they offset passive income freely, and up to $25,000/yr can offset ordinary (W-2) income if you actively participate and your MAGI is under $100k (phasing out to $0 by $150k); unused losses carry forward. On sale, claimed depreciation is recaptured at up to 25%, and gains may owe capital-gains tax (a 1031 exchange can defer both). Figures are a year-1 estimate at your 24.0% rate — not tax advice; consult a CPA.
Schools (NCES district)
- District
- Springfield SD 19
- NCES district ID
- 4111670
- Math proficiency
- 19% ▼ -13.00%
- Reading proficiency
- 38% ▼ -10.00%
- Median HH income
- $42,236
- Composite
- 24.14/100
- National rank
- #7746
- State rank
- #48 of 58 in OR
Livability — Springfield
- Score
- 83/100
- State rank
- #40
- US rank
- #934
Category grades
Schools grade is shown separately in the Schools card above.
Census & demographics
- Census place
- Springfield, OR
- County
- Lane County · 310,476 people
- City population
- 76,907
- Metro
- Eugene-Springfield, OR
- Population (ZIP)
- 39,373
- Household income
- $80,086
- Rent vs Own
- Severe rent burden
- 904.0
Population outlook (Lane County) Hauer SSP2
- Today (2025)
- 391,933 people
- By 2030
- 405,860 · +3.6%
- By 2040
- 429,386 · +9.6%
- By 2050
- 452,016 · +15.3%
- By 2075
- 508,825 · +29.8%
- By 2100
- 531,208 · +35.5%
Race, ethnicity, and origin ACS 2023
- Neighborhood character
- Predominantly White (79%)
- Race & ethnicity
- White 79% Hispanic / Latino 12% Two or more races 9% Native American 1% Asian 1%
- Hispanic origin (detail)
- Mexican 9%
- Common ancestry
- Slovak 4% Lithuanian 3% Portuguese 3%
- Foreign-born
- 4% · Canada
- Languages at home
- 94% English-only · Spanish 5% Tagalog/Filipino 1%
Political lean MEDSL · Lane
- 2024 margin
- Strong D (+23.1) · D 60.0% · R 36.9% · Other 3.1%
- 2008→2024 swing
- -4.3pp toward R · 2008: 27.4pp · 2024: 23.1pp
- All cycles
- 2024: D+23.1 2020: D+24.3 2016: D+18.9 2012: D+23.4 2008: D+27.4
Not yet ingested
- Civics
- —
Market trends
- HPI YoY
- ▼ -395.83%
- Current HPI
- 302.9203
- Rent YoY
- ▲ 3.38%
- Metro
- Eugene-Springfield, OR
- State GDP YoY
- ▲ 2.05%
- F500 in state
- 2
Industry mix (Fortune 500 HQ in OR)
| Industry | F500 HQs | Revenue |
|---|---|---|
| Consumer Goods | 1 | $51B |
|
||
Price history
2 events — show timeline
- 2026-05-22 Pending — RMLS
- 2026-05-21 Listed $45,000 RMLS
Property tax history
+4.7%/yrLatest (2025): $932 · +1.6% YoY. Source: county tax records.
Cash-flow waterfall
monthlySold comps — $/sqft
last 12 mo · ≤1 miLoading sold comps…