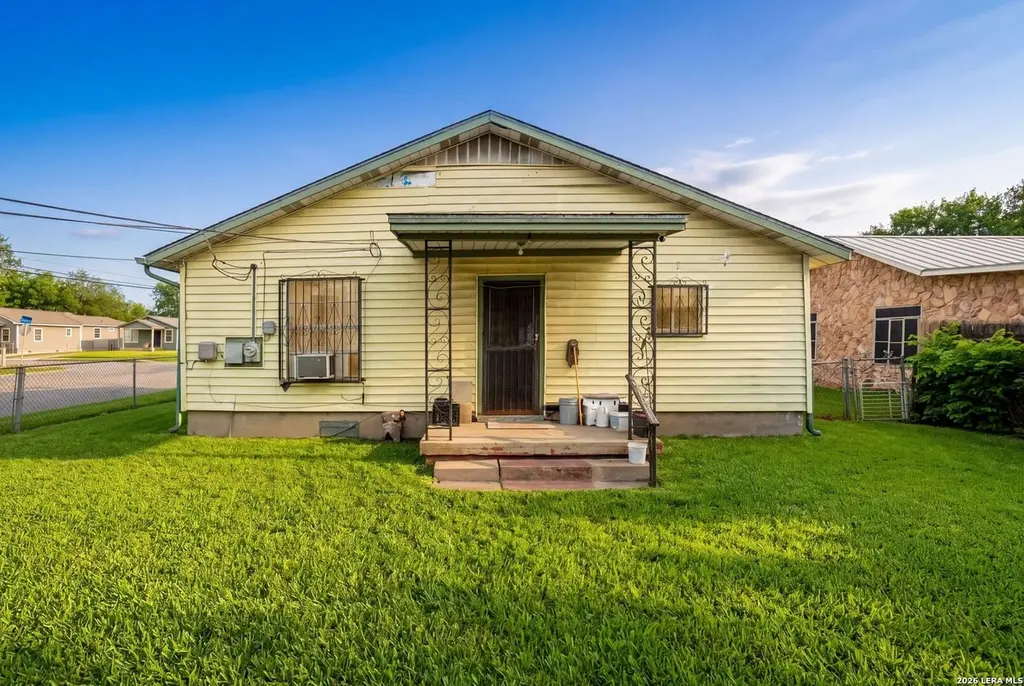
4103 W Salinas St · San Antonio, TX
Flood risk 6/10 · Moderate
- FEMA flood zone
- AE
- Chance of flooding over 30 yrs
- 0.7%
- Est. flood insurance / yr
- $1,737 – $8,500
Fire risk 1/10 · Minimal
- Est. fire insurance / yr
- $1,222 – $2,270
Heat risk 8/10 · Major
- Hot days now (above 109°F)
- 7 days/yr
- Hot days in 30 yrs
- 22 days/yr
Wind risk 6/10 · Moderate
- Chance of severe wind over 30 yrs
- 77.0%
Air-quality risk 2/10 · Minimal
- Unhealthy air days now
- 1 days/yr
- Unhealthy air days in 30 yrs
- 2 days/yr
Risk factors via First Street. Map © Google.
Why this score? — see what drove the B+ grade
The composite is a weighted blend of 9 inputs, each scored 0–100. Each bar is that input's sub-score; the figure is the points it added to the 100-point composite (weight × sub-score).
- Cash flow +23.4/30.0
- ARV discount +15.0/15.0
- Appreciation +10.0/10.0
- 1% rule +8.6/10.0
- DSCR +7.5/10.0
- Rent growth +4.4/5.0
- Livability +4.0/5.0
- Condition / age +2.5/5.0
- Schools +1.4/10.0
$95,000
🖨 Deal sheet (PDF) 📄 Offer letter ✓ Due diligence
Listing remarks MLS
This one story home presents an incredible opportunity for investors or buyers looking to add their personal touch! Being sold as is, this 2 bedroom, 1 bathroom property is full of potential and perfectly positioned in a prime San Antonio location. Just 4 miles from Downtown, the River Walk, and the Alamo, 5 miles from the Pearl, 6 miles from JBSA, and only 10 miles from the Medical Center, you will enjoy convenient access to some of the city's top destinations. Whether you are looking to renovate, rent, or hold, this is a fantastic chance to invest in a rapidly growing area with strong upside potential.
Key facts
- One story home
- Convenient access
- 7,701 sq ft lot
Tags
Neighborhood map
What this means for you Summary
Snapshot
- This is a 2-bed/1.0-bath single-family listed at $95k.
Deal economics
- At list price, monthly cash flow is $-252 ($-3k/yr) — negative.
- To cash-flow at today's rent, offer at most $74k (22.2% below list).
- Meets the 1% rule at list price ($1k rent vs $95k).
- Recommended offer: $74k (22.2% below list) — sets the bar for cash-flow.
- Cap rate 8.5% vs local median 3.8% in San Antonio — top-decile yield for the area; either an underpriced asset or a hidden risk that comps aren't pricing in. Stress-test before assuming the spread holds.
Location & tenants
- Location reads 80/100 on livability (#31 in TX, #1,616 nationally) — a professional / high-income tenant draw. Strengths: amenities A+, commute A+, cost of living A+; Watch: schools C-, crime F.
- San Antonio ISD (urban): math 12% / reading 22% proficiency, ranked #805 of 826 in TX (top 98%) — low school quality limits family demand, transient renter base, plan for 1-2y turnover; 80% free/reduced lunch — lower-income household profile, screen leases tightly.
- Market conditions: Rents rising fast (+7.7%/yr); 165 active listings in the ZIP; 36 comparable units currently listed for rent nearby; rentals at typical pace (median 25d on market — plan ~3-4 weeks tenant-placement turnaround); lower-income renter base — watch delinquency; 8,308 units permitted in Bexar County in 2024 (2,506 in 5+ unit buildings).
- At $1,292/mo this rent would consume 48% of the median local household income ($32k/yr) (locally 2789% of renters already pay >50% of income on rent) — very limited rent-growth headroom before tenants either downsize or default.
Forward outlook
- In year one you build about $10k of equity ($657 loan paydown + $10k appreciation (10.0% local appreciation)).
- Bexar County population projected at +50% by 2050 — long-run rental-demand tailwind backs the buy-and-hold thesis.
- By year 4, paydown + projected appreciation supports a ~$36k cash-out refi (75% LTV) — recoverable capital for the next deal without selling this one.
Negotiation context
- It's been on market 34 days — a 3% lower offer ($92k) is reasonable based on typical stale-listing flexibility.
- 2 sale attempts with the ask held roughly flat each time — persistent listings suggest the price (not the market) is what's stuck; bring a comps-based counter.
Risks & watch-outs
- Watch-outs: property tax is 3.9% of price; flood insurance adds $427/mo; built in 1939 — expect roof / HVAC / electrical / plumbing capex.
- Climate carrying-cost: in FEMA flood zone AE (mandatory federal flood insurance); major wind risk, 77% chance of damaging wind over 30y; extreme-heat days projected 7→22/yr by 2055 (HVAC capex compounding) — expect insurance premiums to compound above CPI over the hold.
Questions for the listing agent
- What do current leases actually rent for vs. the listed asking? Can we see a recent rent roll and the last 12 months of T-12 income?
- It's been on market 34 days. Have you received any prior offers? Is the seller open to a 22% concession, seller financing, or rate buy-down credit?
- Built in 1939 — when were the roof, HVAC, electrical panel, plumbing, and water heater last replaced?
- Property tax is high relative to price — has the assessment been appealed recently, and will the sale trigger a re-assessment?
- What's the actual annual flood-insurance premium (NFIP or private), and is the property in a SFHA with mandatory coverage?
- Is there a deadline driving the sale (1031 exchange, divorce, estate, relocation)? That informs how much negotiation room exists.
- Crime grade is F in this area — have there been break-ins, vandalism, or insurance claims at this property in the last 3 years? What carrier currently insures it and at what premium?
- What's the average days-on-market for RENTAL listings here right now (not sales)? A rising rental-DOM trend means longer vacancies and softer asking-rent achievability than the comps imply.
- What's the recent tenant-quality profile in this submarket — average credit score on applications, eviction rate, late-payment / NSF rate, and stable-employment percentage? A property-management company in the area should have these aggregated.
- How much new for-sale + rental construction is in the pipeline within 1–3 miles? Heavy new supply typically softens prices + rents 12–24 months out; constrained supply supports both.
Investment metrics
- 1% rule
- 1.36% ✓
- Cap rate
- 8.50%
- Cash-on-cash
- 7.89%
- DSCR
- 1.35
- GRM
- 6.1
CMA / ARV
- ARV (median comp)
- $158,689
- List price
- $95,000
- Delta
- -40.13%
- Verdict
- UNDERPRICED
- Comps
- 20 within 1.0 mi
Show comp detail 12 sales within ~0.75 mi
| Address | Dist | Beds/Ba | Sqft | Sold | Price | $/sf | Match |
|---|---|---|---|---|---|---|---|
| 4103 W Salinas St | 0.00mi | 2/1.0 | 1,080 (0%) | 0mo | $95,000 | $88 | 100 |
| 3927 W Houston | 0.14mi | 3/1.0 (+1) | 1,008 (-7%) | 4mo | $146,000 | $145 | 74 |
| 3318 Morales St | 0.24mi | 3/1.0 (+1) | 1,026 (-5%) | 14mo | $160,000 | $156 | 64 |
| 2111 Rivas | 0.61mi | 3/2.0 (+1) | 1,080 (0%) | 1mo | $99,900 | $93 | 62 |
| 3430 Commerce | 0.47mi | 2/1.0 | 1,164 (+8%) | 8mo | $49,500 | $43 | 58 |
| 2027 Ruiz | 0.57mi | 2/1.0 | 952 (-12%) | 11mo | $149,900 | $157 | 44 |
| 3718 W Martin St | 0.44mi | 3/2.0 (+1) | 1,236 (+14%) | 2mo | $90,000 | $73 | 44 |
| 1806 Delgado St | 0.55mi | 3/1.0 (+1) | 1,224 (+13%) | 9mo | $115,000 | $94 | 40 |
| 3326 W Travis | 0.53mi | 3/1.0 (+1) | 1,237 (+14%) | 15mo | $135,000 | $109 | 34 |
| 2218 Leal St | 0.39mi | 3/2.0 (+1) | 1,232 (+14%) | 19mo | $250,000 | $203 | 33 |
| 3523 W Martin | 0.63mi | 3/2.0 (+1) | 1,232 (+14%) | 8mo | $85,000 | $69 | 31 |
| 3507 W Martin St | 0.67mi | 3/2.0 (+1) | 1,212 (+12%) | 16mo | $189,900 | $157 | 26 |
Match score weights: distance 35% · size 25% · config 20% · recency 20%. Top-matched comps best support the ARV.
Projected returns pro-forma
10.0% appreciation · 7.73% rent growth · sell at horizon
- IRR
- 19.1%
- Equity multiple
- 2.60×
- Total profit
- $42,557
- Equity at exit
- $85,584
- IRR
- 19.8%
- Equity multiple
- 6.81×
- Total profit
- $154,512
- Equity at exit
- $184,564
Cash invested: $26,600 (down + closing). Projections, not guarantees.
Landlord ↔ Tenant lean methodology
- Overall (STATE)
- 87 Strongly Landlord-Friendly
- State Texas
- 87 Strongly Landlord-Friendly · R+5
- County
- — inherits STATE
- City
- — inherits STATE
ZIP-level market 78207
- Home prices YoY
- 15.2%
- Rents YoY
- 7.7%
- Active inventory
- 165
- Price-to-rent
- 6.1×
Monthly cashflow live
- Estimated rent
- $1,292 high interval (Pro) →
- Mortgage (P&I)
- −$498
- Tax from tax record
- −$308 /mo · $3,697/yr
- Insurance
- −$40
- Flood insurance flood zone
- −$427 /mo · $5,118/yr
- HOA
- −$0
- Vacancy / Maint / Mgmt
- −$271
- Net cashflow
- $-252
Break-even live
Sensitivity live
| Price | -10% $-198 | -5% $-225 | +0% $-252 | +5% $-278 | +10% $-305 |
|---|---|---|---|---|---|
| Rent | -10% $-354 | -5% $-303 | +0% $-252 | +5% $-201 | +10% $-149 |
| Rate | -1.0pp $-204 | -0.5pp $-227 | base $-252 | +0.5pp $-276 | +1.0pp $-301 |
UW: 25.0% down · 7.5% · 30yr · 1.5% tax · 5.0% vac · 8.0% maint · 8.0% mgmt
Financing live
Cash to close
- Down payment
- $23,750
- Closing costs
- $2,850
- Reserves months
- —
- Total cash needed
- —
Loan-product check · same deal, 3 products live
Conventional
25% down · 7.5% · 30yr
- Down + closing
- —
- Monthly P&I
- —
- Monthly cashflow
- —
- DSCR
- —
- Eligible?
- —
Personal DTI + credit; lowest rate.
DSCR
20% down · 8.5% · 30yr
- Down + closing
- —
- Monthly P&I
- —
- Monthly cashflow
- —
- DSCR
- —
- Eligible?
- —
No personal income docs; deal must DSCR.
Hard money
10% down · 12.0% · 12mo
- Down + closing
- —
- Monthly P&I
- —
- Monthly cashflow
- —
- DSCR
- —
- Eligible?
- —
Short-term bridge; refi at stabilization.
Rent comps 36 comps
| Address | Beds | Baths | Sqft | Rent | $/sqft | DOM | Units | Dist |
|---|---|---|---|---|---|---|---|---|
| 3918 W Martin St San Antonio, TX | 3.0 | 1.0 | 1200 | $1,300 | $1.08 | 25d | 1 | 0.26mi |
| 2503 Arbor Pl San Antonio, TX | 2.0 | 1.0 | 750 | $800 | $1.07 | 44d | 1 | 0.43mi |
| 122 Collins Ct San Antonio, TX | 2.0 | 1.0 | 927 | $1,150 | $1.24 | 23d | 1 | 0.51mi |
| 234 Gould St Unit 102 San Antonio, TX | 2.0 | 1.5 | 948 | $1,195 | $1.26 | 5d | 1 | 0.78mi |
| 3038 W Salinas Unit 101 San Antonio, TX | 3.0 | 2.5 | 1149 | $1,550 | $1.35 | 5d | 1 | 0.86mi |
| 1545 Ruiz St San Antonio, TX | 2.0 | 2.0 | 1020 | $935 | $0.92 | 44d | 1 | 0.89mi |
| 1230 Rivas St San Antonio, TX | 3.0 | 2.5 | 1287 | $1,999 | $1.55 | 25d | 1 | 0.89mi |
| 1231 Rivas St Unit 102 San Antonio, TX | 3.0 | 2.0 | 1120 | $1,299 | $1.16 | 44d | 1 | 0.90mi |
| 1407 Leal St Unit 3 San Antonio, TX | 1.0 | 1.0 | 1312 | $800 | $0.61 | 44d | 1 | 0.95mi |
| 206 Roberts St Unit 201 San Antonio, TX | 3.0 | 2.0 | 1100 | $1,350 | $1.23 | 25d | 1 | 0.97mi |
| 214 Aztec St San Antonio, TX | 3.0 | 2.0 | 973 | $1,275 | $1.31 | 16d | 1 | 1.03mi |
| 2721 Colima St San Antonio, TX | 2.0 | 1.0 | 700 | $1,250 | $1.79 | 16d | 1 | 1.07mi |
| 2425 Monterey St San Antonio, TX | 3.0 | 2.0 | 1416 | $2,000 | $1.41 | 44d | 1 | 1.09mi |
| 2619 W Houston St San Antonio, TX | 3.0 | 1.0 | 776 | $1,800 | $2.32 | 44d | 1 | 1.11mi |
| 2812 Vera Cruz San Antonio, TX | 1.0 | 2.0 | 1060 | $1,200 | $1.13 | 5d | 1 | 1.13mi |
| 1706 Texas Ave San Antonio, TX | 2.0 | 2.0 | 1204 | $1,500 | $1.25 | 44d | 1 | 1.16mi |
| 1706 Texas Ave San Antonio, TX | 2.0 | 2.0 | 1204 | $1,500 | $1.25 | 25d | 1 | 1.16mi |
| 1823 San Carlos St San Antonio, TX | 3.0 | 2.0 | 1090 | $1,099 | $1.01 | 3d | 1 | 1.17mi |
| 2148 Texas Ave San Antonio, TX | 3.0 | 1.0 | 1131 | $1,375 | $1.22 | 25d | 1 | 1.21mi |
| 230 Micklejohn St San Antonio, TX | 3.0 | 2.0 | 1368 | $1,595 | $1.17 | 25d | 1 | 1.25mi |
| 230 Micklejohn St San Antonio, TX | 3.0 | 2.0 | 1368 | $1,695 | $1.24 | 44d | 1 | 1.25mi |
| 2311 Potosi St San Antonio, TX | 3.0 | 1.0 | 864 | $1,600 | $1.85 | 44d | 1 | 1.25mi |
| 2120 Monterey St Unit 102 San Antonio, TX | 2.0 | 2.0 | 1220 | $1,490 | $1.22 | 44d | 1 | 1.30mi |
| 2120 Monterey St Unit 102 San Antonio, TX | 2.0 | 2.0 | 1220 | $1,450 | $1.19 | 12d | 1 | 1.30mi |
| 2313 Texas Ave San Antonio, TX | 3.0 | 1.0 | 1309 | $1,400 | $1.07 | 45d | 1 | 1.36mi |
| 614 N Sabinas St San Antonio, TX | 3.0 | 2.0 | 930 | $1,249 | $1.34 | 5d | 1 | 1.39mi |
| 2331 Cincinnati Ave Unit 2345 04 San Antonio, TX | 1.0 | 1.0 | 750 | $900 | $1.20 | 4d | 1 | 1.42mi |
| 2331 Cincinnati Ave Unit 2345 03 San Antonio, TX | 3.0 | 1.0 | 950 | $1,300 | $1.37 | 4d | 1 | 1.43mi |
| 2331 Cincinnati Ave San Antonio, TX | 1.0–3.0 | 1.0 | 850 | $1,100 | $1.29 | 13d | 3 | 1.44mi |
| 811 Rivas St San Antonio, TX | 3.0 | 2.0 | 1276 | $1,580 | $1.24 | 25d | 1 | 1.44mi |
| 2718 W Craig Pl San Antonio, TX | 2.0 | 1.0 | 1004 | $1,350 | $1.34 | 12d | 1 | 1.46mi |
| 2718 W Craig Pl San Antonio, TX | 2.0 | 1.0 | 1004 | $1,350 | $1.34 | 13d | 1 | 1.46mi |
| 2426 Cincinnati Ave San Antonio, TX | 2.0 | 1.0 | 700 | $975 | $1.39 | 25d | 1 | 1.47mi |
| 3156 W French Pl San Antonio, TX | 2.0 | 2.0 | 1100 | $1,150 | $1.05 | 44d | 1 | 1.47mi |
| 2607 W Craig Pl San Antonio, TX | 3.0 | 1.0 | 1312 | $1,475 | $1.12 | 25d | 1 | 1.48mi |
| 707 Tulane Dr San Antonio, TX | 2.0 | 1.5 | 1500 | $1,550 | $1.03 | 44d | 1 | 1.49mi |
Listing history 3 events
-
2026-05-06status Back on Market 611-char remark
Show marketing remark (611 chars)
This one story home presents an incredible opportunity for investors or buyers looking to add their personal touch! Being sold as is, this 2 bedroom, 1 bathroom property is full of potential and perfectly positioned in a prime San Antonio location. Just 4 miles from Downtown, the River Walk, and the Alamo, 5 miles from the Pearl, 6 miles from JBSA, and only 10 miles from the Medical Center, you will enjoy convenient access to some of the city's top destinations. Whether you are looking to renovate, rent, or hold, this is a fantastic chance to invest in a rapidly growing area with strong upside potential.
-
2026-05-01historical Active Option 611-char remark
Show marketing remark (611 chars)
This one story home presents an incredible opportunity for investors or buyers looking to add their personal touch! Being sold as is, this 2 bedroom, 1 bathroom property is full of potential and perfectly positioned in a prime San Antonio location. Just 4 miles from Downtown, the River Walk, and the Alamo, 5 miles from the Pearl, 6 miles from JBSA, and only 10 miles from the Medical Center, you will enjoy convenient access to some of the city's top destinations. Whether you are looking to renovate, rent, or hold, this is a fantastic chance to invest in a rapidly growing area with strong upside potential.
-
2026-04-21$95,000 New 611-char remark
Show marketing remark (611 chars)
This one story home presents an incredible opportunity for investors or buyers looking to add their personal touch! Being sold as is, this 2 bedroom, 1 bathroom property is full of potential and perfectly positioned in a prime San Antonio location. Just 4 miles from Downtown, the River Walk, and the Alamo, 5 miles from the Pearl, 6 miles from JBSA, and only 10 miles from the Medical Center, you will enjoy convenient access to some of the city's top destinations. Whether you are looking to renovate, rent, or hold, this is a fantastic chance to invest in a rapidly growing area with strong upside potential.
ⓘ Source: listings_history table (triggers on properties + properties_extension) + one-shot
backfill from property_details.listing_events for pre-trigger history.
Tax reassessment forecast TX · Resets to sale price
- Current annual tax
- $3,697 · $308/mo
- Projected year-2 tax
- $3,697 · $308/mo
- Expected delta
- $0/yr ($0/mo · 0.0%)
ⓘ Screening estimate from a state-policy table — verify with the county assessor before closing.
Climate risk First Street
- Flood 6/10 Major FEMA zone AE · 70% chance over 30 yrs
- Wildfire 1/10 Low
- Heat 8/10 Severe 7 d/yr ≥109°F today · 22 d/yr by 30 yrs out
- Wind 6/10 Major 77% chance of damaging wind over 30 yrs
- Air quality 2/10 Low 1 unhealthy d/yr today · 2 by 30 yrs out
Nearby sold comps map
Loading sold comps map…
Walkable amenities ~0.75 mi
Loading nearby amenities…
Taxation est. · year 1
- Rental income
- $15,507
- − Mortgage interest
- −$5,321
- − Property taxes
- −$3,697
- − Insurance
- −$5,594
- − Repairs & maintenance
- −$1,241
- − Management
- −$1,241
- − Depreciation
- −$2,764
- Taxable loss
- −$4,350
- Est. tax savings @ 24.0%
- +$1,044
- After-tax cash flow
- $-1,975/yr
For passive investors: Depreciation is non-cash, so a rental often shows a tax loss while cash-flowing — sheltering income. Rental losses are passive: they offset passive income freely, and up to $25,000/yr can offset ordinary (W-2) income if you actively participate and your MAGI is under $100k (phasing out to $0 by $150k); unused losses carry forward. On sale, claimed depreciation is recaptured at up to 25%, and gains may owe capital-gains tax (a 1031 exchange can defer both). Figures are a year-1 estimate at your 24.0% rate — not tax advice; consult a CPA.
Schools (NCES district)
- District
- San Antonio ISD
- NCES district ID
- 4838730
- Math proficiency
- 12% ▼ -21.00%
- Reading proficiency
- 22% ▼ -7.00%
- Median HH income
- $30,952
- Composite
- 13.57/100
- National rank
- #9512
- State rank
- #805 of 826 in TX
Livability — San Antonio
- Score
- 80/100
- State rank
- #31
- US rank
- #1616
Category grades
Schools grade is shown separately in the Schools card above.
Census & demographics
- Census place
- San Antonio, TX
- County
- Bexar County · 1,990,555 people
- City population
- 1,806,925
- Metro
- San Antonio-New Braunfels, TX
- Population (ZIP)
- 55,474
- Household income
- $32,472
- Rent vs Own
- Severe rent burden
- 2789.0
Population outlook (Bexar County) Hauer SSP2
- Today (2025)
- 2,336,851 people
- By 2030
- 2,560,728 · +9.6%
- By 2040
- 3,020,569 · +29.3%
- By 2050
- 3,493,522 · +49.5%
- By 2075
- 4,668,459 · +99.8%
- By 2100
- 5,533,242 · +136.8%
Race, ethnicity, and origin ACS 2023
- Neighborhood character
- Predominantly Hispanic (88%)
- Race & ethnicity
- Hispanic / Latino 88% Two or more races 41% White 6% Black 5% Native American 2%
- Hispanic origin (detail)
- Mexican 79%
- Foreign-born
- 19% · Canada
- Languages at home
- 39% English-only · Spanish 60%
Political lean MEDSL · Bexar
- 2024 margin
- Lean D (+9.8) · D 54.3% · R 44.6% · Other 1.1%
- 2008→2024 swing
- +4.2pp toward D · 2008: 5.6pp · 2024: 9.8pp
- All cycles
- 2024: D+9.8 2020: D+18.2 2016: D+13.5 2012: D+4.6 2008: D+5.6
Not yet ingested
- Civics
- —
Market trends
- HPI YoY
- ▲ 34.92%
- Current HPI
- 264.7559
- Rent YoY
- ▲ 7.73%
- Metro
- San Antonio-New Braunfels, TX
- State GDP YoY
- ▲ 3.95%
- F500 in state
- 110
Industry mix (Fortune 500 HQ in TX)
| Industry | F500 HQs | Revenue |
|---|---|---|
| Energy | 16 | $1,198B |
|
||
| Technology | 5 | $198B |
|
||
| Engineering / Construction | 4 | $72B |
|
||
| Energy Services | 3 | $60B |
|
||
| Utilities | 3 | $41B |
|
||
| Healthcare | 2 | $330B |
|
||
Price history
3 events — show timeline
- 2026-05-06 Relisted — LERA
- 2026-05-01 Contingent — LERA
- 2026-04-21 Listed $95,000 LERA
Property tax history
+6.2%/yrLatest (2025): $3,697 · -7.8% YoY. Source: county tax records.
Cash-flow waterfall
monthlySold comps — $/sqft
last 12 mo · ≤1 miLoading sold comps…