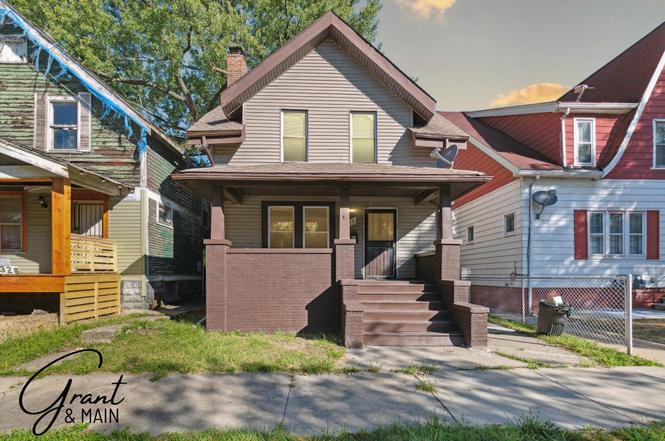
326 Eason Ave · Highland Park, MI
Flood risk 3/10 · Minor
- FEMA flood zone
- X (unshaded)
- Chance of flooding over 30 yrs
- 0.2%
- Est. flood insurance / yr
- $473 – $860
Fire risk 1/10 · Minimal
- Est. fire insurance / yr
- $784 – $1,456
Heat risk 3/10 · Minor
- Hot days now (above 97°F)
- 7 days/yr
- Hot days in 30 yrs
- 14 days/yr
Wind risk 2/10 · Minimal
- Chance of severe wind over 30 yrs
- —
Air-quality risk 4/10 · Minor
- Unhealthy air days now
- 4 days/yr
- Unhealthy air days in 30 yrs
- 6 days/yr
Risk factors via First Street. Map © Google.
Why this score? — see what drove the C+ grade
The composite is a weighted blend of 9 inputs, each scored 0–100. Each bar is that input's sub-score; the figure is the points it added to the 100-point composite (weight × sub-score).
- Cash flow +30.0/30.0
- DSCR +10.0/10.0
- 1% rule +8.2/10.0
- Schools +5.0/10.0
- Livability +3.7/5.0
- Rent growth +2.5/5.0
- Condition / age +2.5/5.0
- ARV discount +0.0/15.0
- Appreciation +0.0/10.0
$105,000
🖨 Deal sheet 📄 Offer letter ✓ Due diligence
Listing remarks MLS
Welcome to this updated 3-bedroom, 1-bath home offering classic character, recent improvements, and immediate move-in potential. Recent exterior updates include soffit and fascia repairs, tuckpointing, chimney flashing and cap replacement, siding repairs, porch improvements, and select replacement windows. These updates provide added peace of mind and strong value for the next owner, as many major exterior repairs are already completed. Inside, you'll find fresh paint throughout, all new blinds, luxury vinyl plank flooring in the kitchen and bathroom, and an updated tub surround. The spacious living room features beautiful original hardwood floors and abundant natural light, while the kitchen offers updated finishes and ample cabinet space. Three generously sized bedrooms and a refreshed full bath complete the home's functional layout. Whether you're a first-time buyer looking for an affordable place to call home or an investor seeking a turnkey rental opportunity.
Key facts
- Tuckpointing
- Chimney flashing
- Siding repairs
Tags
Property features AI
Exterior
- Utilities: Public water; Natural gas water heater
- Home design: Single-family residence; Residential property; Other architectural style
- Construction: Built in 1915; Asphalt roof; Other construction materials
- Exterior features: Paved road access; Lot size about 0.07 acres
Interior
- Kitchen: Kitchen
- Bedrooms: Primary bedroom; Bedroom 2; Bedroom 3
- Bathrooms: One full bathroom
- Heating & cooling: Forced air heating; Has cooling
- Interior features: Replacement windows; Fireplace; Seven total rooms
- Laundry & utility: Full basement
Neighborhood map
What this means for you Summary
Snapshot
- This is a 3-bed/1.0-bath single-family listed at $105k.
Deal economics
- At list price, monthly cash flow is $396 ($5k/yr) — positive.
- The deal already cash-flows at list — no discount required.
- Meets the 1% rule at list price ($1k rent vs $105k).
- Cap rate 10.8% vs local median 14.2% in Highland Park — below-typical yield; the buyer is paying a premium for something (appreciation thesis, condition, location) that the cap rate doesn't capture.
Location & tenants
- Location reads 73/100 on livability (#214 in MI) — a middle-class / working-renter tenant base. Strengths: commute A+, cost of living A+, housing A+; Watch: schools F, crime F, employment F.
- Market conditions: 216 active listings in the ZIP; 28 comparable units currently listed for rent nearby; rentals lingering (median 44d on market — plan ~5-8 weeks vacancy on turnover, expect pricing pressure); 50% of comp listings sitting > 30 days — soft ceiling on asking rent; lower-income renter base — watch delinquency; 2,639 units permitted in Wayne County in 2024 (1,216 in 5+ unit buildings).
- This rent runs 43% of the median local income ($38k/yr) — at the standard rent-burdened threshold; future hikes will face affordability resistance.
Forward outlook
- Local home prices are declining (-3.0%/yr); year-one equity from $726 of loan paydown is wiped out by about $3k of value loss. Plan a longer hold.
- Wayne County population projected at -17% by 2050 — secular population decline; favor cash flow + early exit over multi-decade hold.
- At projected returns (-3.0% appreciation + 3.0% rent growth), your $29k cash investment doubles in ~8 years — after that, you're playing with house money.
Negotiation context
- Only 3 days on market — expect competitive offers; lowballing is unlikely to land.
- 10 sale attempts since 19y ago with the ask held roughly flat each time — persistent listings suggest the price (not the market) is what's stuck; bring a comps-based counter.
- Current owner paid $37k; list at $105k implies a 184% gain — meaningful room to come down on a strong offer.
Risks & watch-outs
- Watch-outs: built in 1915 — expect roof / HVAC / electrical / plumbing capex.
Questions for the listing agent
- Built in 1915 — when were the roof, HVAC, electrical panel, plumbing, and water heater last replaced?
- Is there a deadline driving the sale (1031 exchange, divorce, estate, relocation)? That informs how much negotiation room exists.
- Schools are F-rated, which usually means shorter tenancies and higher turnover. Who's the typical renter profile here, and what's been the actual vacancy rate?
- Crime grade is F in this area — have there been break-ins, vandalism, or insurance claims at this property in the last 3 years? What carrier currently insures it and at what premium?
- What's the average days-on-market for RENTAL listings here right now (not sales)? A rising rental-DOM trend means longer vacancies and softer asking-rent achievability than the comps imply.
- What's the recent tenant-quality profile in this submarket — average credit score on applications, eviction rate, late-payment / NSF rate, and stable-employment percentage? A property-management company in the area should have these aggregated.
- How much new for-sale + rental construction is in the pipeline within 1–3 miles? Heavy new supply typically softens prices + rents 12–24 months out; constrained supply supports both.
Investment metrics
- 1% rule
- 1.32% ✓
- Cap rate
- 10.82%
- Cash-on-cash
- 16.18%
- DSCR
- 1.72
- GRM
- 6.3
CMA / ARV
- ARV (on-the-fly)
- $70,336
- Comps found
- 12
Show comp detail 12 sales within ~0.75 mi
| Address | Dist | Beds/Ba | Sqft | Sold | Price | $/sf | Match |
|---|---|---|---|---|---|---|---|
| 241 Moss St | 0.20mi | 3/1.0 | 1,300 (+4%) | 3mo | $172,500 | $133 | 83 |
| 326 Eason St | 0.00mi | 3/1.0 | 1,256 (0%) | 23mo | $37,000 | $29 | 81 |
| 16570 Inverness St | 0.42mi | 4/2.0 (+1) | 1,300 (+4%) | 3mo | $120,000 | $92 | 63 |
| 361 Pilgrim St | 0.22mi | 2/1.0 (-1) | 1,368 (+9%) | 10mo | $8,000 | $6 | 62 |
| 220 Moss St | 0.22mi | 3/1.5 | 1,379 (+10%) | 12mo | $186,000 | $135 | 62 |
| 50 Eason St | 0.52mi | 3/1.5 | 1,162 (-8%) | 1mo | $47,500 | $41 | 60 |
| 16177 Inverness St | 0.42mi | 3/1.0 | 1,404 (+12%) | 4mo | $70,000 | $50 | 58 |
| 165 Geneva St | 0.33mi | 3/2.0 | 1,283 (+2%) | 24mo | $109,900 | $86 | 57 |
| 15877 Baylis St | 0.51mi | 3/1.0 | 1,400 (+12%) | 5mo | $71,000 | $51 | 53 |
| 16157 Linwood St | 0.68mi | 3/1.0 | 1,346 (+7%) | 16mo | $76,000 | $56 | 43 |
| 15512 Log Cabin St | 0.52mi | 3/1.5 | 1,122 (-11%) | 19mo | $17,000 | $15 | 40 |
| 16177 Linwood St | 0.68mi | 3/1.0 | 1,439 (+15%) | 23mo | $149,000 | $104 | 25 |
Match score weights: distance 35% · size 25% · config 20% · recency 20%. Top-matched comps best support the ARV.
Projected returns pro-forma
-3.0% appreciation · 3.0% rent growth · sell at horizon
- IRR
- 7.2%
- Equity multiple
- 1.28×
- Total profit
- $8,230
- Equity at exit
- $15,656
- IRR
- 16.5%
- Equity multiple
- 2.35×
- Total profit
- $39,683
- Equity at exit
- $9,078
Cash invested: $29,400 (down + closing). Projections, not guarantees.
Landlord ↔ Tenant lean methodology
- Overall (STATE)
- 62 Landlord-Friendly
- State Michigan
- 62 Landlord-Friendly · EVEN
- County
- — inherits STATE
- City
- — inherits STATE
ZIP-level market 48203
- Home prices YoY
- -23.3%
- Active inventory
- 216
- Price-to-rent
- 6.3×
Monthly cashflow live
- Estimated rent
- $1,385 high interval (Pro) →
- Mortgage (P&I)
- −$551
- Tax from tax record
- −$104 /mo · $1,244/yr
- Insurance
- −$44
- HOA
- −$0
- Vacancy / Maint / Mgmt
- −$291
- Net cashflow
- $396
Break-even live
UW: 25.0% down · 7.5% · 30yr · 1.5% tax · 5.0% vac · 8.0% maint · 8.0% mgmt
Financing live
Cash to close
- Down payment
- $26,250
- Closing costs
- $3,150
- Reserves months
- —
- Total cash needed
- —
Loan-product check · same deal, 3 products live
Conventional
25% down · 7.5% · 30yr
- Down + closing
- —
- Monthly P&I
- —
- Monthly cashflow
- —
- DSCR
- —
- Eligible?
- —
Personal DTI + credit; lowest rate.
DSCR
20% down · 8.5% · 30yr
- Down + closing
- —
- Monthly P&I
- —
- Monthly cashflow
- —
- DSCR
- —
- Eligible?
- —
No personal income docs; deal must DSCR.
Hard money
10% down · 12.0% · 12mo
- Down + closing
- —
- Monthly P&I
- —
- Monthly cashflow
- —
- DSCR
- —
- Eligible?
- —
Short-term bridge; refi at stabilization.
Rent comps 28 comps
| Address | Beds | Baths | Sqft | Rent | $/sqft | DOM | Units | Dist |
|---|---|---|---|---|---|---|---|---|
| 326 Eason St Highland Park, MI | 3.0 | 1.0 | 1256 | $1,300 | $1.04 | 17d | 1 | 0.02mi |
| 16927 Inverness St Detroit, MI | 2.0 | 1.0 | 897 | $1,650 | $1.84 | 17d | 1 | 0.55mi |
| 885 Covington Dr Unit 201 Highland Park, MI | 2.0 | 2.0 | 1350 | $1,695 | $1.26 | 44d | 1 | 0.61mi |
| 17550 2nd Ave Detroit, MI | 2.0 | 1.0 | 1350 | $1,150 | $0.85 | 18d | 1 | 0.61mi |
| 2521 W McNichols Rd Unit B2 Detroit, MI | 2.0 | 1.0 | 1300 | $1,250 | $0.96 | 44d | 1 | 0.68mi |
| 17666 Manderson Rd Unit 17666 Detroit, MI | 2.0 | 1.0 | 1200 | $1,595 | $1.33 | 44d | 1 | 0.68mi |
| 17670 Manderson Rd Unit 17670 Detroit, MI | 2.0 | 1.0 | 1199 | $1,595 | $1.33 | 44d | 1 | 0.68mi |
| 1029 Covington Dr Unit 1029 Detroit, MI | 2.0 | 1.0 | 1200 | $1,495 | $1.25 | 44d | 1 | 0.69mi |
| 1031 Covington Dr Unit 1061 Detroit, MI | 2.0 | 1.0 | 1200 | $1,595 | $1.33 | 44d | 1 | 0.70mi |
| 16174 Princeton St Detroit, MI | 2.0 | 1.0 | 985 | $1,100 | $1.12 | 19d | 1 | 0.70mi |
| 16174 Princeton St Unit 2 Detroit, MI | 2.0 | 1.0 | 985 | $1,100 | $1.12 | 44d | 1 | 0.70mi |
| 17765 Manderson Rd Unit 14 Highland Park, MI | 2.0 | 1.0 | 1000 | $1,175 | $1.18 | 44d | 1 | 0.75mi |
| 17765 Manderson Rd Unit 8 Highland Park, MI | 2.0 | 1.0 | 1000 | $1,215 | $1.22 | 2d | 1 | 0.75mi |
| 15906 Alden St Detroit, MI | 3.0 | 1.0 | 1030 | $1,150 | $1.12 | 17d | 1 | 0.81mi |
| 101 Stevens St Highland Park, MI | 3.0 | 1.5 | 1152 | $1,600 | $1.39 | 17d | 1 | 0.82mi |
| 15345 Parkside St Detroit, MI | 3.0 | 1.0 | 1152 | $1,300 | $1.13 | 44d | 1 | 1.03mi |
| 27 Pasadena St Highland Park, MI | 2.0 | 1.0 | 900 | $825 | $0.92 | 44d | 1 | 1.03mi |
| 1926 Clements St Unit 1926 Detroit, MI | 3.0 | 1.0 | 1150 | $1,250 | $1.09 | 20d | 1 | 1.03mi |
| 1926 Clements St Detroit, MI | 3.0 | 1.0 | 1150 | $1,150 | $1.00 | 5d | 1 | 1.03mi |
| 16834 Fairfield St Detroit, MI | 2.0 | 1.0 | 1516 | $1,363 | $0.90 | 24d | 1 | 1.05mi |
| 574 W Golden Gate Highland Park, MI | 3.0 | 1.0 | 1315 | $1,300 | $0.99 | 44d | 1 | 1.20mi |
| 406 W Goldengate St Detroit, MI | 2.0 | 1.0 | 1050 | $1,100 | $1.05 | 44d | 1 | 1.24mi |
| 404 W Golden Gate Highland Park, MI | 2.0 | 1.0 | 1050 | $1,100 | $1.05 | 44d | 1 | 1.25mi |
| 64 Glendale St Highland Park, MI | 4.0 | 1.0 | 1464 | $1,500 | $1.02 | 10d | 1 | 1.36mi |
| 17215 Warrington Dr Detroit, MI | 2.0 | 1.0 | 1015 | $2,000 | $1.97 | 44d | 1 | 1.37mi |
| 16582 Santa Rosa Dr Detroit, MI | 3.0 | 1.0 | 1314 | $1,399 | $1.06 | 17d | 1 | 1.42mi |
| 168 Beresford St Highland Park, MI | 4.0 | 1.0 | 1541 | $1,475 | $0.96 | 17d | 1 | 1.42mi |
| 2034 Ewald Cir Detroit, MI | 2.0 | 1.0 | 1000 | $995 | $0.99 | 5d | 1 | 1.44mi |
Listing history 4 events
-
2026-06-18days on market $105,000 Active 3 DOM
-
2026-06-17days on market $105,000 Active 2 DOM
-
2026-06-15remarks 699-char remark
Show marketing remark (979 chars)
Welcome to this updated 3-bedroom, 1-bath home offering classic character, recent improvements, and immediate move-in potential. Recent exterior updates include soffit and fascia repairs, tuckpointing, chimney flashing and cap replacement, siding repairs, porch improvements, and select replacement windows. These updates provide added peace of mind and strong value for the next owner, as many major exterior repairs are already completed. Inside, you'll find fresh paint throughout, all new blinds, luxury vinyl plank flooring in the kitchen and bathroom, and an updated tub surround. The spacious living room features beautiful original hardwood floors and abundant natural light, while the kitchen offers updated finishes and ample cabinet space. Three generously sized bedrooms and a refreshed full bath complete the home's functional layout. Whether you're a first-time buyer looking for an affordable place to call home or an investor seeking a turnkey rental opportunity.
-
2026-06-15$105,000 Active 1 DOM
Show marketing remark (979 chars)
Welcome to this updated 3-bedroom, 1-bath home offering classic character, recent improvements, and immediate move-in potential. Recent exterior updates include soffit and fascia repairs, tuckpointing, chimney flashing and cap replacement, siding repairs, porch improvements, and select replacement windows. These updates provide added peace of mind and strong value for the next owner, as many major exterior repairs are already completed. Inside, you'll find fresh paint throughout, all new blinds, luxury vinyl plank flooring in the kitchen and bathroom, and an updated tub surround. The spacious living room features beautiful original hardwood floors and abundant natural light, while the kitchen offers updated finishes and ample cabinet space. Three generously sized bedrooms and a refreshed full bath complete the home's functional layout. Whether you're a first-time buyer looking for an affordable place to call home or an investor seeking a turnkey rental opportunity.
ⓘ Source: listings_history table (triggers on properties + properties_extension) + one-shot
backfill from property_details.listing_events for pre-trigger history.
Tax reassessment forecast MI · Partial reset (capped growth)
- Current annual tax
- $1,244 · $104/mo
- Projected year-2 tax
- $1,430 · $119/mo
- Expected delta
- +$187/yr (+$16/mo · 15.0%)
ⓘ Screening estimate from a state-policy table — verify with the county assessor before closing.
Climate risk First Street
- Flood 3/10 Moderate FEMA zone X (unshaded) · 20% chance over 30 yrs
- Wildfire 1/10 Low
- Heat 3/10 Moderate 7 d/yr ≥97°F today · 14 d/yr by 30 yrs out
- Wind 2/10 Low
- Air quality 4/10 Moderate 4 unhealthy d/yr today · 6 by 30 yrs out
Nearby sold comps map
Loading sold comps map…
Walkable amenities ~0.75 mi
Loading nearby amenities…
Taxation est. · year 1
- Rental income
- $16,623
- − Mortgage interest
- −$5,882
- − Property taxes
- −$1,244
- − Insurance
- −$525
- − Repairs & maintenance
- −$1,330
- − Management
- −$1,330
- − Depreciation
- −$3,055
- Taxable income
- $3,258
- Est. tax owed @ 24.0%
- −$782
- After-tax cash flow
- $3,974/yr
For passive investors: Depreciation is non-cash, so a rental often shows a tax loss while cash-flowing — sheltering income. Rental losses are passive: they offset passive income freely, and up to $25,000/yr can offset ordinary (W-2) income if you actively participate and your MAGI is under $100k (phasing out to $0 by $150k); unused losses carry forward. On sale, claimed depreciation is recaptured at up to 25%, and gains may owe capital-gains tax (a 1031 exchange can defer both). Figures are a year-1 estimate at your 24.0% rate — not tax advice; consult a CPA.
Schools (NCES district)
No district data.
Livability — Highland Park
- Score
- 73/100
- State rank
- #214
- US rank
- #5271
Category grades
Schools grade is shown separately in the Schools card above.
Census & demographics
- Census place
- Highland Park, MI
- County
- Wayne County · 1,562,939 people
- Metro
- Detroit-Warren-Dearborn, MI
- Population (ZIP)
- 20,049
- Household income
- $38,404
- Rent vs Own
- Severe rent burden
- 1192.0
Population outlook (Wayne County) Hauer SSP2
- Today (2025)
- 1,675,273 people
- By 2030
- 1,620,300 · -3.3%
- By 2040
- 1,502,341 · -10.3%
- By 2050
- 1,384,039 · -17.4%
- By 2075
- 1,124,592 · -32.9%
- By 2100
- 881,193 · -47.4%
Race, ethnicity, and origin ACS 2023
- Neighborhood character
- Predominantly Black (85%)
- Race & ethnicity
- Black 85% White 8% Two or more races 5% Hispanic / Latino 2%
- Common ancestry
- Lithuanian 1%
- Foreign-born
- 2% · Canada
- Languages at home
- 95% English-only · Spanish 3% French/Haitian/Cajun 1%
Political lean MEDSL · Wayne
- 2024 margin
- Strong D (+29.0) · D 62.7% · R 33.7% · Other 3.6%
- 2008→2024 swing
- -20.5pp toward R · 2008: 49.5pp · 2024: 29.0pp
- All cycles
- 2024: D+29.0 2020: D+38.1 2016: D+37.3 2012: D+46.9 2008: D+49.5
Not yet ingested
- Civics
- —
Market trends
- HPI YoY
- ▼ -90.13%
- Current HPI
- 297.0176
- Rent YoY
- —
- Metro
- Detroit-Warren-Dearborn, MI
- State GDP YoY
- ▲ 1.37%
- F500 in state
- 28
Industry mix (Fortune 500 HQ in MI)
| Industry | F500 HQs | Revenue |
|---|---|---|
| Automotive Parts | 3 | $48B |
|
||
| Automotive | 2 | $372B |
|
||
| Chemicals | 1 | $45B |
|
||
| Automotive Retail | 1 | $29B |
|
||
| Healthcare / Medical Devices | 1 | $23B |
|
||
| Automotive Technology | 1 | $20B |
|
||
Price history
+2592.3% since first listed19 events — show timeline
- 2026-06-15 Listed $105,000 REALCOMP
- 2026-06-15 Listed $105,000 SW Michigan MLS
- 2026-06-15 Listed $105,000 MiRealSource-MiMLS
- 2026-05-14 Listed for Rent $1,300 APPFOLIO
- 2025-02-08 Rental Removed $1,250 APPFOLIO
- 2024-10-17 Price Changed $1,250 APPFOLIO
- 2024-09-05 Listed for Rent $1,300 APPFOLIO
- 2024-08-01 Sold (MLS) $37,000 MiRealSource-MiMLS
- 2024-08-01 Sold (MLS) $37,000 REALCOMP
- 2024-07-08 Pending — REALCOMP
- 2024-07-08 Pending — MiRealSource-MiMLS
- 2024-06-13 Listed $39,900 MiRealSource-MiMLS
- 2024-06-13 Listed $39,900 REALCOMP
- 2008-03-21 Sold (MLS) $6,500 REALCOMP
- 2008-02-26 Listed $9,000 REALCOMP
- 2007-07-12 Listing Removed — MiRealSource-MiMLS
- 2007-07-12 Listing Removed — REALCOMP
- 2007-02-07 Listed $3,900 REALCOMP
- 2007-02-02 Listed $3,900 MiRealSource-MiMLS
Property tax history
+1.0%/yrLatest (2025): $1,244 · -21.7% YoY. Source: county tax records.
Cash-flow waterfall
monthlySold comps — $/sqft
last 12 mo · ≤1 miLoading sold comps…