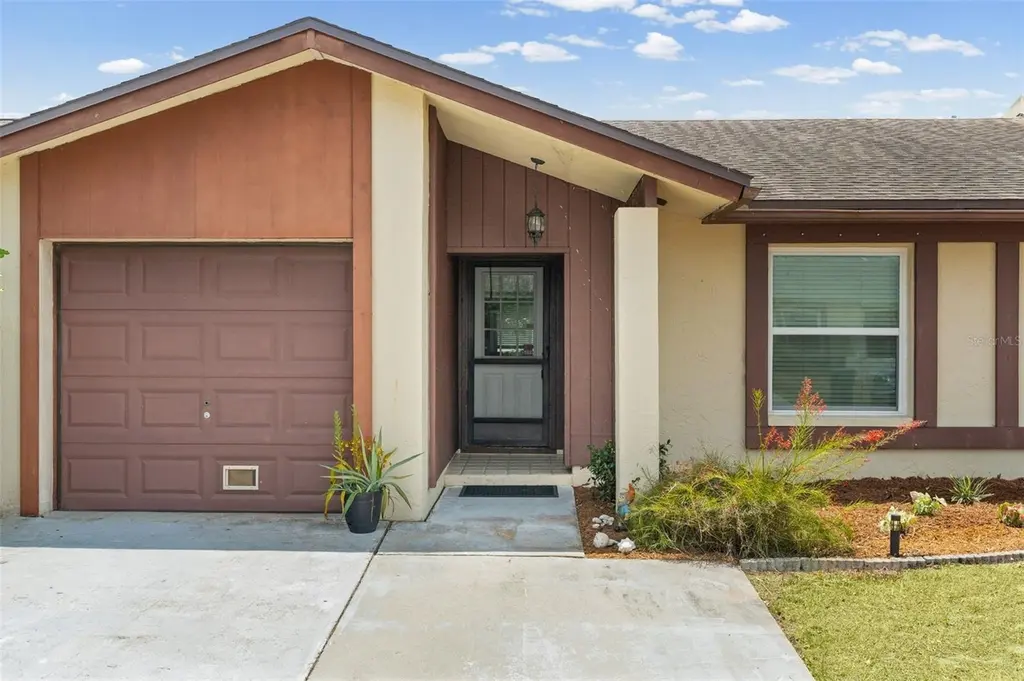
4105 43rd Ave W · Bradenton, FL
Flood risk 1/10 · Minimal
- FEMA flood zone
- X (unshaded)
- Chance of flooding over 30 yrs
- 0.0%
- Est. flood insurance / yr
- $507 – $1,088
Fire risk 1/10 · Minimal
- Est. fire insurance / yr
- $947 – $1,759
Heat risk 10/10 · Severe
- Hot days now (above 106°F)
- 7 days/yr
- Hot days in 30 yrs
- 32 days/yr
Wind risk 10/10 · Severe
- Chance of severe wind over 30 yrs
- 99.0%
Air-quality risk 3/10 · Minor
- Unhealthy air days now
- 2 days/yr
- Unhealthy air days in 30 yrs
- 2 days/yr
Risk factors via First Street. Map © Google.
Why this score? — see what drove the C- grade
The composite is a weighted blend of 9 inputs, each scored 0–100. Each bar is that input's sub-score; the figure is the points it added to the 100-point composite (weight × sub-score).
- Cash flow +18.7/30.0
- ARV discount +10.2/15.0
- DSCR +5.9/10.0
- 1% rule +5.2/10.0
- Schools +4.4/10.0
- Livability +4.0/5.0
- Condition / age +2.5/5.0
- Rent growth +1.9/5.0
- Appreciation +0.0/10.0
$225,000
🖨 Deal sheet 📄 Offer letter ✓ Due diligence
Listing remarks MLS
Short Sale, Bank is Ready to Deal!! Bring Offers !!
Key facts
- Community pool
- Screened lanai
- Tennis courts
Tags
Property features AI
Finance
- Other: Homestead exempt; Solar energy and energy-efficient windows
- Financial info: Lease restrictions apply
- HOA & community: Monthly HOA fee of $169 (includes cable TV, common area taxes, grounds maintenance, pool and recreational facilities); Association approval required; Pets allowed (cats and dogs); Community clubhouse, playground, pool, and tennis courts
Exterior
- Parking: Attached 1-car garage
- Utilities: Public water; Public sewer; Cable available; Electricity available
- Home design: Residential townhouse; One story; North-facing
- Construction: Block construction; Shingle roof; Slab foundation; Built with estimated living area of 1,497 (estimated building area 1,937)
- Exterior features: Rear porch; City limits lot; Paved lot
Interior
- Kitchen: Refrigerator
- Bedrooms: 3 bedrooms
- Flooring: Ceramic tile; Laminate
- Bathrooms: 2 full bathrooms
- Heating & cooling: Electric heating; Central air conditioning
- Interior features: Open floorplan; Private mailbox
- Laundry & utility: Laundry area in garage
Neighborhood map
What this means for you Summary
Snapshot
- This is a 3-bed/2.0-bath townhouse listed at $225k.
Deal economics
- At list price, monthly cash flow is $221 ($3k/yr) — positive.
- The deal already cash-flows at list — no discount required.
- Meets the 1% rule at list price ($2k rent vs $225k).
- Cap rate 7.5% vs local median 3.6% in Bradenton — top-decile yield for the area; either an underpriced asset or a hidden risk that comps aren't pricing in. Stress-test before assuming the spread holds.
Location & tenants
- Location reads 81/100 on livability (#101 in FL, #1,528 nationally) — a professional / high-income tenant draw. Strengths: commute A+, cost of living A+, housing A+; Watch: employment D+, crime D, amenities F.
- Manatee (suburban): math 54% / reading 50% proficiency, ranked #26 of 73 in FL (top 36%) — acceptable for families but not a draw, mixed tenant base, ~2y average lease.
- Zoned schools: Robert H. Prine Elementary School (math 46% / reading 32%, grade F, #1,560 of 2,144 statewide, top 73%, 744 students, 75% FRL); Bayshore High School (math 17% / reading 26%, grade F, #546 of 667 statewide, top 82%, 1,435 students, 65% FRL) — zoned schools average 70% FRL vs 51% district-wide (19 pts higher); higher-poverty schools than district average — tighter screening recommended.
- Zoned-school proficiency averages 30% at this address vs 52% district-wide (-22 pts) — the specific schools serving this property underperform the Manatee average; the district grade overstates school quality for this exact location.
- Market conditions: Rents soft (-2.4%/yr); 319 active listings in the ZIP; 40 comparable units currently listed for rent nearby; rentals at typical pace (median 24d on market — plan ~3-4 weeks tenant-placement turnaround); 7,472 units permitted in Manatee County in 2024 (1,782 in 5+ unit buildings).
- At $2,299/mo this rent would consume 53% of the median local household income ($53k/yr) (locally 1736% of renters already pay >50% of income on rent) — very limited rent-growth headroom before tenants either downsize or default.
Forward outlook
- Local home prices are declining (-3.0%/yr); year-one equity from $2k of loan paydown is wiped out by about $7k of value loss. Plan a longer hold.
- Manatee County population projected at +43% by 2050 — long-run rental-demand tailwind backs the buy-and-hold thesis.
Negotiation context
- Only 6 days on market — expect competitive offers; lowballing is unlikely to land.
- 2 sale attempts since 14y ago with the ask held roughly flat each time — persistent listings suggest the price (not the market) is what's stuck; bring a comps-based counter.
- Current owner paid $156k; 44% above their basis — modest negotiation headroom, anchor on the comps not their cost.
Risks & watch-outs
- Climate carrying-cost: severe wind risk, 99% chance of damaging wind over 30y; extreme-heat days projected 7→32/yr by 2055 (HVAC capex compounding) — expect insurance premiums to compound above CPI over the hold.
Questions for the listing agent
- What does the HOA fee cover, when was the last increase, and are there any pending special assessments or reserve-fund shortfalls?
- Is there a deadline driving the sale (1031 exchange, divorce, estate, relocation)? That informs how much negotiation room exists.
- Crime grade is D in this area — have there been break-ins, vandalism, or insurance claims at this property in the last 3 years? What carrier currently insures it and at what premium?
- What's the average days-on-market for RENTAL listings here right now (not sales)? A rising rental-DOM trend means longer vacancies and softer asking-rent achievability than the comps imply.
- What's the recent tenant-quality profile in this submarket — average credit score on applications, eviction rate, late-payment / NSF rate, and stable-employment percentage? A property-management company in the area should have these aggregated.
- How much new for-sale + rental construction is in the pipeline within 1–3 miles? Heavy new supply typically softens prices + rents 12–24 months out; constrained supply supports both.
Investment metrics
- 1% rule
- 1.02% ✓
- Cap rate
- 7.47%
- Cash-on-cash
- 4.20%
- DSCR
- 1.19
- GRM
- 8.2
CMA / ARV
- ARV (on-the-fly)
- $239,520
- Comps found
- 12
Show comp detail 12 sales within ~0.75 mi
| Address | Dist | Beds/Ba | Sqft | Sold | Price | $/sf | Match |
|---|---|---|---|---|---|---|---|
| 3930 Pinebrook Cir #7 | 0.24mi | 2/2.0 (-1) | 1,493 (-0%) | 1mo | $255,000 | $171 | 83 |
| 4050 Pinebrook Cir #9 | 0.20mi | 2/2.0 (-1) | 1,534 (+2%) | 2mo | $245,000 | $160 | 80 |
| 4480 Fairways Blvd #410 | 0.28mi | 2/2.0 (-1) | 1,508 (+1%) | 1mo | $270,000 | $179 | 80 |
| 122 Pinehurst Dr #122 | 0.23mi | 2/2.0 (-1) | 1,408 (-6%) | 4mo | $285,000 | $202 | 71 |
| 4570 Pinebrook Cir #508 | 0.26mi | 2/2.0 (-1) | 1,396 (-7%) | 1mo | $250,000 | $179 | 71 |
| 4460 Fairways Blvd #308 | 0.30mi | 2/2.0 (-1) | 1,396 (-7%) | 3mo | $245,000 | $176 | 67 |
| 814 Spring Lakes Blvd #14 | 0.52mi | 3/2.0 | 1,446 (-3%) | 4mo | $205,000 | $142 | 67 |
| 118 Pinehurst Dr Unit 118D | 0.21mi | 2/2.0 (-1) | 1,304 (-13%) | 0mo | $205,000 | $157 | 64 |
| 3617 36th Avenue Dr W #3617 | 0.40mi | 3/2.0 | 1,272 (-15%) | 3mo | $155,000 | $122 | 54 |
| 533 Lakeside Dr #533 | 0.75mi | 2/2.0 (-1) | 1,408 (-6%) | 2mo | $135,000 | $96 | 48 |
| 467 Palm Tree Dr #467 | 0.66mi | 2/2.0 (-1) | 1,668 (+11%) | 4mo | $230,000 | $138 | 42 |
| 4525 Park Lake Ter S | 0.74mi | 2/2.0 (-1) | 1,304 (-13%) | 2mo | $165,500 | $127 | 37 |
Match score weights: distance 35% · size 25% · config 20% · recency 20%. Top-matched comps best support the ARV.
Projected returns pro-forma
-3.0% appreciation · 0.0% rent growth · sell at horizon
- IRR
- -13.2%
- Equity multiple
- 0.54×
- Total profit
- $-29,087
- Equity at exit
- $33,548
- IRR
- -9.9%
- Equity multiple
- 0.48×
- Total profit
- $-33,033
- Equity at exit
- $19,454
Cash invested: $63,000 (down + closing). Projections, not guarantees.
Landlord ↔ Tenant lean methodology
- Overall (STATE)
- 87 Strongly Landlord-Friendly
- State Florida
- 87 Strongly Landlord-Friendly · R+3
- County
- — inherits STATE
- City
- — inherits STATE
ZIP-level market 34205
- Rents YoY
- -2.4%
- Active inventory
- 319
- Price-to-rent
- 8.2×
Monthly cashflow live
- Estimated rent
- $2,299 high interval (Pro) →
- Mortgage (P&I)
- −$1,180
- Tax from tax record
- −$153 /mo · $1,839/yr
- Insurance
- −$94
- HOA
- −$169
- Vacancy / Maint / Mgmt
- −$483
- Net cashflow
- $221
Break-even live
UW: 25.0% down · 7.5% · 30yr · 1.5% tax · 5.0% vac · 8.0% maint · 8.0% mgmt
Financing live
Cash to close
- Down payment
- $56,250
- Closing costs
- $6,750
- Reserves months
- —
- Total cash needed
- —
Loan-product check · same deal, 3 products live
Conventional
25% down · 7.5% · 30yr
- Down + closing
- —
- Monthly P&I
- —
- Monthly cashflow
- —
- DSCR
- —
- Eligible?
- —
Personal DTI + credit; lowest rate.
DSCR
20% down · 8.5% · 30yr
- Down + closing
- —
- Monthly P&I
- —
- Monthly cashflow
- —
- DSCR
- —
- Eligible?
- —
No personal income docs; deal must DSCR.
Hard money
10% down · 12.0% · 12mo
- Down + closing
- —
- Monthly P&I
- —
- Monthly cashflow
- —
- DSCR
- —
- Eligible?
- —
Short-term bridge; refi at stabilization.
Rent comps 40 comps
| Address | Beds | Baths | Sqft | Rent | $/sqft | DOM | Units | Dist |
|---|---|---|---|---|---|---|---|---|
| 4107 41st St W Bradenton, FL | 3.0 | 2.0 | 1419 | $3,700 | $2.61 | 23d | 1 | 0.08mi |
| 4325 40th St W Bradenton, FL | 1.0–2.0 | 1.0–2.0 | 775 | $1,675 | $2.16 | 10d | 9 | 0.08mi |
| 4220 Pinebrook Cir #14 Bradenton, FL | 2.0 | 2.0 | 1534 | $2,300 | $1.50 | 19d | 1 | 0.11mi |
| 4570 Pinebrook Cir #304 Bradenton, FL | 2.0 | 2.0 | 1256 | $3,100 | $2.47 | 23d | 1 | 0.24mi |
| 108 Pinehurst Dr Bradenton, FL | 2.0 | 2.0 | 1408 | $2,500 | $1.78 | 23d | 1 | 0.27mi |
| 4460 Fairways Blvd #606 Bradenton, FL | 2.0 | 2.0 | 1256 | $2,000 | $1.59 | 15d | 1 | 0.27mi |
| 3909 45th Ter W #106 Bradenton, FL | 2.0 | 2.5 | 1429 | $1,800 | $1.26 | 15d | 1 | 0.33mi |
| 4457 45th Ave W #211 Bradenton, FL | 2.0 | 2.0 | 912 | $1,950 | $2.14 | 15d | 1 | 0.33mi |
| 4240 Ironwood Cir #404 Bradenton, FL | 2.0 | 2.0 | 1008 | $2,495 | $2.48 | 23d | 1 | 0.40mi |
| 3715 45th Ter W Bradenton, FL | 2.0 | 2.5 | 1429 | $1,695 | $1.19 | 23d | 1 | 0.43mi |
| 3825 45th Ter W #104 Bradenton, FL | 2.0 | 2.5 | 1429 | $1,550 | $1.08 | 23d | 1 | 0.43mi |
| 4655 46th Street Ct W #103 Bradenton, FL | 2.0 | 2.0 | 1141 | $600 | $0.53 | 3d | 1 | 0.44mi |
| 283 Sherwood Dr Bradenton, FL | 2.0 | 2.0 | 1304 | $1,800 | $1.38 | 23d | 1 | 0.47mi |
| 3603 45th Ter W #101 Bradenton, FL | 3.0 | 2.5 | 1200 | $1,800 | $1.50 | 3d | 1 | 0.48mi |
| 303 Springdale Dr #303 Bradenton, FL | 2.0 | 2.0 | 1304 | $1,999 | $1.53 | 3d | 1 | 0.50mi |
| 4040 Ironwood Cir Unit 404F Bradenton, FL | 2.0 | 2.0 | 1008 | $1,750 | $1.74 | 11d | 1 | 0.52mi |
| 4040 Ironwood Cir Unit 406F Bradenton, FL | 2.0 | 2.0 | 1008 | $1,675 | $1.66 | 15d | 1 | 0.52mi |
| 4449 46th Ave W Unit 4449 Bradenton, FL | 2.0 | 1.0 | 1110 | $3,200 | $2.88 | 23d | 1 | 0.54mi |
| 346 Springdale Dr Unit 346 Bradenton, FL | 2.0 | 2.0 | 1304 | $1,900 | $1.46 | 23d | 1 | 0.55mi |
| 4550 47th St W Bradenton, FL | 1.0–3.0 | 1.0–2.0 | 930 | $2,270 | $2.44 | 1d | 27 | 0.55mi |
| 4110 Ironwood Cir #104 Bradenton, FL | 2.0 | 2.0 | 1152 | $1,800 | $1.56 | 23d | 1 | 0.56mi |
| 4801 47th Ave W Bradenton, FL | 1.0–3.0 | 1.0–2.0 | 1016 | $2,205 | $2.17 | 1d | 32 | 0.60mi |
| 3512 32nd St W Bradenton, FL | 2.0 | 1.0 | 1200 | $2,100 | $1.75 | 3d | 1 | 0.64mi |
| 434 Palm Tree Dr #434 Bradenton, FL | 2.0 | 2.0 | 1728 | $1,900 | $1.10 | 23d | 1 | 0.68mi |
| 452 Palm Tree Dr Unit 452 Bradenton, FL | 2.0 | 2.0 | 1304 | $1,595 | $1.22 | 3d | 1 | 0.69mi |
| 3401 50th St W Bradenton, FL | 3.0 | 2.0 | 1418 | $2,699 | $1.90 | 23d | 1 | 0.72mi |
| 3806 Southern Pkwy W Bradenton, FL | 3.0 | 2.0 | 1296 | $2,176 | $1.68 | 11d | 1 | 0.75mi |
| 655 Woodlawn Dr Unit 655 Bradenton, FL | 2.0 | 2.0 | 1148 | $1,600 | $1.39 | 23d | 1 | 0.76mi |
| 206 Lakewood Dr Unit 206 Bradenton, FL | 2.0 | 2.0 | 940 | $2,700 | $2.87 | 23d | 1 | 0.78mi |
| 4112 Cape Vista Dr Bradenton, FL | 3.0 | 2.0 | 1450 | $3,495 | $2.41 | 23d | 1 | 0.82mi |
| 586 Lakeside Dr Unit 586 Bradenton, FL | 2.0 | 2.0 | 940 | $3,200 | $3.40 | 23d | 1 | 0.83mi |
| 577 Lakeside Dr Bradenton, FL | 2.0 | 2.0 | 1728 | $2,000 | $1.16 | 23d | 1 | 0.83mi |
| 142 Pineneedle Dr Unit 142U Bradenton, FL | 2.0 | 2.0 | 1408 | $2,395 | $1.70 | 23d | 1 | 0.84mi |
| 183 Pineneedle Dr Bradenton, FL | 2.0 | 2.0 | 1304 | $1,800 | $1.38 | 23d | 1 | 0.84mi |
| 184 Pineneedle Dr Bradenton, FL | 2.0 | 2.0 | 940 | $2,100 | $2.23 | 23d | 1 | 0.84mi |
| 4802 51st St W Bradenton, FL | 1.0–2.0 | 1.0–2.0 | 1007 | $1,950 | $1.94 | 15d | 15 | 0.84mi |
| 4802 51st St W Bradenton, FL | 1.0–2.0 | 1.0–2.0 | 1007 | $1,950 | $1.94 | 3d | 13 | 0.84mi |
| 3603 Oxford Dr W Bradenton, FL | 2.0 | 2.0 | 1400 | $2,400 | $1.71 | 23d | 1 | 0.85mi |
| 132 Wild Palm Dr #132 Bradenton, FL | 2.0 | 2.0 | 1304 | $3,400 | $2.61 | 23d | 1 | 0.88mi |
| 146 Wild Palm Dr #146 Bradenton, FL | 2.0 | 2.0 | 1500 | $2,500 | $1.67 | 23d | 1 | 0.88mi |
HOA detail
- Monthly dues
- $169 · $2,028/yr
Listing history 10 events
-
2026-05-21$225,000 Active
-
2017-03-27soldstatus $156,000
-
2013-10-11soldstatus $100,000
-
2012-10-01soldstatus $54,900
-
2012-09-07soldstatus $54,900 51-char remark
Show marketing remark (51 chars)
Short Sale, Bank is Ready to Deal!! Bring Offers !!
-
2012-03-21$54,900 51-char remark
Show marketing remark (51 chars)
Short Sale, Bank is Ready to Deal!! Bring Offers !!
-
2002-08-09soldstatus $102,000
-
1999-05-13soldstatus $74,900
-
1991-02-20soldstatus $59,000
-
1987-05-08soldstatus $55,900
ⓘ Source: listings_history table (triggers on properties + properties_extension) + one-shot
backfill from property_details.listing_events for pre-trigger history.
Tax reassessment forecast FL · Resets to sale price
- Current annual tax
- $1,839 · $153/mo
- Projected year-2 tax
- $1,868 · $156/mo
- Expected delta
- +$29/yr (+$2/mo · 1.6%)
ⓘ Screening estimate from a state-policy table — verify with the county assessor before closing.
Climate risk First Street
- Flood 1/10 Low FEMA zone X (unshaded) · 0% chance over 30 yrs
- Wildfire 1/10 Low
- Heat 10/10 Extreme 7 d/yr ≥106°F today · 32 d/yr by 30 yrs out
- Wind 10/10 Extreme 99% chance of damaging wind over 30 yrs
- Air quality 3/10 Moderate 2 unhealthy d/yr today · 2 by 30 yrs out
Nearby sold comps map
Loading sold comps map…
Walkable amenities ~0.75 mi
Loading nearby amenities…
Taxation est. · year 1
- Rental income
- $27,593
- − Mortgage interest
- −$12,603
- − Property taxes
- −$1,839
- − Insurance
- −$1,125
- − Repairs & maintenance
- −$2,207
- − Management
- −$2,207
- − HOA
- −$2,028
- − Depreciation
- −$6,545
- Taxable loss
- −$963
- Est. tax savings @ 24.0%
- +$231
- After-tax cash flow
- $2,879/yr
For passive investors: Depreciation is non-cash, so a rental often shows a tax loss while cash-flowing — sheltering income. Rental losses are passive: they offset passive income freely, and up to $25,000/yr can offset ordinary (W-2) income if you actively participate and your MAGI is under $100k (phasing out to $0 by $150k); unused losses carry forward. On sale, claimed depreciation is recaptured at up to 25%, and gains may owe capital-gains tax (a 1031 exchange can defer both). Figures are a year-1 estimate at your 24.0% rate — not tax advice; consult a CPA.
Schools (NCES district)
- District
- Manatee
- NCES district ID
- 1201230
- Math proficiency
- 54% ▼ -6.00%
- Reading proficiency
- 50% ▼ -2.00%
- Median HH income
- $49,607
- Composite
- 44.43/100
- National rank
- #2806
- State rank
- #26 of 73 in FL
Livability — Bradenton
- Score
- 81/100
- State rank
- #101
- US rank
- #1528
Category grades
Schools grade is shown separately in the Schools card above.
Census & demographics
- Census place
- Bradenton, FL
- County
- Manatee County · 416,364 people
- City population
- 227,091
- Metro
- North Port-Sarasota-Bradenton, FL
- Population (ZIP)
- 31,946
- Household income
- $52,525
- Rent vs Own
- Severe rent burden
- 1736.0
Population outlook (Manatee County) Hauer SSP2
- Today (2025)
- 447,342 people
- By 2030
- 488,911 · +9.3%
- By 2040
- 567,934 · +27.0%
- By 2050
- 637,995 · +42.6%
- By 2075
- 781,970 · +74.8%
- By 2100
- 848,272 · +89.6%
Race, ethnicity, and origin ACS 2023
- Neighborhood character
- Predominantly White (65%)
- Race & ethnicity
- White 65% Hispanic / Latino 18% Black 10% Two or more races 9% Asian 2% Native American 1%
- Hispanic origin (detail)
- Mexican 7% Puerto Rican 4% Cuban 1%
- Common ancestry
- Hispanic 2% Romanian 2% Lithuanian 2%
- Foreign-born
- 15% · Canada, Vietnam
- Languages at home
- 78% English-only · Spanish 14% French/Haitian/Cajun 2% German/W. Germanic 1%
Political lean MEDSL · Manatee
- 2024 margin
- Strong R (+23.5) · D 37.9% · R 61.4%
- 2008→2024 swing
- -16.5pp toward R · 2008: -7.0pp · 2024: -23.5pp
- All cycles
- 2024: R+23.5 2020: R+16.1 2016: R+17.1 2012: R+12.5 2008: R+7.0
Not yet ingested
- Civics
- —
Market trends
- HPI YoY
- ▼ -310.18%
- Current HPI
- 369.8239
- Rent YoY
- ▼ -2.43%
- Metro
- North Port-Sarasota-Bradenton, FL
- State GDP YoY
- ▲ 3.28%
- F500 in state
- 36
Industry mix (Fortune 500 HQ in FL)
| Industry | F500 HQs | Revenue |
|---|---|---|
| Industrial Technology | 2 | $29B |
|
||
| Insurance | 2 | $17B |
|
||
| Retail | 1 | $60B |
|
||
| Technology Distribution | 1 | $58B |
|
||
| Homebuilding | 1 | $35B |
|
||
| Technology Manufacturing | 1 | $35B |
|
||
Price history
+302.5% since first listed10 events — show timeline
- 2026-05-21 Listed $225,000 Stellar MLS as Distributed by MLS Grid
- 2017-03-27 Sold (Public Records) $156,000 Public Records
- 2013-10-11 Sold (Public Records) $100,000 Public Records
- 2012-10-01 Sold (Public Records) $54,900 Public Records
- 2012-09-07 Sold (MLS) $54,900 Stellar MLS as Distributed by MLS Grid
- 2012-03-21 Listed $54,900 Stellar MLS as Distributed by MLS Grid
- 2002-08-09 Sold (Public Records) $102,000 Public Records
- 1999-05-13 Sold (Public Records) $74,900 Public Records
- 1991-02-20 Sold (Public Records) $59,000 Public Records
- 1987-05-08 Sold (Public Records) $55,900 Public Records
Property tax history
+1.1%/yrLatest (2025): $1,839 · +3.4% YoY. Source: county tax records.
Cash-flow waterfall
monthlySold comps — $/sqft
last 12 mo · ≤1 miLoading sold comps…