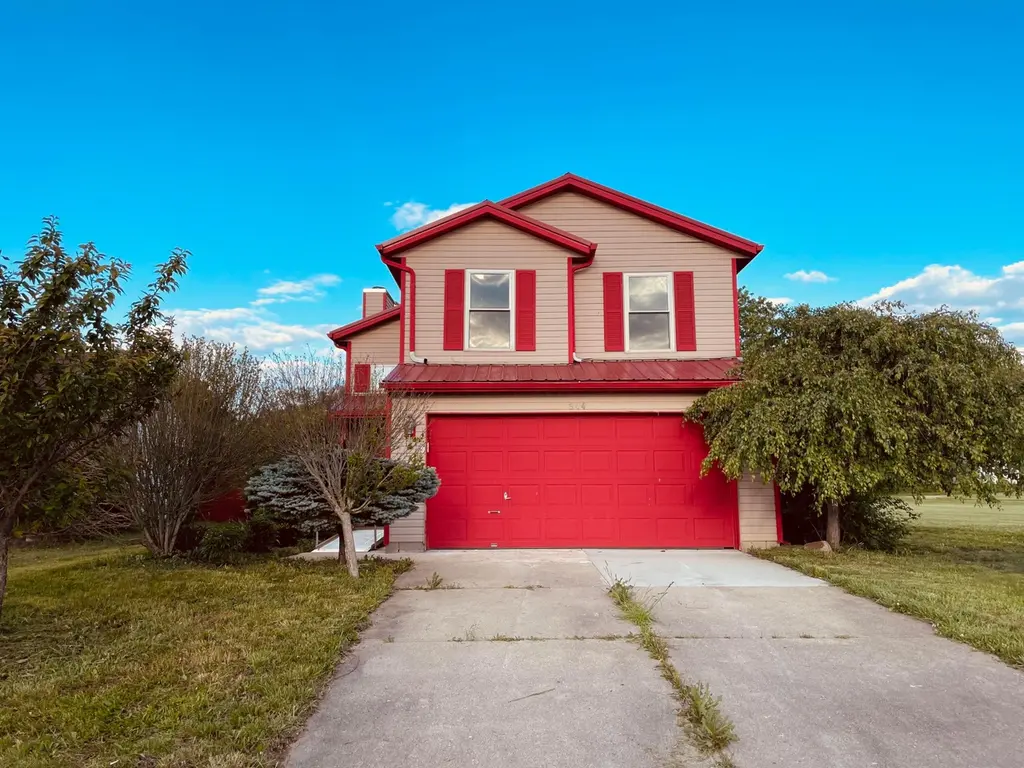
944 Fox Croft Pl · Trenton, OH
Flood risk 1/10 · Minimal
- FEMA flood zone
- X (unshaded)
- Chance of flooding over 30 yrs
- 0.0%
- Est. flood insurance / yr
- $473 – $860
Fire risk 1/10 · Minimal
- Est. fire insurance / yr
- $713 – $1,323
Heat risk 4/10 · Minor
- Hot days now (above 103°F)
- 7 days/yr
- Hot days in 30 yrs
- 19 days/yr
Wind risk 2/10 · Minimal
- Chance of severe wind over 30 yrs
- 1.0%
Air-quality risk 2/10 · Minimal
- Unhealthy air days now
- 1 days/yr
- Unhealthy air days in 30 yrs
- 2 days/yr
Risk factors via First Street. Map © Google.
Why this score? — see what drove the C- grade
The composite is a weighted blend of 9 inputs, each scored 0–100. Each bar is that input's sub-score; the figure is the points it added to the 100-point composite (weight × sub-score).
- Cash flow +16.2/30.0
- ARV discount +15.0/15.0
- DSCR +5.0/10.0
- 1% rule +4.5/10.0
- Schools +4.4/10.0
- Livability +3.7/5.0
- Rent growth +2.5/5.0
- Condition / age +2.5/5.0
- Appreciation +0.0/10.0
$202,000
🖨 Deal sheet (PDF) 📄 Offer letter ✓ Due diligence
Listing remarks
Welcome to 944 Fox Croft Pl. 3 Bed | 1.5 Bath | Value-Add Opportunity on a Quiet, No-Through Street Situated at the end of a peaceful, no-through street with a field on one side, this 3-bedroom, 1.5-bath home offers privacy, potential, and flexibility. Built in 1999, the layout places all bedrooms ( multiple walk in closets) and the full bath upstairs, with a convenient half bath on the main level with attached 2 car garage The living area showcases a vaulted ceiling and a fireplace, providing strong resale appeal once updated. The exterior includes a fenced backyard, wooden deck, treed lot, a durable metal roof, and solar panels to reduce utility costs(condition of solar panels not warr
Key facts
- 0.23 acre lot
- 2 garage spots
- Built 1999
Property features AI
Exterior
- Parking: Attached garage with 2 spaces
- Utilities: Public water; Public sewer
- Home design: Single-family residence; Two levels; Built in 1999; No common walls
- Construction: Slab foundation
- Exterior features: Deck; Fenced yard
Interior
- Bathrooms: 1 full bathroom; 1 half bathroom (total 2 bathrooms / 1.5)
- Heating & cooling: Central air conditioning; Forced air heating
- Interior features: Living area approximately 1,544
Neighborhood map
What this means for you Summary
Snapshot
- This is a 3-bed/1.5-bath single-family listed at $202k.
Deal economics
- At list price, monthly cash flow is $109 ($1k/yr) — positive.
- The deal already cash-flows at list — no discount required.
- To meet the 1% rule (rent ≥ 1% of price), the offer needs to be $193k (4.6% below list).
- Recommended offer: $193k (4.6% below list) — sets the bar for 1% rule.
- Cap rate 6.9% vs local median 3.7% in Trenton — top-decile yield for the area; either an underpriced asset or a hidden risk that comps aren't pricing in. Stress-test before assuming the spread holds.
Location & tenants
- Location reads 74/100 on livability (#282 in OH, #4,633 nationally) — a middle-class / working-renter tenant base. Strengths: crime A+, employment A+, cost of living A+; Watch: amenities F, commute F, health & safety F.
- Edgewood City (rural): math 43% / reading 57% proficiency, ranked #427 of 656 in OH (top 65%) — acceptable for families but not a draw, mixed tenant base, ~2y average lease.
- Zoned schools: Edgewood Middle School (math 37% / reading 51%, grade D, #484 of 654 statewide, top 74%, 832 students, 40% FRL); Edgewood High School (math 34% / reading 70%, grade D+, #343 of 781 statewide, top 47%, 1,167 students, 34% FRL).
- Market conditions: 66 active listings in the ZIP; 11 comparable units currently listed for rent nearby; rentals leasing fast (median 10d on market — plan ~1-2 weeks tenant-placement turnaround); solid renter incomes; 1,163 units permitted in Butler County in 2024 (356 in 5+ unit buildings).
Forward outlook
- Local home prices are declining (-3.0%/yr); year-one equity from $1k of loan paydown is wiped out by about $6k of value loss. Plan a longer hold.
Negotiation context
- It's been on market 29 days — a 2% lower offer ($199k) is reasonable based on typical stale-listing flexibility.
- 3 sale attempts since 17y ago with the ask held roughly flat each time — persistent listings suggest the price (not the market) is what's stuck; bring a comps-based counter.
Questions for the listing agent
- Is there a deadline driving the sale (1031 exchange, divorce, estate, relocation)? That informs how much negotiation room exists.
- Schools are B-rated — typically a magnet for longer-tenancy family renters. What's the average tenant stay here, and is there a school-zone premium baked into asking?
- What's the average days-on-market for RENTAL listings here right now (not sales)? A rising rental-DOM trend means longer vacancies and softer asking-rent achievability than the comps imply.
- What's the recent tenant-quality profile in this submarket — average credit score on applications, eviction rate, late-payment / NSF rate, and stable-employment percentage? A property-management company in the area should have these aggregated.
- How much new for-sale + rental construction is in the pipeline within 1–3 miles? Heavy new supply typically softens prices + rents 12–24 months out; constrained supply supports both.
Investment metrics
- 1% rule
- 0.95% ✗
- Cap rate
- 6.94%
- Cash-on-cash
- 2.30%
- DSCR
- 1.10
- GRM
- 8.7
CMA / ARV
- ARV (median comp)
- $275,548
- List price
- $202,000
- Delta
- -26.69%
- Verdict
- UNDERPRICED
- Comps
- 20 within 1.0 mi
Show comp detail 12 sales within ~0.75 mi
| Address | Dist | Beds/Ba | Sqft | Sold | Price | $/sf | Match |
|---|---|---|---|---|---|---|---|
| 916 Charles St | 0.14mi | 3/1.5 | 1,540 (-0%) | 2mo | $185,000 | $120 | 92 |
| 940 Pheasant Run Dr | 0.07mi | 3/2.5 | 1,520 (-2%) | 7mo | $270,000 | $178 | 85 |
| 919 Charles St | 0.13mi | 3/2.0 | 1,360 (-12%) | 4mo | $264,900 | $195 | 69 |
| 809 Charles St | 0.34mi | 3/1.0 | 1,420 (-8%) | 0mo | $130,000 | $92 | 68 |
| 817 Marcia Dr | 0.39mi | 3/2.0 | 1,412 (-8%) | 10mo | $273,000 | $193 | 58 |
| 922 Third St | 0.57mi | 3/2.0 | 1,484 (-4%) | 9mo | $304,000 | $205 | 57 |
| 304 Maple Ave | 0.44mi | 3/2.0 | 1,340 (-13%) | 5mo | $249,500 | $186 | 52 |
| 921 Third St | 0.54mi | 3/2.0 | 1,701 (+10%) | 7mo | $304,000 | $179 | 50 |
| 912 S First St | 0.45mi | 3/2.0 | 1,312 (-15%) | 5mo | $233,000 | $178 | 48 |
| 105 Day Pl | 0.47mi | 3/2.5 | 1,324 (-14%) | 3mo | $281,000 | $212 | 48 |
| 308 Sycamore Rd | 0.63mi | 3/2.0 | 1,350 (-13%) | 8mo | $230,000 | $170 | 41 |
| 917 Nelson Pl | 0.60mi | 4/2.0 (+1) | 1,748 (+13%) | 7mo | $327,500 | $187 | 37 |
Match score weights: distance 35% · size 25% · config 20% · recency 20%. Top-matched comps best support the ARV.
Projected returns pro-forma
-3.0% appreciation · 3.0% rent growth · sell at horizon
- IRR
- -12.6%
- Equity multiple
- 0.54×
- Total profit
- $-25,778
- Equity at exit
- $30,119
- IRR
- -3.5%
- Equity multiple
- 0.76×
- Total profit
- $-13,380
- Equity at exit
- $17,465
Cash invested: $56,560 (down + closing). Projections, not guarantees.
Landlord ↔ Tenant lean methodology
- Overall (STATE)
- 73 Landlord-Friendly
- State Ohio
- 73 Landlord-Friendly · R+6
- County
- — inherits STATE
- City
- — inherits STATE
ZIP-level market 45067
- Active inventory
- 66
- Price-to-rent
- 8.7×
Monthly cashflow live
- Estimated rent
- $1,927 high interval (Pro) →
- Mortgage (P&I)
- −$1,059
- Tax from tax record
- −$270 /mo · $3,242/yr
- Insurance
- −$84
- HOA
- −$0
- Lot rent
- −$0
- Vacancy / Maint / Mgmt
- −$405
- Net cashflow
- $109
Break-even live
Sensitivity live
| Price | -10% $223 | -5% $166 | +0% $109 | +5% $51 | +10% $-6 |
|---|---|---|---|---|---|
| Rent | -10% $-44 | -5% $32 | +0% $109 | +5% $185 | +10% $261 |
| Rate | -1.0pp $210 | -0.5pp $160 | base $109 | +0.5pp $56 | +1.0pp $3 |
UW: 25.0% down · 7.5% · 30yr · 1.5% tax · 5.0% vac · 8.0% maint · 8.0% mgmt
Financing live
Cash to close
- Down payment
- $50,500
- Closing costs
- $6,060
- Reserves months
- —
- Total cash needed
- —
Loan-product check · same deal, 3 products live
Conventional
25% down · 7.5% · 30yr
- Down + closing
- —
- Monthly P&I
- —
- Monthly cashflow
- —
- DSCR
- —
- Eligible?
- —
Personal DTI + credit; lowest rate.
DSCR
20% down · 8.5% · 30yr
- Down + closing
- —
- Monthly P&I
- —
- Monthly cashflow
- —
- DSCR
- —
- Eligible?
- —
No personal income docs; deal must DSCR.
Hard money
10% down · 12.0% · 12mo
- Down + closing
- —
- Monthly P&I
- —
- Monthly cashflow
- —
- DSCR
- —
- Eligible?
- —
Short-term bridge; refi at stabilization.
Rent comps 11 comps
| Address | Beds | Baths | Sqft | Rent | $/sqft | DOM | Units | Dist |
|---|---|---|---|---|---|---|---|---|
| 123 Day Pl Trenton, OH | 3.0 | 2.5 | 1629 | $1,795 | $1.10 | 17d | 1 | 0.47mi |
| 304 E Oak Ave Unit B Trenton, OH | 2.0 | 2.0 | 1200 | $1,600 | $1.33 | 4d | 1 | 0.52mi |
| 902 3rd St Trenton, OH | 3.0 | 2.5 | 1922 | $2,231 | $1.16 | 10d | 1 | 0.56mi |
| 309 Martin Ave Trenton, OH | 3.0 | 2.0 | 1144 | $1,630 | $1.42 | 4d | 1 | 0.79mi |
| 421 Martin Ct Trenton, OH | 3.0 | 2.0 | 1426 | $1,761 | $1.23 | 46d | 1 | 0.83mi |
| 410 Princeton Dr Trenton, OH | 4.0 | 3.5 | 2132 | $2,381 | $1.12 | 4d | 1 | 0.94mi |
| 101 Keith Ave Trenton, OH | 3.0 | 1.0 | 1057 | $1,600 | $1.51 | 0d | 1 | 1.12mi |
| 104 Poplin Pl Unit 1 Trenton, OH | 2.0 | 1.5 | 1100 | $1,075 | $0.98 | 46d | 1 | 1.25mi |
| 406 Sal Blvd Trenton, OH | 2.0 | 1.5 | 1100 | $1,330 | $1.21 | 10d | 1 | 1.34mi |
| 406 Sal Blvd Trenton, OH | 3.0 | 2.0 | 1115 | $1,500 | $1.35 | 46d | 1 | 1.34mi |
| 490 Peyton Dr Trenton, OH | 3.0 | 2.0 | 1318 | $1,795 | $1.36 | 17d | 1 | 1.47mi |
Listing history 11 events
-
2026-06-05statusdays on market $202,000 Pending 29 DOM
-
2026-06-03days on market $202,000 Active 28 DOM
-
2026-06-02days on market $202,000 Active 27 DOM
-
2026-06-01days on market $202,000 Active 26 DOM
-
2026-05-31days on market $202,000 Active 25 DOM
-
2026-05-06$202,000 Active 1066-char remark
-
2026-05-05historical
-
2026-05-04price $202,000
-
2026-05-02$172,000 Active
-
2009-08-27historical
-
2009-06-09$138,000
ⓘ Source: listings_history table (triggers on properties + properties_extension) + one-shot
backfill from property_details.listing_events for pre-trigger history.
Tax reassessment forecast OH · Partial reset (capped growth)
- Current annual tax
- $3,242 · $270/mo
- Projected year-2 tax
- $3,242 · $270/mo
- Expected delta
- $0/yr ($0/mo · 0.0%)
ⓘ Screening estimate from a state-policy table — verify with the county assessor before closing.
Climate risk First Street
- Flood 1/10 Low FEMA zone X (unshaded) · 0% chance over 30 yrs
- Wildfire 1/10 Low
- Heat 4/10 Moderate 7 d/yr ≥103°F today · 19 d/yr by 30 yrs out
- Wind 2/10 Low 100% chance of damaging wind over 30 yrs
- Air quality 2/10 Low 1 unhealthy d/yr today · 2 by 30 yrs out
Nearby sold comps map
Loading sold comps map…
Walkable amenities ~0.75 mi
Loading nearby amenities…
Taxation est. · year 1
- Rental income
- $23,122
- − Mortgage interest
- −$11,315
- − Property taxes
- −$3,242
- − Insurance
- −$1,010
- − Repairs & maintenance
- −$1,850
- − Management
- −$1,850
- − Depreciation
- −$5,876
- Taxable loss
- −$2,021
- Est. tax savings @ 24.0%
- +$485
- After-tax cash flow
- $1,788/yr
For passive investors: Depreciation is non-cash, so a rental often shows a tax loss while cash-flowing — sheltering income. Rental losses are passive: they offset passive income freely, and up to $25,000/yr can offset ordinary (W-2) income if you actively participate and your MAGI is under $100k (phasing out to $0 by $150k); unused losses carry forward. On sale, claimed depreciation is recaptured at up to 25%, and gains may owe capital-gains tax (a 1031 exchange can defer both). Figures are a year-1 estimate at your 24.0% rate — not tax advice; consult a CPA.
Schools (NCES district)
- District
- Edgewood City
- NCES district ID
- 3904609
- Math proficiency
- 43% ▼ -21.00%
- Reading proficiency
- 57% ▼ -12.00%
- Median HH income
- $58,971
- Composite
- 43.59/100
- National rank
- #2975
- State rank
- #427 of 656 in OH
Livability — Trenton
- Score
- 74/100
- State rank
- #282
- US rank
- #4633
Category grades
Schools grade is shown separately in the Schools card above.
Census & demographics
- Census place
- Trenton, OH
- County
- Butler County · 381,674 people
- City population
- 15,471
- Metro
- Cincinnati, OH-KY-IN
- Population (ZIP)
- 15,471
- Household income
- $81,605
- Rent vs Own
- Severe rent burden
- 237.0
Population outlook (Butler County) Hauer SSP2
- Today (2025)
- 387,706 people
- By 2030
- 392,028 · +1.1%
- By 2040
- 395,307 · +2.0%
- By 2050
- 391,116 · +0.9%
- By 2075
- 378,642 · -2.3%
- By 2100
- 343,248 · -11.5%
Race, ethnicity, and origin ACS 2023
- Neighborhood character
- Predominantly White (96%)
- Race & ethnicity
- White 96% Two or more races 2% Hispanic / Latino 2%
- Common ancestry
- Slovak 3% Lithuanian 2% German 1%
- Foreign-born
- 2% · Canada
- Languages at home
- 98% English-only · Spanish 1% Arabic 1%
Political lean MEDSL · Butler
- 2024 margin
- Strong R (+26.3) · D 36.4% · R 62.7%
- 2008→2024 swing
- -3.6pp toward R · 2008: -22.6pp · 2024: -26.3pp
- All cycles
- 2024: R+26.3 2020: R+24.0 2016: R+28.3 2012: R+26.2 2008: R+22.6
Not yet ingested
- Civics
- —
Market trends
- HPI YoY
- ▼ -160.89%
- Current HPI
- 238.256
- Rent YoY
- —
- Metro
- Cincinnati, OH-KY-IN
- State GDP YoY
- ▲ 1.98%
- F500 in state
- 48
Industry mix (Fortune 500 HQ in OH)
| Industry | F500 HQs | Revenue |
|---|---|---|
| Insurance | 3 | $145B |
|
||
| Industrial Machinery | 3 | $49B |
|
||
| Financial Services | 3 | $24B |
|
||
| Consumer Goods | 2 | $93B |
|
||
| Aerospace / Defense | 2 | $47B |
|
||
| Utilities | 2 | $33B |
|
||
Price history
+46.4% since first listed7 events — show timeline
- 2026-06-04 Pending — CBRMLS
- 2026-05-06 Listed $202,000 CBRMLS
- 2026-05-05 Listing Removed — CBRMLS
- 2026-05-04 Price Changed $202,000 CBRMLS
- 2026-05-02 Listed $172,000 CBRMLS
- 2009-08-27 Listing Removed — Cincy MLS
- 2009-06-09 Listed $138,000 Cincy MLS
Property tax history
+5.3%/yrLatest (2025): $3,242 · +9.2% YoY. Source: county tax records.
Cash-flow waterfall
monthlySold comps — $/sqft
last 12 mo · ≤1 miLoading sold comps…