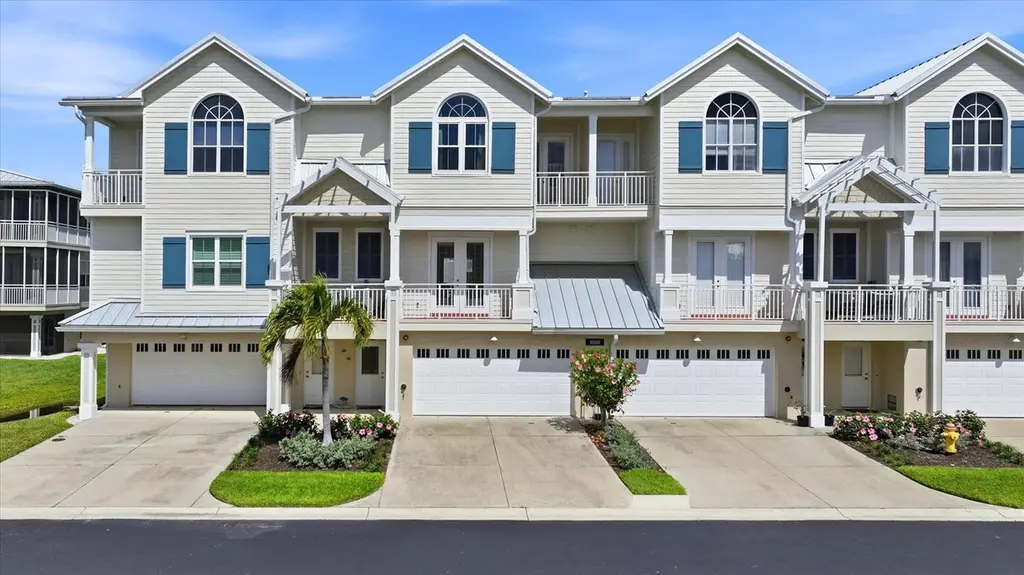
10300 Coral Landings Ct #90 · Rotonda, FL
Flood risk 9/10 · Severe
- FEMA flood zone
- AE
- Chance of flooding over 30 yrs
- 0.99%
- Est. flood insurance / yr
- $1,737 – $8,500
Fire risk 2/10 · Minimal
- Est. fire insurance / yr
- $947 – $1,759
Heat risk 10/10 · Severe
- Hot days now (above 107°F)
- 6 days/yr
- Hot days in 30 yrs
- 21 days/yr
Wind risk 10/10 · Severe
- Chance of severe wind over 30 yrs
- 99.0%
Air-quality risk 3/10 · Minor
- Unhealthy air days now
- 2 days/yr
- Unhealthy air days in 30 yrs
- 2 days/yr
Risk factors via First Street. Map © Google.
Why this score? — see what drove the B grade
The composite is a weighted blend of 9 inputs, each scored 0–100. Each bar is that input's sub-score; the figure is the points it added to the 100-point composite (weight × sub-score).
- Cash flow +25.3/30.0
- ARV discount +15.0/15.0
- DSCR +8.3/10.0
- 1% rule +8.0/10.0
- Schools +4.6/10.0
- Appreciation +4.0/10.0
- Livability +3.4/5.0
- Rent growth +2.5/5.0
- Condition / age +2.5/5.0
$449,000
🖨 Deal sheet 📄 Offer letter ✓ Due diligence
Listing remarks
Welcome to an exceptional coastal residence in Placida, ideally positioned just moments from the world-renowned shores of Boca Grande. This sophisticated townhouse offers an effortless blend of elegance, comfort, and coastal charm—perfect as a refined primary residence, exclusive retreat, or investment opportunity. Being offered turn-key, this home is impeccably appointed and ready for immediate enjoyment—allowing you to step right into the coveted Southwest Florida lifestyle with ease. From the moment you enter, you’re greeted by a light-filled, open-concept design that exudes understated luxury. Expansive windows—now fully upgraded to impact-resistant glass—b
Key facts
- Private patio
- New roof
- $520 HOA
Tags
Property features AI
Finance
- Other: Turnkey furnished; Third-party listing
- Financial info: Total monthly fees (HOA) $520; Total annual fees $6,240; Lease restrictions apply
- HOA & community: HOA managed by Star Hospitality Management; Monthly HOA fee $520 (includes pool, escrow reserves, structure maintenance, grounds maintenance, management, private road, recreational facilities); Association approval required; Pets allowed; Community amenities: clubhouse, fitness center, pool, tennis courts, sidewalks, community mailbox, deed restrictions, wheelchair access, golf carts allowed, irrigation (reclaimed water)
Exterior
- Parking: Attached garage; 3-car garage; Oversized, tandem garage (26 x 45)
- Utilities: Public water; Public sewer; Cable available; Electricity connected; Sewer connected; Water connected
- Home design: Residential townhouse; Three or more stories; Faces southeast; Entry level details not provided
- Construction: Block and frame construction; Metal roof; Slab foundation; Built as part of a building with 19 units
- Exterior features: Lighting; Rain gutters; Paved road access; Water access via creek; Fishing pier
Interior
- Kitchen: Dishwasher; Range; Microwave; Refrigerator; Eat-in kitchen
- Bedrooms: 3 bedrooms
- Flooring: Carpet; Ceramic tile
- Bathrooms: 2 full bathrooms; 1 half bathroom
- Heating & cooling: Central heating (electric); Central air; Humidity control
- Interior features: Ceiling fans; Crown molding; Eat-in kitchen; Elevator; Living room / dining room combo; Storage rooms
- Laundry & utility: Washer; Dryer; Inside laundry room
Neighborhood map
What this means for you Summary
Snapshot
- This is a 3-bed/3.0-bath single-family listed at $449k.
Deal economics
- At list price, monthly cash flow is $586 ($7k/yr) — positive.
- The deal already cash-flows at list — no discount required.
- Meets the 1% rule at list price ($6k rent vs $449k).
- Recommended offer: $422k (6.0% below list) — sets the bar for market timing.
- Cap rate 9.0% vs local median 3.1% in Rotonda — top-decile yield for the area; either an underpriced asset or a hidden risk that comps aren't pricing in. Stress-test before assuming the spread holds.
Location & tenants
- Location reads 67/100 on livability (#548 in FL) — a middle-class / working-renter tenant base. Strengths: crime A+, housing A-, cost of living B+; Watch: schools D, amenities F, commute F.
- Charlotte (suburban): math 54% / reading 54% proficiency, ranked #22 of 73 in FL (top 30%) — acceptable for families but not a draw, mixed tenant base, ~2y average lease.
- Market conditions: 915 active listings in the ZIP; 11 comparable units currently listed for rent nearby; rentals at typical pace (median 21d on market — plan ~3-4 weeks tenant-placement turnaround); 4,585 units permitted in Charlotte County in 2024 (703 in 5+ unit buildings).
Forward outlook
- Local home prices are declining (-1.9%/yr); year-one equity from $3k of loan paydown is wiped out by about $9k of value loss. Plan a longer hold.
- Charlotte County population projected at +24% by 2050 — long-run rental-demand tailwind backs the buy-and-hold thesis.
Negotiation context
- It's been on market 76 days — a 6% lower offer ($422k) is reasonable based on typical stale-listing flexibility.
- 2 sale attempts since 20y ago with the ask held roughly flat each time — persistent listings suggest the price (not the market) is what's stuck; bring a comps-based counter.
Risks & watch-outs
- Watch-outs: flood insurance adds $427/mo.
- Climate carrying-cost: in FEMA flood zone AE (mandatory federal flood insurance); severe wind risk, 99% chance of damaging wind over 30y; extreme-heat days projected 6→21/yr by 2055 (HVAC capex compounding) — expect insurance premiums to compound above CPI over the hold.
Questions for the listing agent
- It's been on market 76 days. Have you received any prior offers? Is the seller open to a 6% concession, seller financing, or rate buy-down credit?
- What's the actual annual flood-insurance premium (NFIP or private), and is the property in a SFHA with mandatory coverage?
- What does the HOA fee cover, when was the last increase, and are there any pending special assessments or reserve-fund shortfalls?
- Why hasn't it sold? Are there any deal-killer items the seller is aware of (foundation, flood, title, zoning, code violations)?
- Is there a deadline driving the sale (1031 exchange, divorce, estate, relocation)? That informs how much negotiation room exists.
- Schools are D-rated, which usually means shorter tenancies and higher turnover. Who's the typical renter profile here, and what's been the actual vacancy rate?
- What's the average days-on-market for RENTAL listings here right now (not sales)? A rising rental-DOM trend means longer vacancies and softer asking-rent achievability than the comps imply.
- What's the recent tenant-quality profile in this submarket — average credit score on applications, eviction rate, late-payment / NSF rate, and stable-employment percentage? A property-management company in the area should have these aggregated.
- How much new for-sale + rental construction is in the pipeline within 1–3 miles? Heavy new supply typically softens prices + rents 12–24 months out; constrained supply supports both.
Investment metrics
- 1% rule
- 1.30% ✓
- Cap rate
- 9.00%
- Cash-on-cash
- 9.67%
- DSCR
- 1.43
- GRM
- 6.4
CMA / ARV
- ARV (on-the-fly)
- $828,405
- Comps found
- 5
Show comp detail 5 sales within ~0.75 mi
| Address | Dist | Beds/Ba | Sqft | Sold | Price | $/sf | Match |
|---|---|---|---|---|---|---|---|
| 440 Spaniards Rd | 0.32mi | 3/3.0 | 2,251 (+0%) | 22mo | $566,500 | $252 | 66 |
| 510 Green Dolphin Dr S | 0.31mi | 3/2.0 | 2,134 (-5%) | 14mo | $900,000 | $422 | 62 |
| 4663 Arlington Dr | 0.60mi | 3/2.0 | 2,174 (-3%) | 12mo | $750,000 | $345 | 52 |
| 4652 Arlington Dr | 0.69mi | 3/3.0 | 2,355 (+5%) | 19mo | $870,000 | $369 | 44 |
| 4 Coral Creek Cir | 0.67mi | 3/3.0 | 2,410 (+7%) | 18mo | $1,024,000 | $425 | 42 |
Match score weights: distance 35% · size 25% · config 20% · recency 20%. Top-matched comps best support the ARV.
Projected returns pro-forma
-1.9% appreciation · 3.0% rent growth · sell at horizon
- IRR
- -2.7%
- Equity multiple
- 0.89×
- Total profit
- $-13,831
- Equity at exit
- $89,218
- IRR
- 5.3%
- Equity multiple
- 1.46×
- Total profit
- $57,461
- Equity at exit
- $78,174
Cash invested: $125,720 (down + closing). Projections, not guarantees.
Landlord ↔ Tenant lean methodology
- Overall (STATE)
- 87 Strongly Landlord-Friendly
- State Florida
- 87 Strongly Landlord-Friendly · R+3
- County
- — inherits STATE
- City
- — inherits STATE
ZIP-level market 33946
- Home prices YoY
- -0.7%
- Active inventory
- 915
- Price-to-rent
- 6.4×
Monthly cashflow live
- Estimated rent
- $5,840 high interval (Pro) →
- Mortgage (P&I)
- −$2,355
- Tax from tax record
- −$539 /mo · $6,466/yr
- Insurance
- −$187
- Flood insurance flood zone
- −$427 /mo · $5,118/yr
- HOA
- −$520
- Vacancy / Maint / Mgmt
- −$1,226
- Net cashflow
- $586
Break-even live
UW: 25.0% down · 7.5% · 30yr · 1.5% tax · 5.0% vac · 8.0% maint · 8.0% mgmt
Financing live
Cash to close
- Down payment
- $112,250
- Closing costs
- $13,470
- Reserves months
- —
- Total cash needed
- —
Loan-product check · same deal, 3 products live
Conventional
25% down · 7.5% · 30yr
- Down + closing
- —
- Monthly P&I
- —
- Monthly cashflow
- —
- DSCR
- —
- Eligible?
- —
Personal DTI + credit; lowest rate.
DSCR
20% down · 8.5% · 30yr
- Down + closing
- —
- Monthly P&I
- —
- Monthly cashflow
- —
- DSCR
- —
- Eligible?
- —
No personal income docs; deal must DSCR.
Hard money
10% down · 12.0% · 12mo
- Down + closing
- —
- Monthly P&I
- —
- Monthly cashflow
- —
- DSCR
- —
- Eligible?
- —
Short-term bridge; refi at stabilization.
Rent comps 11 comps
| Address | Beds | Baths | Sqft | Rent | $/sqft | DOM | Units | Dist |
|---|---|---|---|---|---|---|---|---|
| 10345 Longshore Rd #29 Placida, FL | 3.0 | 3.0 | 2416 | $6,900 | $2.86 | 20d | 1 | 0.09mi |
| 10425 Pilothouse Cir #131 Placida, FL | 3.0 | 3.0 | 2390 | $5,000 | $2.09 | 20d | 1 | 0.15mi |
| 11000 Placida Rd #2201 Placida, FL | 2.0 | 2.5 | 1973 | $8,750 | $4.43 | 20d | 1 | 0.23mi |
| 550 Gaspar Dr Placida, FL | 3.0 | 3.0 | 1803 | $5,500 | $3.05 | 20d | 1 | 0.29mi |
| 13045 Via Aurelia Placida, FL | 3.0 | 2.0 | 1961 | $8,200 | $4.18 | 20d | 1 | 0.42mi |
| 11 Amberjack Ln Placida, FL | 3.0 | 2.0 | 1786 | $2,700 | $1.51 | 13d | 1 | 0.49mi |
| 11 Amberjack Ter Placida, FL | 3.0 | 2.0 | 2209 | $7,985 | $3.61 | 20d | 1 | 0.84mi |
| 10045 Links Ln #203 Rotonda West, FL | 2.0 | 2.0 | 1543 | $1,450 | $0.94 | 13d | 1 | 1.20mi |
| 50 Barracuda Dr Placida, FL | 3.0 | 2.0 | 2154 | $3,000 | $1.39 | 20d | 1 | 1.32mi |
| 13113 Gasparilla Rd #405 Placida, FL | 3.0 | 2.0 | 1855 | $3,150 | $1.70 | 20d | 1 | 1.33mi |
| 2 Windward Ter Placida, FL | 3.0 | 3.0 | 1953 | $2,500 | $1.28 | 20d | 1 | 1.36mi |
HOA detail
- Monthly dues
- $520 · $6,240/yr
Listing history 20 events
-
2026-06-18days on market $449,000 Active 76 DOM
-
2026-06-17days on market $449,000 Active 75 DOM
-
2026-06-16days on market $449,000 Active 74 DOM
-
2026-06-15days on market $449,000 Active 73 DOM
-
2026-06-14days on market $449,000 Active 71 DOM
-
2026-06-13days on market $449,000 Active 70 DOM
-
2026-06-10days on market $449,000 Active 68 DOM
-
2026-06-09days on market $449,000 Active 67 DOM
-
2026-06-08days on market $449,000 Active 66 DOM
-
2026-06-07days on market $449,000 Active 65 DOM
-
2026-06-05days on market $449,000 Active 62 DOM
-
2026-06-03days on market $449,000 Active 61 DOM
-
2026-06-02days on market $449,000 Active 60 DOM
-
2026-06-01days on market $449,000 Active 59 DOM
-
2026-05-31days on market $449,000 Active 58 DOM
-
2026-05-30days on market $449,000 Active 57 DOM
-
2026-04-03$449,000 Active
-
2011-03-09soldstatus $2,600,000
-
2008-05-02historical
-
2006-07-26$663,000
ⓘ Source: listings_history table (triggers on properties + properties_extension) + one-shot
backfill from property_details.listing_events for pre-trigger history.
Tax reassessment forecast FL · Resets to sale price
- Current annual tax
- $6,466 · $539/mo
- Projected year-2 tax
- $6,466 · $539/mo
- Expected delta
- $0/yr ($0/mo · 0.0%)
ⓘ Screening estimate from a state-policy table — verify with the county assessor before closing.
Climate risk First Street
- Flood 9/10 Extreme FEMA zone AE · 99% chance over 30 yrs
- Wildfire 2/10 Low
- Heat 10/10 Extreme 6 d/yr ≥107°F today · 21 d/yr by 30 yrs out
- Wind 10/10 Extreme 99% chance of damaging wind over 30 yrs
- Air quality 3/10 Moderate 2 unhealthy d/yr today · 2 by 30 yrs out
Nearby sold comps map
Loading sold comps map…
Walkable amenities ~0.75 mi
Loading nearby amenities…
Taxation est. · year 1
- Rental income
- $70,075
- − Mortgage interest
- −$25,151
- − Property taxes
- −$6,466
- − Insurance
- −$7,364
- − Repairs & maintenance
- −$5,606
- − Management
- −$5,606
- − HOA
- −$6,240
- − Depreciation
- −$13,062
- Taxable income
- $581
- Est. tax owed @ 24.0%
- −$139
- After-tax cash flow
- $6,895/yr
For passive investors: Depreciation is non-cash, so a rental often shows a tax loss while cash-flowing — sheltering income. Rental losses are passive: they offset passive income freely, and up to $25,000/yr can offset ordinary (W-2) income if you actively participate and your MAGI is under $100k (phasing out to $0 by $150k); unused losses carry forward. On sale, claimed depreciation is recaptured at up to 25%, and gains may owe capital-gains tax (a 1031 exchange can defer both). Figures are a year-1 estimate at your 24.0% rate — not tax advice; consult a CPA.
Schools (NCES district)
- District
- Charlotte
- NCES district ID
- 1200240
- Math proficiency
- 54% ▼ -6.00%
- Reading proficiency
- 54% ▼ -1.00%
- Median HH income
- $44,864
- Composite
- 45.62/100
- National rank
- #2586
- State rank
- #22 of 73 in FL
Livability — Rotonda
- Score
- 67/100
- State rank
- #548
- US rank
- #10359
Category grades
Schools grade is shown separately in the Schools card above.
Census & demographics
- City population
- 10,490
- Population (ZIP)
- 2,745
Population outlook (Charlotte County) Hauer SSP2
- Today (2025)
- 198,646 people
- By 2030
- 210,507 · +6.0%
- By 2040
- 230,857 · +16.2%
- By 2050
- 247,148 · +24.4%
- By 2075
- 281,777 · +41.8%
- By 2100
- 293,609 · +47.8%
Race, ethnicity, and origin ACS 2023
- Neighborhood character
- Predominantly White (95%)
- Race & ethnicity
- White 95% Hispanic / Latino 2% Asian 1% Two or more races 1%
- Common ancestry
- Italian 3% Romanian 2% Russian 2%
- Foreign-born
- 6% · Canada
- Languages at home
- 91% English-only · Russian/Polish/Slavic 5% Spanish 1% French/Haitian/Cajun 1%
Political lean MEDSL · Charlotte
- 2024 margin
- Solid R (+34.0) · D 32.7% · R 66.7%
- 2008→2024 swing
- -26.7pp toward R · 2008: -7.2pp · 2024: -34.0pp
- All cycles
- 2024: R+34.0 2020: R+26.6 2016: R+27.8 2012: R+14.3 2008: R+7.2
Not yet ingested
- Civics
- —
Market trends
- HPI YoY
- ▼ -1.90%
- Current HPI
- 288.559
- Rent YoY
- —
- Metro
- —
- State GDP YoY
- ▲ 3.28%
- F500 in state
- 36
Industry mix (Fortune 500 HQ in FL)
| Industry | F500 HQs | Revenue |
|---|---|---|
| Industrial Technology | 2 | $29B |
|
||
| Insurance | 2 | $17B |
|
||
| Retail | 1 | $60B |
|
||
| Technology Distribution | 1 | $58B |
|
||
| Homebuilding | 1 | $35B |
|
||
| Technology Manufacturing | 1 | $35B |
|
||
Price history
-32.3% since first listed4 events — show timeline
- 2026-04-03 Listed $449,000 Stellar MLS as Distributed by MLS Grid
- 2011-03-09 Sold (Public Records) $2,600,000 Public Records
- 2008-05-02 Listing Removed — Stellar MLS as Distributed by MLS Grid
- 2006-07-26 Listed $663,000 Stellar MLS as Distributed by MLS Grid
Property tax history
+4.7%/yrLatest (2025): $6,466 · -9.7% YoY. Source: county tax records.
Cash-flow waterfall
monthlySold comps — $/sqft
last 12 mo · ≤1 miLoading sold comps…