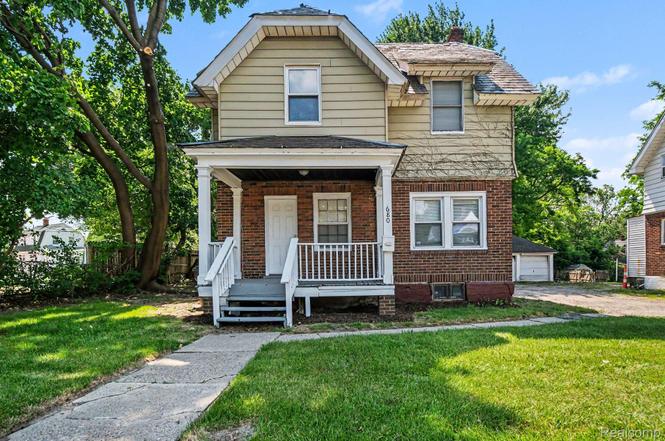
680 N Perry St · Pontiac, MI
Flood risk 1/10 · Minimal
- FEMA flood zone
- X (unshaded)
- Chance of flooding over 30 yrs
- 0.0%
- Est. flood insurance / yr
- $507 – $1,088
Fire risk 1/10 · Minimal
- Est. fire insurance / yr
- $784 – $1,456
Heat risk 2/10 · Minimal
- Hot days now (above 96°F)
- 7 days/yr
- Hot days in 30 yrs
- 15 days/yr
Wind risk 2/10 · Minimal
- Chance of severe wind over 30 yrs
- —
Air-quality risk 3/10 · Minor
- Unhealthy air days now
- 2 days/yr
- Unhealthy air days in 30 yrs
- 4 days/yr
Risk factors via First Street. Map © Google.
Why this score? — see what drove the C+ grade
The composite is a weighted blend of 9 inputs, each scored 0–100. Each bar is that input's sub-score; the figure is the points it added to the 100-point composite (weight × sub-score).
- Cash flow +25.9/30.0
- ARV discount +13.7/15.0
- DSCR +8.7/10.0
- 1% rule +6.5/10.0
- Livability +3.2/5.0
- Rent growth +2.5/5.0
- Condition / age +2.5/5.0
- Schools +1.0/10.0
- Appreciation +0.0/10.0
$124,900
🖨 Deal sheet 📄 Offer letter ✓ Due diligence
Listing remarks MLS
SPACIOUS COLONIAL!! Updated Home w/ 3 Bedrooms, 1 Full Bath, Spacious Living Room w/ New Carpet. Updated Kitchen New Sink, New Faucet, New Cabinets, New Counters, New Refrigerator & New Gas Range. New Carpet in Bedrooms, New Blinds, New Light Fixtures & Freshly Painted. Arched Doorways. Full Basement w/ Glass Block Windows. Covered Front Porch. HUGE Back Yard PERFECT for Entertaining or Relaxing. Conveniently Located Near M-59 & I-75, Parks, Restaurants & Shopping. (Property Taxes are Non-Homesteaded & will be Lower for Owner Occupant).
Key facts
- Covered front porch
- Full basement
- Updated kitchen
Tags
Property features AI
Finance
- Other: Lot approximately 0.15 acres (68.08 x 98.05)
Exterior
- Parking: Driveway, no garage
- Utilities: Public water; Public sewer
- Home design: Single‑family residence; Two stories; Ground level entry with steps
- Construction: Aluminum and vinyl siding; Asphalt roof; Block foundation; Built with asphalt and siding materials
- Exterior features: Front porch; Paved road access; Pets allowed (cats and dogs)
Interior
- Kitchen: Free‑standing gas oven; Free‑standing refrigerator
- Bedrooms: 6 total rooms (bedroom count not specified)
- Bathrooms: 1 full bathroom
- Heating & cooling: Forced air heating (natural gas); No cooling
- Interior features: Gas water heater; Unfinished basement
- Laundry & utility: Washer hookup; Gas dryer hookup
Neighborhood map
What this means for you Summary
Snapshot
- This is a 3-bed/1.0-bath single-family listed at $125k.
Deal economics
- At list price, monthly cash flow is $305 ($4k/yr) — positive.
- The deal already cash-flows at list — no discount required.
- Meets the 1% rule at list price ($1k rent vs $125k).
- Cap rate 9.2% vs local median 6.7% in Pontiac — top-decile yield for the area; either an underpriced asset or a hidden risk that comps aren't pricing in. Stress-test before assuming the spread holds.
Location & tenants
- Location reads 64/100 on livability (#499 in MI) — a middle-class / working-renter tenant base. Strengths: commute A+, cost of living A+, housing A+; Watch: health & safety D, schools F, crime F.
- Pontiac City School District (urban): math 8% / reading 17% proficiency, ranked #514 of 540 in MI (top 95%) — low school quality limits family demand, transient renter base, plan for 1-2y turnover; 81% free/reduced lunch — lower-income household profile, screen leases tightly.
- Market conditions: 87 active listings in the ZIP; 20 comparable units currently listed for rent nearby; rentals lingering (median 44d on market — plan ~5-8 weeks vacancy on turnover, expect pricing pressure); 50% of comp listings sitting > 30 days — soft ceiling on asking rent; 2,614 units permitted in Oakland County in 2024 (721 in 5+ unit buildings).
Forward outlook
- Local home prices are declining (-3.0%/yr); year-one equity from $864 of loan paydown is wiped out by about $4k of value loss. Plan a longer hold.
- Oakland County population projected at +10% by 2050 — modest demand growth; plan on rents tracking national, not racing it.
Negotiation context
- Only 1 days on market — expect competitive offers; lowballing is unlikely to land.
- 3 sale attempts since 2y ago with the ask held roughly flat each time — persistent listings suggest the price (not the market) is what's stuck; bring a comps-based counter.
Risks & watch-outs
- Watch-outs: built in 1920 — expect roof / HVAC / electrical / plumbing capex.
Questions for the listing agent
- Built in 1920 — when were the roof, HVAC, electrical panel, plumbing, and water heater last replaced?
- Is there a deadline driving the sale (1031 exchange, divorce, estate, relocation)? That informs how much negotiation room exists.
- Schools are F-rated, which usually means shorter tenancies and higher turnover. Who's the typical renter profile here, and what's been the actual vacancy rate?
- Crime grade is F in this area — have there been break-ins, vandalism, or insurance claims at this property in the last 3 years? What carrier currently insures it and at what premium?
- What's the average days-on-market for RENTAL listings here right now (not sales)? A rising rental-DOM trend means longer vacancies and softer asking-rent achievability than the comps imply.
- What's the recent tenant-quality profile in this submarket — average credit score on applications, eviction rate, late-payment / NSF rate, and stable-employment percentage? A property-management company in the area should have these aggregated.
- How much new for-sale + rental construction is in the pipeline within 1–3 miles? Heavy new supply typically softens prices + rents 12–24 months out; constrained supply supports both.
Investment metrics
- 1% rule
- 1.15% ✓
- Cap rate
- 9.23%
- Cash-on-cash
- 10.47%
- DSCR
- 1.47
- GRM
- 7.2
CMA / ARV
- ARV (on-the-fly)
- $144,942
- Comps found
- 12
Show comp detail 12 sales within ~0.75 mi
| Address | Dist | Beds/Ba | Sqft | Sold | Price | $/sf | Match |
|---|---|---|---|---|---|---|---|
| 570 E Kennett Rd | 0.40mi | 3/1.0 | 1,475 (-0%) | 12mo | $143,170 | $97 | 71 |
| 427 Valencia Dr | 0.42mi | 3/1.5 | 1,449 (-2%) | 16mo | $185,000 | $128 | 62 |
| 755 Scottwood St | 0.74mi | 3/1.0 | 1,450 (-2%) | 6mo | $145,000 | $100 | 57 |
| 127 Victory Dr | 0.32mi | 3/2.0 | 1,610 (+9%) | 13mo | $153,000 | $95 | 55 |
| 636 E Kennett Rd | 0.45mi | 2/1.0 (-1) | 1,507 (+2%) | 19mo | $99,000 | $66 | 55 |
| 54 Nelson St | 0.45mi | 4/1.5 (+1) | 1,558 (+5%) | 12mo | $149,900 | $96 | 54 |
| 576 Markle Ave | 0.51mi | 2/1.0 (-1) | 1,633 (+10%) | 1mo | $155,000 | $95 | 53 |
| 613 Markle Ave | 0.56mi | 4/1.0 (+1) | 1,416 (-4%) | 13mo | $174,000 | $123 | 51 |
| 25 Ellwood St | 0.49mi | 3/1.0 | 1,294 (-12%) | 8mo | $127,700 | $99 | 49 |
| 50 Lewis St | 0.62mi | 3/1.0 | 1,614 (+9%) | 10mo | $62,500 | $39 | 48 |
| 451 Martin Luther King Jr Blvd N | 0.52mi | 3/1.5 | 1,677 (+13%) | 10mo | $170,000 | $101 | 44 |
| 53 Oakhill St | 0.60mi | 3/2.0 | 1,641 (+11%) | 19mo | $161,000 | $98 | 34 |
Match score weights: distance 35% · size 25% · config 20% · recency 20%. Top-matched comps best support the ARV.
Projected returns pro-forma
-3.0% appreciation · 3.0% rent growth · sell at horizon
- IRR
- -0.6%
- Equity multiple
- 0.98×
- Total profit
- $-800
- Equity at exit
- $18,623
- IRR
- 9.1%
- Equity multiple
- 1.70×
- Total profit
- $24,338
- Equity at exit
- $10,799
Cash invested: $34,972 (down + closing). Projections, not guarantees.
Landlord ↔ Tenant lean methodology
- Overall (STATE)
- 62 Landlord-Friendly
- State Michigan
- 62 Landlord-Friendly · EVEN
- County
- — inherits STATE
- City
- — inherits STATE
ZIP-level market 48342
- Home prices YoY
- -33.8%
- Active inventory
- 87
- Price-to-rent
- 7.2×
Monthly cashflow live
- Estimated rent
- $1,436 high interval (Pro) →
- Mortgage (P&I)
- −$655
- Tax from tax record
- −$122 /mo · $1,469/yr
- Insurance
- −$52
- HOA
- −$0
- Vacancy / Maint / Mgmt
- −$302
- Net cashflow
- $305
Break-even live
UW: 25.0% down · 7.5% · 30yr · 1.5% tax · 5.0% vac · 8.0% maint · 8.0% mgmt
Financing live
Cash to close
- Down payment
- $31,225
- Closing costs
- $3,747
- Reserves months
- —
- Total cash needed
- —
Loan-product check · same deal, 3 products live
Conventional
25% down · 7.5% · 30yr
- Down + closing
- —
- Monthly P&I
- —
- Monthly cashflow
- —
- DSCR
- —
- Eligible?
- —
Personal DTI + credit; lowest rate.
DSCR
20% down · 8.5% · 30yr
- Down + closing
- —
- Monthly P&I
- —
- Monthly cashflow
- —
- DSCR
- —
- Eligible?
- —
No personal income docs; deal must DSCR.
Hard money
10% down · 12.0% · 12mo
- Down + closing
- —
- Monthly P&I
- —
- Monthly cashflow
- —
- DSCR
- —
- Eligible?
- —
Short-term bridge; refi at stabilization.
Rent comps 20 comps
| Address | Beds | Baths | Sqft | Rent | $/sqft | DOM | Units | Dist |
|---|---|---|---|---|---|---|---|---|
| 264 Nelson St Pontiac, MI | 3.0 | 1.0 | 1478 | $1,590 | $1.08 | 43d | 1 | 0.13mi |
| 672 Linda Vista Dr Pontiac, MI | 3.0 | 1.0 | 900 | $1,500 | $1.67 | 3d | 1 | 0.20mi |
| 188 Vernon Dr Pontiac, MI | 3.0 | 1.0 | 1100 | $1,500 | $1.36 | 24d | 1 | 0.24mi |
| 957 Perry St Pontiac, MI | 1.0–3.0 | 1.0 | 835 | $1,099 | $1.32 | 43d | 1 | 0.47mi |
| 16 Victory Dr Unit 18 Pontiac, MI | 2.0 | 1.0 | 1118 | $1,150 | $1.03 | 43d | 1 | 0.51mi |
| 16 Victory Dr Unit 18 Pontiac, MI | 2.0 | 1.0 | 1114 | $1,150 | $1.03 | 24d | 1 | 0.51mi |
| 65 Whitfield St Pontiac, MI | 3.0 | 1.0 | 924 | $1,175 | $1.27 | 43d | 1 | 0.56mi |
| 49 Oakhill St Pontiac, MI | 3.0 | 1.0 | 1200 | $1,575 | $1.31 | 24d | 1 | 0.62mi |
| 611 E Madison Ave Pontiac, MI | 3.0 | 1.5 | 950 | $1,395 | $1.47 | 43d | 1 | 0.74mi |
| 750 Scottwood St Pontiac, MI | 3.0 | 1.0 | 920 | $1,395 | $1.52 | 12d | 1 | 0.74mi |
| 107 N Sanford St Pontiac, MI | 4.0 | 1.5 | 1467 | $1,750 | $1.19 | 43d | 1 | 0.87mi |
| 68 N Shirley St Pontiac, MI | 3.0 | 1.0 | 950 | $1,395 | $1.47 | 17d | 1 | 0.93mi |
| 4000 Winston Dr Pontiac, MI | 2.0 | 1.5 | 1032 | $515 | $0.50 | 2d | 1 | 0.97mi |
| 38 N Shirley St Pontiac, MI | 3.0 | 1.0 | 1174 | $1,425 | $1.21 | 43d | 1 | 0.98mi |
| 695 1st Ave Pontiac, MI | 3.0 | 1.0 | 986 | $1,295 | $1.31 | 43d | 1 | 1.03mi |
| 85 E Beverly Ave Pontiac, MI | 3.0 | 1.0 | 1000 | $1,250 | $1.25 | 4d | 1 | 1.16mi |
| 1173 Featherstone Rd Pontiac, MI | 3.0 | 1.5 | 970 | $1,495 | $1.54 | 24d | 1 | 1.30mi |
| 90 Martin Luther King Jr Blvd S Pontiac, MI | 2.0 | 1.0 | 900 | $1,000 | $1.11 | 43d | 1 | 1.34mi |
| 128 S Edith St Pontiac, MI | 2.0–3.0 | 2.0 | 1155 | $1,700 | $1.47 | 17d | 1 | 1.38mi |
| 195 W Kennett Rd Unit 202 Pontiac, MI | 2.0 | 1.0 | 950 | $875 | $0.92 | 43d | 1 | 1.49mi |
Listing history 2 events
-
2026-06-17remarks 552-char remark
Show marketing remark (572 chars)
SPACIOUS COLONIAL!! Updated Home w/ 3 Bedrooms, 1 Full Bath, Spacious Living Room w/ New Carpet. Updated Kitchen New Sink, New Faucet, New Cabinets, New Counters, New Refrigerator & New Gas Range. New Carpet in Bedrooms, New Blinds, New Light Fixtures & Freshly Painted. Arched Doorways. Full Basement w/ Glass Block Windows. Covered Front Porch. HUGE Back Yard PERFECT for Entertaining or Relaxing. Conveniently Located Near M-59 & I-75, Parks, Restaurants & Shopping. (Property Taxes are Non-Homesteaded & will be Lower for Owner Occupant).
-
2026-06-17$124,900 Active 1 DOM
Show marketing remark (572 chars)
SPACIOUS COLONIAL!! Updated Home w/ 3 Bedrooms, 1 Full Bath, Spacious Living Room w/ New Carpet. Updated Kitchen New Sink, New Faucet, New Cabinets, New Counters, New Refrigerator & New Gas Range. New Carpet in Bedrooms, New Blinds, New Light Fixtures & Freshly Painted. Arched Doorways. Full Basement w/ Glass Block Windows. Covered Front Porch. HUGE Back Yard PERFECT for Entertaining or Relaxing. Conveniently Located Near M-59 & I-75, Parks, Restaurants & Shopping. (Property Taxes are Non-Homesteaded & will be Lower for Owner Occupant).
ⓘ Source: listings_history table (triggers on properties + properties_extension) + one-shot
backfill from property_details.listing_events for pre-trigger history.
Tax reassessment forecast MI · Partial reset (capped growth)
- Current annual tax
- $1,469 · $122/mo
- Projected year-2 tax
- $1,696 · $141/mo
- Expected delta
- +$227/yr (+$19/mo · 15.5%)
ⓘ Screening estimate from a state-policy table — verify with the county assessor before closing.
Climate risk First Street
- Flood 1/10 Low FEMA zone X (unshaded) · 0% chance over 30 yrs
- Wildfire 1/10 Low
- Heat 2/10 Low 7 d/yr ≥96°F today · 15 d/yr by 30 yrs out
- Wind 2/10 Low
- Air quality 3/10 Moderate 2 unhealthy d/yr today · 4 by 30 yrs out
Nearby sold comps map
Loading sold comps map…
Walkable amenities ~0.75 mi
Loading nearby amenities…
Taxation est. · year 1
- Rental income
- $17,236
- − Mortgage interest
- −$6,996
- − Property taxes
- −$1,469
- − Insurance
- −$624
- − Repairs & maintenance
- −$1,379
- − Management
- −$1,379
- − Depreciation
- −$3,633
- Taxable income
- $1,754
- Est. tax owed @ 24.0%
- −$421
- After-tax cash flow
- $3,241/yr
For passive investors: Depreciation is non-cash, so a rental often shows a tax loss while cash-flowing — sheltering income. Rental losses are passive: they offset passive income freely, and up to $25,000/yr can offset ordinary (W-2) income if you actively participate and your MAGI is under $100k (phasing out to $0 by $150k); unused losses carry forward. On sale, claimed depreciation is recaptured at up to 25%, and gains may owe capital-gains tax (a 1031 exchange can defer both). Figures are a year-1 estimate at your 24.0% rate — not tax advice; consult a CPA.
Schools (NCES district)
- District
- Pontiac City School District
- NCES district ID
- 2628740
- Math proficiency
- 8% ▼ -5.00%
- Reading proficiency
- 17% ▼ -3.00%
- Median HH income
- $33,888
- Composite
- 10.12/100
- National rank
- #9802
- State rank
- #514 of 540 in MI
Livability — Pontiac
- Score
- 64/100
- State rank
- #499
- US rank
- #14703
Category grades
Schools grade is shown separately in the Schools card above.
Census & demographics
- Census place
- Pontiac, MI
- City population
- 44,593
- Population (ZIP)
- 17,227
Population outlook (Oakland County) Hauer SSP2
- Today (2025)
- 1,335,747 people
- By 2030
- 1,375,100 · +2.9%
- By 2040
- 1,435,385 · +7.5%
- By 2050
- 1,469,250 · +10.0%
- By 2075
- 1,531,946 · +14.7%
- By 2100
- 1,450,485 · +8.6%
Race, ethnicity, and origin ACS 2023
- Neighborhood character
- Diverse neighborhood (Simpson 0.62)
- Race & ethnicity
- Black 57% Hispanic / Latino 19% White 13% Two or more races 13% Asian 4%
- Hispanic origin (detail)
- Mexican 11% Puerto Rican 2%
- Common ancestry
- Romanian 1% Lithuanian 1% Italian 1%
- Foreign-born
- 10% · Canada, Vietnam
- Languages at home
- 79% English-only · Spanish 15% Other Asian/Pacific 4% Other Indo-European 1%
Political lean MEDSL · Oakland
- 2024 margin
- D (+10.6) · D 54.4% · R 43.8% · Other 1.9%
- 2008→2024 swing
- -3.9pp toward R · 2008: 14.5pp · 2024: 10.6pp
- All cycles
- 2024: D+10.6 2020: D+14.1 2016: D+8.1 2012: D+8.1 2008: D+14.5
Not yet ingested
- Civics
- —
Market trends
- HPI YoY
- ▼ -109.18%
- Current HPI
- 214.3258
- Rent YoY
- —
- Metro
- —
- State GDP YoY
- ▲ 1.37%
- F500 in state
- 28
Industry mix (Fortune 500 HQ in MI)
| Industry | F500 HQs | Revenue |
|---|---|---|
| Automotive Parts | 3 | $48B |
|
||
| Automotive | 2 | $372B |
|
||
| Chemicals | 1 | $45B |
|
||
| Automotive Retail | 1 | $29B |
|
||
| Healthcare / Medical Devices | 1 | $23B |
|
||
| Automotive Technology | 1 | $20B |
|
||
Price history
+940.8% since first listed8 events — show timeline
- 2026-06-17 Listed $124,900 REALCOMP
- 2026-06-17 Listed $124,900 MiRealSource-MiMLS
- 2024-01-13 Rental Removed $975 APPFOLIO
- 2024-01-07 Listed for Rent $975 APPFOLIO
- 2022-02-03 Price Changed $975 APPFOLIO
- 2018-07-05 Sold (Public Records) $2,065,000 Public Records
- 1989-04-10 Sold (Public Records) $32,000 Public Records
- 1974-08-23 Sold (Public Records) $12,000 Public Records
Property tax history
+3.8%/yrLatest (2025): $1,469 · +2.8% YoY. Source: county tax records.
Cash-flow waterfall
monthlySold comps — $/sqft
last 12 mo · ≤1 miLoading sold comps…