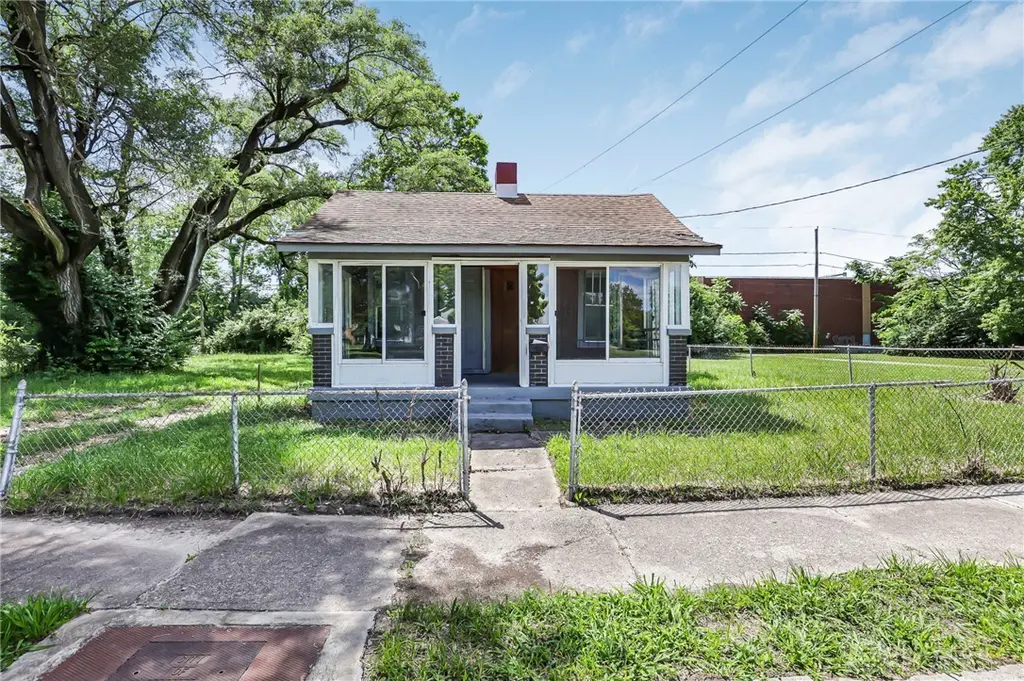
201 S Kilmer St · Dayton, OH
Flood risk No data
- FEMA flood zone
- —
- Chance of flooding over 30 yrs
- —
- Est. flood insurance / yr
- —
Fire risk No data
- Est. fire insurance / yr
- —
Heat risk No data
- Hot days now (above threshold)
- —
- Hot days in 30 yrs
- —
Wind risk No data
- Chance of severe wind over 30 yrs
- —
Air-quality risk No data
- Unhealthy air days now
- —
- Unhealthy air days in 30 yrs
- —
Risk factors via First Street. Map © Google.
Why this score? — see what drove the C grade
The composite is a weighted blend of 9 inputs, each scored 0–100. Each bar is that input's sub-score; the figure is the points it added to the 100-point composite (weight × sub-score).
- Cash flow +24.8/30.0
- DSCR +8.1/10.0
- ARV discount +7.5/15.0
- 1% rule +5.6/10.0
- Rent growth +3.5/5.0
- Livability +3.2/5.0
- Condition / age +2.5/5.0
- Schools +1.3/10.0
- Appreciation +0.0/10.0
$110,000
🖨 Deal sheet (PDF) 📄 Offer letter ✓ Due diligence
Listing remarks MLS
Investors! This tenant occupied home was renovated just prior to tenant occupancy with new paint & flooring, new bathroom fixtures and new kitchen cabinets and countertops. Some windows are replacement. Tenant's lease at $1,100/mo is up in October and they have been a good tenant. The tenant pays all utilities. Lots of green space here as this property includes three lots. Showings will be permitted once under contract. Please do not disturb the tenant. All room sizes are approximate. Please rely on your own measurements.
Key facts
- Covered front porch
- Spacious lot
- Functional layout
Tags
Property features AI
Finance
- Financial info: Offered for sale
Exterior
- Parking: No garage
- Utilities: Natural gas heating; Has cooling (wall unit)
- Home design: Single-story frame house
- Construction: Frame construction
- Exterior features: Residential lot approximately 0.28 acres (approx. 80 x 125)
Interior
- Bedrooms: Two main-level bedrooms (approx. 11 x 9 and 9 x 9); One basement bedroom (approx. 11 x 15)
- Bathrooms: One full bathroom on the main level
- Heating & cooling: Forced air heating (natural gas); Wall-mounted cooling unit(s)
- Interior features: Crawl space basement
Neighborhood map
What this means for you Summary
Snapshot
- This is a 3-bed/1.0-bath single-family listed at $110k.
Deal economics
- At list price, monthly cash flow is $234 ($3k/yr) — positive.
- The deal already cash-flows at list — no discount required.
- Meets the 1% rule at list price ($1k rent vs $110k).
- Cap rate 8.8% vs local median 7.4% in Dayton — meaningfully above typical; check what's discounted (condition, days-on-market, listing class) to confirm the premium yield is real.
Location & tenants
- Location reads 65/100 on livability (#716 in OH) — a middle-class / working-renter tenant base. Strengths: cost of living A+, housing A+, health & safety A; Watch: schools C-, amenities C-, crime F.
- Dayton City (urban): math 12% / reading 21% proficiency, ranked #641 of 656 in OH (top 98%) — low school quality limits family demand, transient renter base, plan for 1-2y turnover; 74% free/reduced lunch — lower-income household profile, screen leases tightly.
- Market conditions: Rents rising fast (+4.1%/yr); 135 active listings in the ZIP; 33 comparable units currently listed for rent nearby; rentals at typical pace (median 15d on market — plan ~3-4 weeks tenant-placement turnaround); lower-income renter base — watch delinquency; 907 units permitted in Montgomery County in 2024 (416 in 5+ unit buildings).
- This rent runs 38% of the median local income ($37k/yr) — at the standard rent-burdened threshold; future hikes will face affordability resistance.
Forward outlook
- Local home prices are declining (-3.0%/yr); year-one equity from $761 of loan paydown is wiped out by about $3k of value loss. Plan a longer hold.
- Montgomery County population projected at -10% by 2050 — secular population decline; favor cash flow + early exit over multi-decade hold.
- At projected returns (-3.0% appreciation + 4.1% rent growth), your $31k cash investment doubles in ~10 years — after that, you're playing with house money.
Negotiation context
- Only 14 days on market — expect competitive offers; lowballing is unlikely to land.
- 3 sale attempts since 2y ago with the ask held roughly flat each time — persistent listings suggest the price (not the market) is what's stuck; bring a comps-based counter.
- Current owner paid $75k; 47% above their basis — modest negotiation headroom, anchor on the comps not their cost.
Risks & watch-outs
- Watch-outs: built in 1915 — expect roof / HVAC / electrical / plumbing capex.
Questions for the listing agent
- Built in 1915 — when were the roof, HVAC, electrical panel, plumbing, and water heater last replaced?
- Is there a deadline driving the sale (1031 exchange, divorce, estate, relocation)? That informs how much negotiation room exists.
- Crime grade is F in this area — have there been break-ins, vandalism, or insurance claims at this property in the last 3 years? What carrier currently insures it and at what premium?
- What's the average days-on-market for RENTAL listings here right now (not sales)? A rising rental-DOM trend means longer vacancies and softer asking-rent achievability than the comps imply.
- What's the recent tenant-quality profile in this submarket — average credit score on applications, eviction rate, late-payment / NSF rate, and stable-employment percentage? A property-management company in the area should have these aggregated.
- How much new for-sale + rental construction is in the pipeline within 1–3 miles? Heavy new supply typically softens prices + rents 12–24 months out; constrained supply supports both.
Investment metrics
- 1% rule
- 1.06% ✓
- Cap rate
- 8.84%
- Cash-on-cash
- 9.11%
- DSCR
- 1.41
- GRM
- 7.9
CMA / ARV
- ARV (on-the-fly)
- $42,048
- Comps found
- 12
Show comp detail 12 sales within ~0.75 mi
| Address | Dist | Beds/Ba | Sqft | Sold | Price | $/sf | Match |
|---|---|---|---|---|---|---|---|
| 236 S Ardmore Ave | 0.25mi | 3/1.0 | 1,192 (+2%) | 0mo | $45,000 | $38 | 84 |
| 32 Anna St | 0.32mi | 3/1.0 | 1,140 (-2%) | 8mo | $10,000 | $9 | 75 |
| 2230 Lakeview Ave | 0.51mi | 3/1.0 | 1,102 (-6%) | 5mo | $40,000 | $36 | 63 |
| 200 N Orchard Ave | 0.46mi | 3/1.5 | 1,256 (+8%) | 4mo | $35,000 | $28 | 61 |
| 233 Westwood Ave | 0.61mi | 3/1.0 | 1,236 (+6%) | 1mo | $45,000 | $36 | 61 |
| 621 Kammer Ave | 0.69mi | 3/1.0 | 1,207 (+3%) | 2mo | $55,000 | $46 | 60 |
| 32 S Plaza Ave | 0.65mi | 2/1.0 (-1) | 1,218 (+4%) | 3mo | $34,000 | $28 | 55 |
| 105 Anna St | 0.39mi | 2/1.0 (-1) | 1,008 (-14%) | 1mo | $75,000 | $74 | 53 |
| 273 Westwood Ave | 0.65mi | 3/1.0 | 1,248 (+7%) | 9mo | $16,000 | $13 | 50 |
| 141 Anna St | 0.44mi | 3/1.0 | 1,008 (-14%) | 9mo | $120,000 | $119 | 49 |
| 130 Westwood Ave | 0.54mi | 2/1.0 (-1) | 1,036 (-11%) | 9mo | $52,000 | $50 | 44 |
| 924 Kammer Ave | 0.75mi | 2/1.0 (-1) | 1,008 (-14%) | 2mo | $30,000 | $30 | 35 |
Match score weights: distance 35% · size 25% · config 20% · recency 20%. Top-matched comps best support the ARV.
Projected returns pro-forma
-3.0% appreciation · 4.06% rent growth · sell at horizon
- IRR
- -1.4%
- Equity multiple
- 0.94×
- Total profit
- $-1,707
- Equity at exit
- $16,401
- IRR
- 9.2%
- Equity multiple
- 1.74×
- Total profit
- $22,835
- Equity at exit
- $9,511
Cash invested: $30,800 (down + closing). Projections, not guarantees.
Landlord ↔ Tenant lean methodology
- Overall (STATE)
- 73 Landlord-Friendly
- State Ohio
- 73 Landlord-Friendly · R+6
- County
- — inherits STATE
- City
- — inherits STATE
ZIP-level market 45417
- Home prices YoY
- -32.3%
- Rents YoY
- 4.1%
- Active inventory
- 135
- Price-to-rent
- 7.9×
Monthly cashflow live
- Estimated rent
- $1,164 high interval (Pro) →
- Mortgage (P&I)
- −$577
- Tax from tax record
- −$63 /mo · $757/yr
- Insurance
- −$46
- HOA
- −$0
- Vacancy / Maint / Mgmt
- −$244
- Net cashflow
- $234
Break-even live
Sensitivity live
| Price | -10% $296 | -5% $265 | +0% $234 | +5% $203 | +10% $172 |
|---|---|---|---|---|---|
| Rent | -10% $142 | -5% $188 | +0% $234 | +5% $280 | +10% $326 |
| Rate | -1.0pp $289 | -0.5pp $262 | base $234 | +0.5pp $205 | +1.0pp $176 |
UW: 25.0% down · 7.5% · 30yr · 1.5% tax · 5.0% vac · 8.0% maint · 8.0% mgmt
Financing live
Cash to close
- Down payment
- $27,500
- Closing costs
- $3,300
- Reserves months
- —
- Total cash needed
- —
Loan-product check · same deal, 3 products live
Conventional
25% down · 7.5% · 30yr
- Down + closing
- —
- Monthly P&I
- —
- Monthly cashflow
- —
- DSCR
- —
- Eligible?
- —
Personal DTI + credit; lowest rate.
DSCR
20% down · 8.5% · 30yr
- Down + closing
- —
- Monthly P&I
- —
- Monthly cashflow
- —
- DSCR
- —
- Eligible?
- —
No personal income docs; deal must DSCR.
Hard money
10% down · 12.0% · 12mo
- Down + closing
- —
- Monthly P&I
- —
- Monthly cashflow
- —
- DSCR
- —
- Eligible?
- —
Short-term bridge; refi at stabilization.
Rent comps 33 comps
| Address | Beds | Baths | Sqft | Rent | $/sqft | DOM | Units | Dist |
|---|---|---|---|---|---|---|---|---|
| 42 S Mathison St Dayton, OH | 3.0 | 1.0 | 1300 | $1,220 | $0.94 | 4d | 1 | 0.30mi |
| 40 S Mathison St Dayton, OH | 3.0 | 1.0 | 1300 | $1,200 | $0.92 | 15d | 1 | 0.30mi |
| 652 Dennison Ave Dayton, OH | 2.0 | 2.0 | 988 | $1,095 | $1.11 | 22d | 1 | 0.36mi |
| 70 Gramont Ave Dayton, OH | 3.0 | 1.5 | 966 | $1,300 | $1.35 | 3d | 1 | 0.39mi |
| 673 Randolph St Dayton, OH | 2.0 | 1.0 | 792 | $950 | $1.20 | 44d | 1 | 0.40mi |
| 623 Clifton Dr Apt A Dayton, OH | 2.0 | 1.0 | 1200 | $1,200 | $1.00 | 3d | 1 | 0.47mi |
| 623 Clifton Dr Apt B Dayton, OH | 2.0 | 1.0 | 1200 | $1,174 | $0.98 | 4d | 1 | 0.47mi |
| 216 N Ardmore Ave Dayton, OH | 3.0 | 1.0 | 1500 | $1,100 | $0.73 | 4d | 1 | 0.49mi |
| 2240 Lakeview Ave Dayton, OH | 3.0 | 1.0 | 1056 | $1,025 | $0.97 | 44d | 1 | 0.50mi |
| 137 Westwood Ave Dayton, OH | 2.0 | 1.0 | 784 | $900 | $1.15 | 4d | 1 | 0.56mi |
| 47 Leroy St Dayton, OH | 3.0 | 1.0 | 1456 | $1,200 | $0.82 | 44d | 1 | 0.67mi |
| 437 Lorenz Ave Dayton, OH | 3.0 | 1.0 | 1322 | $1,200 | $0.91 | 24d | 1 | 0.75mi |
| 1515 W Stewart St Dayton, OH | 2.0 | 1.0 | 925 | $1,000 | $1.08 | 44d | 1 | 0.82mi |
| 725 Maplehurst Ave Dayton, OH | 2.0 | 1.0 | 1104 | $895 | $0.81 | 44d | 1 | 0.86mi |
| 1272 Clement Ave Dayton, OH | 3.0 | 1.0 | 1025 | $1,350 | $1.32 | 3d | 1 | 0.90mi |
| 617 Westwood Ave Dayton, OH | 3.0 | 1.0 | 1304 | $1,050 | $0.81 | 44d | 1 | 0.98mi |
| 500 Bowie Dr Unit 122 Dayton, OH | 2.0 | 1.0 | 850 | $910 | $1.07 | 44d | 1 | 1.01mi |
| 635 Anna St Dayton, OH | 3.0 | 1.0 | 960 | $1,300 | $1.35 | 15d | 1 | 1.06mi |
| 660 Gramont Ave Dayton, OH | 3.0 | 1.0 | 1142 | $1,050 | $0.92 | 4d | 1 | 1.10mi |
| 342 Lookout Ave Dayton, OH | 2.0 | 1.0 | 800 | $775 | $0.97 | 44d | 1 | 1.11mi |
| 342 Lookout Ave Dayton, OH | 2.0 | 1.0 | 800 | $750 | $0.94 | 3d | 1 | 1.11mi |
| 828 Walton Ave Unit 832 Walton Dayton, OH | 2.0 | 1.0 | 750 | $795 | $1.06 | 24d | 1 | 1.12mi |
| 863 N Upland Ave Dayton, OH | 3.0 | 1.0 | 1042 | $1,200 | $1.15 | 44d | 1 | 1.23mi |
| 1119 Superior Ave Unit 1119 Dayton, OH | 3.0 | 1.0 | 1435 | $1,350 | $0.94 | 4d | 1 | 1.23mi |
| 920 Huron Ave Dayton, OH | 2.0 | 1.0 | 950 | $995 | $1.05 | 4d | 1 | 1.25mi |
| 1045 Philadelphia Dr Dayton, OH | 2.0 | 1.0 | 1290 | $1,150 | $0.89 | 3d | 1 | 1.26mi |
| 4109 Midway Ave Dayton, OH | 3.0 | 1.0 | 971 | $1,000 | $1.03 | 4d | 1 | 1.27mi |
| 1045 Shakespeare Ave Dayton, OH | 3.0 | 1.0 | 1435 | $1,275 | $0.89 | 44d | 1 | 1.28mi |
| 3925 Hoover Ave Dayton, OH | 2.0 | 1.0 | 936 | $1,100 | $1.18 | 3d | 1 | 1.30mi |
| 1816 N James H McGee Blvd Apt A Dayton, OH | 3.0 | 1.0 | 950 | $1,200 | $1.26 | 3d | 1 | 1.45mi |
| 1816 N James H McGee Blvd Apt B Dayton, OH | 3.0 | 1.0 | 950 | $1,150 | $1.21 | 44d | 1 | 1.45mi |
| 1816 N James H McGee Blvd Unit C Dayton, OH | 3.0 | 1.0 | 950 | $1,150 | $1.21 | 3d | 1 | 1.45mi |
| 3222 Athens Ave Unit C Dayton, OH | 2.0 | 1.0 | 700 | $700 | $1.00 | 44d | 1 | 1.49mi |
Listing history 10 events
-
2026-06-18days on market $110,000 Active 14 DOM
-
2026-06-17days on market $110,000 Active 13 DOM
-
2026-06-16days on market $110,000 Active 12 DOM
-
2026-06-15days on market $110,000 Active 11 DOM
-
2026-06-14days on market $110,000 Active 9 DOM
-
2026-06-13days on market $110,000 Active 8 DOM
-
2026-06-10days on market $110,000 Active 6 DOM
-
2026-06-09days on market $110,000 Active 5 DOM
-
2026-06-08days on market $110,000 Active 4 DOM
-
2026-06-07$110,000 Active 3 DOM
ⓘ Source: listings_history table (triggers on properties + properties_extension) + one-shot
backfill from property_details.listing_events for pre-trigger history.
Tax reassessment forecast OH · Partial reset (capped growth)
- Current annual tax
- $757 · $63/mo
- Projected year-2 tax
- $1,237 · $103/mo
- Expected delta
- +$479/yr (+$40/mo · 63.3%)
ⓘ Screening estimate from a state-policy table — verify with the county assessor before closing.
Nearby sold comps map
Loading sold comps map…
Walkable amenities ~0.75 mi
Loading nearby amenities…
Taxation est. · year 1
- Rental income
- $13,969
- − Mortgage interest
- −$6,162
- − Property taxes
- −$757
- − Insurance
- −$550
- − Repairs & maintenance
- −$1,117
- − Management
- −$1,117
- − Depreciation
- −$3,200
- Taxable income
- $1,065
- Est. tax owed @ 24.0%
- −$256
- After-tax cash flow
- $2,550/yr
For passive investors: Depreciation is non-cash, so a rental often shows a tax loss while cash-flowing — sheltering income. Rental losses are passive: they offset passive income freely, and up to $25,000/yr can offset ordinary (W-2) income if you actively participate and your MAGI is under $100k (phasing out to $0 by $150k); unused losses carry forward. On sale, claimed depreciation is recaptured at up to 25%, and gains may owe capital-gains tax (a 1031 exchange can defer both). Figures are a year-1 estimate at your 24.0% rate — not tax advice; consult a CPA.
Schools (NCES district)
- District
- Dayton City
- NCES district ID
- 3904384
- Math proficiency
- 12% ▼ -12.00%
- Reading proficiency
- 21% ▼ -11.00%
- Median HH income
- $28,688
- Composite
- 12.94/100
- National rank
- #9579
- State rank
- #641 of 656 in OH
Livability — Dayton
- Score
- 65/100
- State rank
- #716
- US rank
- #12895
Category grades
Schools grade is shown separately in the Schools card above.
Census & demographics
- Census place
- Dayton, OH
- County
- Montgomery County · 459,541 people
- City population
- 164,387
- Metro
- Dayton-Kettering, OH
- Population (ZIP)
- 28,186
- Household income
- $36,945
- Rent vs Own
- Severe rent burden
- 1822.0
Population outlook (Montgomery County) Hauer SSP2
- Today (2025)
- 523,241 people
- By 2030
- 514,948 · -1.6%
- By 2040
- 493,378 · -5.7%
- By 2050
- 469,639 · -10.2%
- By 2075
- 418,360 · -20.0%
- By 2100
- 353,315 · -32.5%
Race, ethnicity, and origin ACS 2023
- Neighborhood character
- Predominantly Black (71%)
- Race & ethnicity
- Black 71% White 20% Two or more races 8% Hispanic / Latino 3%
- Common ancestry
- Romanian 0%
- Foreign-born
- 3% · Canada
- Languages at home
- 96% English-only · Spanish 2% French/Haitian/Cajun 1%
Political lean MEDSL · Montgomery
- 2024 margin
- Toss-up / Even · D 49.8% · R 49.3%
- 2008→2024 swing
- -5.8pp toward R · 2008: 6.2pp · 2024: 0.5pp
- All cycles
- 2024: D+0.5 2020: D+2.2 2016: R+1.2 2012: D+3.1 2008: D+6.2
Not yet ingested
- Civics
- —
Market trends
- HPI YoY
- ▼ -92.43%
- Current HPI
- 193.4175
- Rent YoY
- ▲ 4.06%
- Metro
- Dayton-Kettering, OH
- State GDP YoY
- ▲ 1.98%
- F500 in state
- 48
Industry mix (Fortune 500 HQ in OH)
| Industry | F500 HQs | Revenue |
|---|---|---|
| Insurance | 3 | $145B |
|
||
| Industrial Machinery | 3 | $49B |
|
||
| Financial Services | 3 | $24B |
|
||
| Consumer Goods | 2 | $93B |
|
||
| Aerospace / Defense | 2 | $47B |
|
||
| Utilities | 2 | $33B |
|
||
Price history
+46.7% since first listed7 events — show timeline
- 2026-06-04 Listed $110,000 Dayton MLS
- 2024-07-31 Sold (MLS) $75,000 Dayton MLS
- 2024-07-31 Sold (MLS) $75,000 Dayton MLS
- 2024-05-29 Pending — Dayton MLS
- 2024-05-24 Relisted — Dayton MLS
- 2024-05-15 Pending — Dayton MLS
- 2024-05-06 Listed $75,000 Dayton MLS
Property tax history
+17.1%/yrLatest (2025): $757 · -0.2% YoY. Source: county tax records.
Cash-flow waterfall
monthlySold comps — $/sqft
last 12 mo · ≤1 miLoading sold comps…