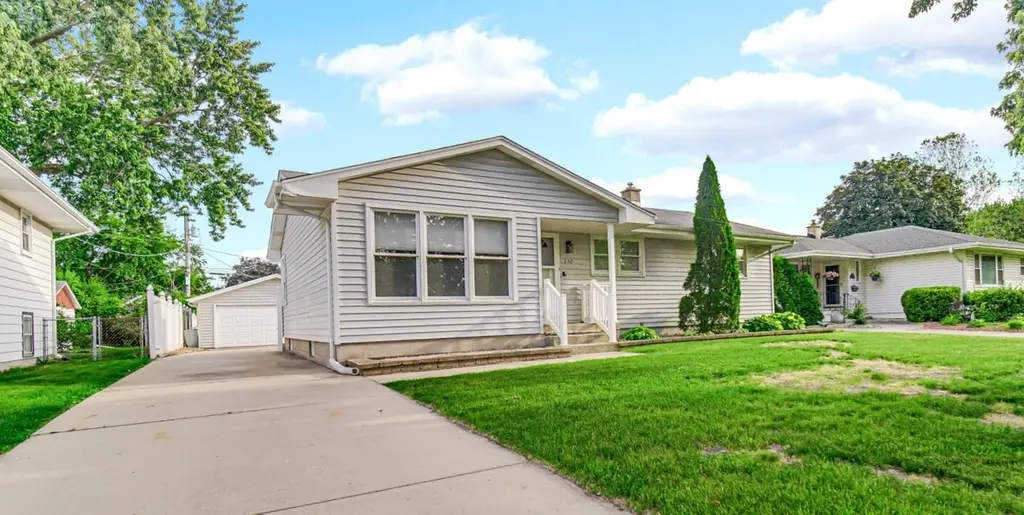
250 Sycamore Ln · Munster, IN
Flood risk 3/10 · Minor
- FEMA flood zone
- X (unshaded)
- Chance of flooding over 30 yrs
- 0.2%
- Est. flood insurance / yr
- $473 – $860
Fire risk 1/10 · Minimal
- Est. fire insurance / yr
- $717 – $1,331
Heat risk 3/10 · Minor
- Hot days now (above 102°F)
- 7 days/yr
- Hot days in 30 yrs
- 15 days/yr
Wind risk 2/10 · Minimal
- Chance of severe wind over 30 yrs
- 0.0%
Air-quality risk 4/10 · Minor
- Unhealthy air days now
- 5 days/yr
- Unhealthy air days in 30 yrs
- 6 days/yr
Risk factors via First Street. Map © Google.
Why this score? — see what drove the F grade
The composite is a weighted blend of 9 inputs, each scored 0–100. Each bar is that input's sub-score; the figure is the points it added to the 100-point composite (weight × sub-score).
- Cash flow +6.6/30.0
- Schools +5.7/10.0
- Livability +4.0/5.0
- Rent growth +2.5/5.0
- Condition / age +2.5/5.0
- 1% rule +2.1/10.0
- DSCR +0.8/10.0
- ARV discount +0.0/15.0
- Appreciation +0.0/10.0
$339,900
🖨 Deal sheet (PDF) 📄 Offer letter ✓ Due diligence
Listing remarks MLS
Start the new year in a new home! This could be the one you have been waiting for. This ranch home with finished basement starts with great curb appeal and continues with lots of upgrades. There is a whole house generator so no worries about power failures. Newer vinyl siding, windows and furnace. Hardwood floors under all carpet on main floor. Custom made, remote controlled shade in living room. Back yard is perfect for entertaining, gardening, etc. 6 foot PVC privacy fence, maintenance free (huge) deck with retractable awning and gas grill. Kitchen has lots of cabinet and counter top space as well as almost new appliances that stay! Basement has 2 large finished spaces, including a bar, as well as some unfinished space in utility room for all your storage needs. Home is conveniently located near shopping, restaurants, hospital, etc. Desirable Munster school district. For additional peace of mind, seller is offering a HOME WARRANTY!! Put this home on your list!
Key facts
- New ceiling fans
- Finished basement
- Fenced backyard
Tags
Property features AI
Exterior
- Parking: Attached garage with garage door opener; Approximately 2.5 garage spaces; Paved driveway and off-street parking; Concrete surfaces
- Utilities: Public water; Public sewer
- Home design: One-story layout; Built in 1966
- Construction: Vinyl siding
- Exterior features: Private yard; Deck; Back yard fencing; Neighborhood view
Interior
- Kitchen: Gas range; Range hood; Refrigerator; Dishwasher
- Bedrooms: Primary bedroom; Bedroom 2; Bedroom 3; Office (can be used as bedroom or flex space); Bedrooms located on main level
- Bathrooms: 1 full bathroom; 1 half bathroom
- Heating & cooling: Central air conditioning; Forced air heating (natural gas)
- Interior features: Ceiling fan(s); Partially finished basement with sump pump; 8 total rooms
- Laundry & utility: Washer; Dryer
Neighborhood map
What this means for you Summary
Snapshot
- This is a 3-bed/1.5-bath single-family listed at $340k.
Deal economics
- At list price, monthly cash flow is $-563 ($-7k/yr) — negative.
- To cash-flow at today's rent, offer at most $240k (29.3% below list).
- To meet the 1% rule (rent ≥ 1% of price), the offer needs to be $243k (28.6% below list).
- Recommended offer: $240k (29.3% below list) — sets the bar for cash-flow.
Location & tenants
- Location reads 81/100 on livability (#17 in IN, #1,427 nationally) — a professional / high-income tenant draw. Strengths: crime A+, employment A+, cost of living A+; Watch: amenities F, commute F.
- School Town Of Munster (suburban): math 65% / reading 64% proficiency, ranked #6 of 301 in IN (top 2%) — acceptable for families but not a draw, mixed tenant base, ~2y average lease; only 14% free/reduced lunch — higher-income household profile.
- Zoned schools: James B Eads Elementary School (math 75% / reading 57%, grade B+, #71 of 994 statewide, top 7%, 507 students, 33% FRL); Wilbur Wright Middle School (math 51% / reading 59%, grade B-, #26 of 330 statewide, top 8%, 908 students, 24% FRL); Munster High School (math 71% / reading 91%, grade A, #4 of 369 statewide, top 1%, 1,564 students, 23% FRL).
- Market conditions: 116 active listings in the ZIP; 3 comparable units currently listed for rent nearby; rentals leasing fast (median 12d on market — plan ~1-2 weeks tenant-placement turnaround); high-income renter base; 1,642 units permitted in Lake County in 2024 (14 in 5+ unit buildings).
Forward outlook
- Local home prices are declining (-3.0%/yr); year-one equity from $2k of loan paydown is wiped out by about $10k of value loss. Plan a longer hold.
- Lake County population projected to shrink 7% by 2050 — rents likely to lag national; underwrite the cash flow, not the appreciation.
Negotiation context
- It's been on market 17 days — a 2% lower offer ($335k) is reasonable based on typical stale-listing flexibility.
- 3 sale attempts since 9y ago with the ask held roughly flat each time — persistent listings suggest the price (not the market) is what's stuck; bring a comps-based counter.
- Current owner paid $218k; list at $340k implies a 56% gain — meaningful room to come down on a strong offer.
Questions for the listing agent
- What do current leases actually rent for vs. the listed asking? Can we see a recent rent roll and the last 12 months of T-12 income?
- Built in 1966 — when were the roof, HVAC, electrical panel, plumbing, and water heater last replaced?
- Is there a deadline driving the sale (1031 exchange, divorce, estate, relocation)? That informs how much negotiation room exists.
- Schools are A-rated — typically a magnet for longer-tenancy family renters. What's the average tenant stay here, and is there a school-zone premium baked into asking?
- The area grade is low — what's the realistic commute time and amenity access for the typical tenant pool here? Any planned neighborhood developments (good or bad) we should know about?
- What's the average days-on-market for RENTAL listings here right now (not sales)? A rising rental-DOM trend means longer vacancies and softer asking-rent achievability than the comps imply.
- What's the recent tenant-quality profile in this submarket — average credit score on applications, eviction rate, late-payment / NSF rate, and stable-employment percentage? A property-management company in the area should have these aggregated.
- How much new for-sale + rental construction is in the pipeline within 1–3 miles? Heavy new supply typically softens prices + rents 12–24 months out; constrained supply supports both.
Investment metrics
- 1% rule
- 0.71% ✗
- Cap rate
- 4.31%
- Cash-on-cash
- -7.10%
- DSCR
- 0.68
- GRM
- 11.7
CMA / ARV
- ARV (on-the-fly)
- $260,150
- Comps found
- 12
Show comp detail 12 sales within ~0.75 mi
| Address | Dist | Beds/Ba | Sqft | Sold | Price | $/sf | Match |
|---|---|---|---|---|---|---|---|
| 249 Briar Ln | 0.16mi | 3/1.0 | 1,068 (-12%) | 3mo | $280,000 | $262 | 69 |
| 8322 Harrison Ave | 0.36mi | 3/1.0 | 1,126 (-7%) | 3mo | $249,000 | $221 | 67 |
| 8560 Forest Ave | 0.27mi | 2/1.0 (-1) | 1,139 (-6%) | 8mo | $220,000 | $193 | 64 |
| 8820 Calumet Ave | 0.61mi | 3/2.0 | 1,232 (+2%) | 8mo | $269,900 | $219 | 60 |
| 18434 Wentworth Ave | 0.55mi | 3/2.0 | 1,253 (+4%) | 13mo | $270,000 | $215 | 56 |
| 8128 Jackson Ave | 0.65mi | 2/1.0 (-1) | 1,159 (-4%) | 6mo | $255,000 | $220 | 51 |
| 18747 Sherman St | 0.70mi | 3/1.0 | 1,102 (-9%) | 2mo | $149,000 | $135 | 48 |
| 18727 Sherman St | 0.69mi | 4/1.5 (+1) | 1,264 (+4%) | 9mo | $239,000 | $189 | 48 |
| 18814 Bernadine St | 0.64mi | 3/1.5 | 1,295 (+7%) | 13mo | $269,000 | $208 | 48 |
| 18540 Miller Dr | 0.59mi | 3/1.0 | 1,040 (-14%) | 6mo | $243,000 | $234 | 42 |
| 18316 Sherman St | 0.75mi | 3/1.0 | 1,056 (-13%) | 4mo | $130,000 | $123 | 39 |
| 18432 Sherman St | 0.69mi | 3/2.0 | 1,092 (-10%) | 14mo | $233,000 | $213 | 38 |
Match score weights: distance 35% · size 25% · config 20% · recency 20%. Top-matched comps best support the ARV.
Projected returns pro-forma
-3.0% appreciation · 3.0% rent growth · sell at horizon
- IRR
- -28.6%
- Equity multiple
- 0.05×
- Total profit
- $-90,810
- Equity at exit
- $50,680
- IRR
- -27.9%
- Equity multiple
- -0.31×
- Total profit
- $-124,762
- Equity at exit
- $29,388
Cash invested: $95,172 (down + closing). Projections, not guarantees.
Landlord ↔ Tenant lean methodology
- Overall (STATE)
- 90 Strongly Landlord-Friendly
- State Indiana
- 90 Strongly Landlord-Friendly · R+11
- County
- — inherits STATE
- City
- — inherits STATE
ZIP-level market 46321
- Active inventory
- 116
- Price-to-rent
- 11.7×
Monthly cashflow live
- Estimated rent
- $2,425 medium interval (Pro) →
- Mortgage (P&I)
- −$1,782
- Tax from tax record
- −$555 /mo · $6,657/yr
- Insurance
- −$142
- HOA
- −$0
- Vacancy / Maint / Mgmt
- −$509
- Net cashflow
- $-563
Break-even live
Sensitivity live
| Price | -10% $-370 | -5% $-467 | +0% $-563 | +5% $-659 | +10% $-755 |
|---|---|---|---|---|---|
| Rent | -10% $-754 | -5% $-659 | +0% $-563 | +5% $-467 | +10% $-371 |
| Rate | -1.0pp $-392 | -0.5pp $-476 | base $-563 | +0.5pp $-651 | +1.0pp $-741 |
UW: 25.0% down · 7.5% · 30yr · 1.5% tax · 5.0% vac · 8.0% maint · 8.0% mgmt
Financing live
Cash to close
- Down payment
- $84,975
- Closing costs
- $10,197
- Reserves months
- —
- Total cash needed
- —
Loan-product check · same deal, 3 products live
Conventional
25% down · 7.5% · 30yr
- Down + closing
- —
- Monthly P&I
- —
- Monthly cashflow
- —
- DSCR
- —
- Eligible?
- —
Personal DTI + credit; lowest rate.
DSCR
20% down · 8.5% · 30yr
- Down + closing
- —
- Monthly P&I
- —
- Monthly cashflow
- —
- DSCR
- —
- Eligible?
- —
No personal income docs; deal must DSCR.
Hard money
10% down · 12.0% · 12mo
- Down + closing
- —
- Monthly P&I
- —
- Monthly cashflow
- —
- DSCR
- —
- Eligible?
- —
Short-term bridge; refi at stabilization.
Rent comps 3 comps
| Address | Beds | Baths | Sqft | Rent | $/sqft | DOM | Units | Dist |
|---|---|---|---|---|---|---|---|---|
| 18335 Sherman St Unit 3 Lansing, IL | 3.0 | 1.0 | 1000 | $1,700 | $1.70 | 0d | 1 | 0.70mi |
| 3341 S Schultz Dr Lansing, IL | 4.0 | 2.0 | 1452 | $2,250 | $1.55 | 12d | 1 | 0.78mi |
| 2824 186th St Lansing, IL | 3.0 | 2.0 | 1400 | $2,900 | $2.07 | 12d | 1 | 1.42mi |
Listing history 11 events
-
2026-06-21days on market $339,900 Active 17 DOM
-
2026-06-18days on market $339,900 Active 14 DOM
-
2026-06-17days on market $339,900 Active 13 DOM
-
2026-06-16days on market $339,900 Active 12 DOM
-
2026-06-15days on market $339,900 Active 11 DOM
-
2026-06-13pricedays on market $339,900 Active 9 DOM
-
2026-06-13days on market $344,900 Active 8 DOM
-
2026-06-09days on market $344,900 Active 5 DOM
-
2026-06-08days on market $344,900 Active 4 DOM
-
2026-06-07remarks 699-char remark
-
2026-06-07$344,900 Active 3 DOM
ⓘ Source: listings_history table (triggers on properties + properties_extension) + one-shot
backfill from property_details.listing_events for pre-trigger history.
Tax reassessment forecast IN · Partial reset (capped growth)
- Current annual tax
- $6,657 · $555/mo
- Projected year-2 tax
- $6,657 · $555/mo
- Expected delta
- $0/yr ($0/mo · 0.0%)
ⓘ Screening estimate from a state-policy table — verify with the county assessor before closing.
Climate risk First Street
- Flood 3/10 Moderate FEMA zone X (unshaded) · 20% chance over 30 yrs
- Wildfire 1/10 Low
- Heat 3/10 Moderate 7 d/yr ≥102°F today · 15 d/yr by 30 yrs out
- Wind 2/10 Low 0% chance of damaging wind over 30 yrs
- Air quality 4/10 Moderate 5 unhealthy d/yr today · 6 by 30 yrs out
Nearby sold comps map
Loading sold comps map…
Walkable amenities ~0.75 mi
Loading nearby amenities…
Taxation est. · year 1
- Rental income
- $29,104
- − Mortgage interest
- −$19,040
- − Property taxes
- −$6,657
- − Insurance
- −$1,700
- − Repairs & maintenance
- −$2,328
- − Management
- −$2,328
- − Depreciation
- −$9,888
- Taxable loss
- −$12,837
- Est. tax savings @ 24.0%
- +$3,081
- After-tax cash flow
- $-3,673/yr
For passive investors: Depreciation is non-cash, so a rental often shows a tax loss while cash-flowing — sheltering income. Rental losses are passive: they offset passive income freely, and up to $25,000/yr can offset ordinary (W-2) income if you actively participate and your MAGI is under $100k (phasing out to $0 by $150k); unused losses carry forward. On sale, claimed depreciation is recaptured at up to 25%, and gains may owe capital-gains tax (a 1031 exchange can defer both). Figures are a year-1 estimate at your 24.0% rate — not tax advice; consult a CPA.
Schools (NCES district)
- District
- School Town Of Munster
- NCES district ID
- 1807350
- Math proficiency
- 65% ▼ -1.00%
- Reading proficiency
- 64% ▼ -4.00%
- Median HH income
- $71,901
- Composite
- 56.91/100
- National rank
- #1115
- State rank
- #6 of 301 in IN
Livability — Munster
- Score
- 81/100
- State rank
- #17
- US rank
- #1427
Category grades
Schools grade is shown separately in the Schools card above.
Census & demographics
- Census place
- Munster, IN
- County
- Lake County · 422,878 people
- City population
- 23,733
- Metro
- Chicago-Naperville-Elgin, IL-IN-WI
- Population (ZIP)
- 23,733
- Household income
- $110,187
- Rent vs Own
- Severe rent burden
- 338.0
Population outlook (Lake County) Hauer SSP2
- Today (2025)
- 484,026 people
- By 2030
- 478,091 · -1.2%
- By 2040
- 462,974 · -4.3%
- By 2050
- 449,894 · -7.1%
- By 2075
- 436,169 · -9.9%
- By 2100
- 426,607 · -11.9%
Race, ethnicity, and origin ACS 2023
- Neighborhood character
- Predominantly White (71%)
- Race & ethnicity
- White 71% Hispanic / Latino 14% Two or more races 8% Black 7% Asian 6%
- Hispanic origin (detail)
- Mexican 11% Puerto Rican 2%
- Common ancestry
- Romanian 16% Iranian 4% Lithuanian 1%
- Foreign-born
- 9% · Canada, South Korea, China
- Languages at home
- 86% English-only · Spanish 6% Russian/Polish/Slavic 3% Other Indo-European 2%
Political lean MEDSL · Lake
- 2024 margin
- Lean D (+5.6) · D 52.1% · R 46.5% · Other 1.5%
- 2008→2024 swing
- -28.6pp toward R · 2008: 34.3pp · 2024: 5.6pp
- All cycles
- 2024: D+5.6 2020: D+15.1 2016: D+20.6 2012: D+31.0 2008: D+34.3
Not yet ingested
- Civics
- —
Market trends
- HPI YoY
- ▼ -213.34%
- Current HPI
- 232.4818
- Rent YoY
- —
- Metro
- Chicago-Naperville-Elgin, IL-IN-WI
- State GDP YoY
- ▲ 2.90%
- F500 in state
- 18
Industry mix (Fortune 500 HQ in IN)
| Industry | F500 HQs | Revenue |
|---|---|---|
| Industrial Machinery | 2 | $37B |
|
||
| Healthcare | 1 | $177B |
|
||
| Pharmaceuticals | 1 | $45B |
|
||
| Metals / Steel | 1 | $18B |
|
||
| Agriculture | 1 | $17B |
|
||
| Packaging | 1 | $12B |
|
||
Price history
+53.6% since first listed5 events — show timeline
- 2026-06-04 Listed $344,900 NIRA MLS as Distributed by MLS Grid
- 2025-04-17 Rental Removed $2,395 TURBOTENANT
- 2025-04-11 Listed for Rent $2,395 TURBOTENANT
- 2017-04-10 Sold (MLS) $217,500 NIRA MLS as Distributed by MLS Grid
- 2017-01-20 Listed $224,500 NIRA MLS as Distributed by MLS Grid
Property tax history
+10.0%/yrLatest (2024): $6,657 · +6.9% YoY. Source: county tax records.
Cash-flow waterfall
monthlySold comps — $/sqft
last 12 mo · ≤1 miLoading sold comps…