 20-Plex
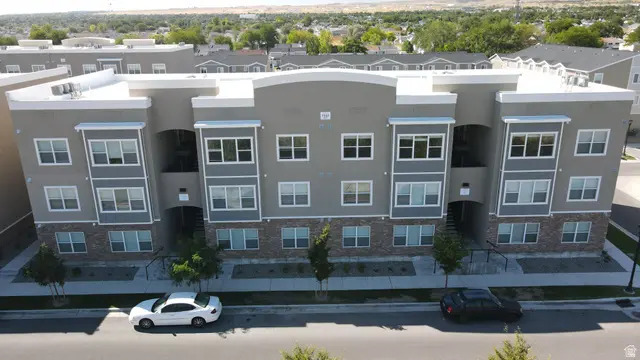
7337 W Louden Dr · Magna, UT
Flood risk 1/10 · Minimal
- FEMA flood zone
- X (unshaded)
- Chance of flooding over 30 yrs
- 0.0%
- Est. flood insurance / yr
- $507 – $1,088
Fire risk 5/10 · Moderate
- Est. fire insurance / yr
- $453 – $841
Heat risk 5/10 · Moderate
- Hot days now (above 95°F)
- 7 days/yr
- Hot days in 30 yrs
- 19 days/yr
Wind risk 1/10 · Minimal
- Chance of severe wind over 30 yrs
- —
Air-quality risk 3/10 · Minor
- Unhealthy air days now
- 3 days/yr
- Unhealthy air days in 30 yrs
- 4 days/yr
Risk factors via First Street. Map © Google.
Why this score? — see what drove the D+ grade
The composite is a weighted blend of 9 inputs, each scored 0–100. Each bar is that input's sub-score; the figure is the points it added to the 100-point composite (weight × sub-score).
- Cash flow +17.2/30.0
- ARV discount +7.5/15.0
- DSCR +5.4/10.0
- 1% rule +4.9/10.0
- Condition / age +4.8/5.0
- Livability +3.7/5.0
- Schools +2.6/10.0
- Rent growth +2.5/5.0
- Appreciation +0.0/10.0
$3,850,000
🖨 Deal sheet 📄 Offer letter ✓ Due diligence
Multi-family units
County records classify this as Multi-Family (5+ Unit). Listing-text estimate: 20 units. confirmed
5+ unit building — per-unit beds/baths from public records are typically unavailable; the breakdown below (if shown) is an estimate from the listing text.
Listing remarks
Built in 2020, this 20-unit asset at 7337 W Louden Grove Drive offers a "turn-key" investment in the high-growth Salt Lake Valley. The property features an exceptional unit mix of 16 expansive 1-bed/1-bath units (902 sq ft) and 4 oversized 2-bed/1-bath units (1,322 sq ft), providing significantly more living space than the market average to attract hard working, long-term tenants. Situated just 15 minutes from Downtown SLC with immediate access to the Hwy 201 corridor, this low-maintenance building combines modern construction with the lifestyle amenities of the Colony Farms community, representing a premier opportunity for long-term appreciation in Utah's strongest rental submark
Key facts
- Turn-key investment
- Modern construction
- Premier opportunity
Tags
Property features AI
Finance
- Other: 20 total units
- Financial info: Property used for residential purposes; Zoned R-M/ZC for multi-family
- HOA & community: Homeowners association with annual fee; Association amenities include management, pet rules, picnic area, playground, pool, and snow removal; Community clubhouse
Exterior
- Parking: Covered parking for 8 vehicles; 8 total parking spaces; 8 garage spaces
- Utilities: Natural gas connected; Electricity connected; Public sewer connected; Water connected (culinary)
- Home design: Multi-family property; 3 stories; Built/Standing condition
- Construction: Brick and stucco construction; Membrane roof
- Exterior features: Private in-ground heated pool with fence
Interior
- Flooring: Carpet
- Heating & cooling: Forced air heating
- Interior features: Blinds on windows; Carpet flooring
Neighborhood map
What this means for you Summary
Snapshot
- This is a 20 × 24-bed/20.0-bath units multifamily listed at $3.85M. Condition is rated excellent.
Deal economics
- At list price, monthly cash flow is $3k ($33k/yr) — positive. Per door: $138/mo.
- The deal already cash-flows at list — no discount required.
- To meet the 1% rule (rent ≥ 1% of price), the offer needs to be $3.80M (1.4% below list).
- Recommended offer: $3.62M (6.0% below list) — sets the bar for market timing.
Location & tenants
- Location reads 74/100 on livability (#65 in UT, #4,367 nationally) — a middle-class / working-renter tenant base. Strengths: commute A+, housing A+, cost of living B; Watch: amenities F, health & safety D-.
- Granite District (suburban): math 26% / reading 32% proficiency, ranked #69 of 80 in UT (top 86%) — low school quality limits family demand, transient renter base, plan for 1-2y turnover.
- Zoned schools: Lake Ridge School (math 13% / reading 14%, grade F, #566 of 585 statewide, top 97%, 422 students, 59% FRL); Scott M Matheson Jr High (math 18% / reading 22%, grade F, #128 of 138 statewide, top 93%, 1,081 students, 51% FRL); Cyprus High (math 11% / reading 33%, grade F, #150 of 171 statewide, top 88%, 2,709 students, 47% FRL).
- Market conditions: 207 active listings in the ZIP; solid renter incomes; 4,970 units permitted in Salt Lake County in 2024 (1,963 in 5+ unit buildings).
- At $37,975/mo this rent would consume 504% of the median local household income ($90k/yr) (locally 384% of renters already pay >50% of income on rent) — very limited rent-growth headroom before tenants either downsize or default.
Forward outlook
- Local home prices are declining (-3.0%/yr); year-one equity from $27k of loan paydown is wiped out by about $116k of value loss. Plan a longer hold.
- Salt Lake County population projected at +37% by 2050 — long-run rental-demand tailwind backs the buy-and-hold thesis.
Negotiation context
- It's been on market 78 days — a 6% lower offer ($3.62M) is reasonable based on typical stale-listing flexibility.
- 5 sale attempts since 2y ago with the ask held roughly flat each time — persistent listings suggest the price (not the market) is what's stuck; bring a comps-based counter.
Risks & watch-outs
- Climate carrying-cost: moderate wildfire risk; extreme-heat days projected 7→19/yr by 2055 (HVAC capex compounding) — expect insurance premiums to compound above CPI over the hold.
Questions for the listing agent
- It's been on market 78 days. Have you received any prior offers? Is the seller open to a 6% concession, seller financing, or rate buy-down credit?
- Can we see the unit-by-unit rent roll, current vacancy, and any below-market leases? What's the average tenancy length?
- What capital expenditures (roof, boiler, parking lot, exteriors) have been made in the last 5 years, and what's planned in the next 2?
- What does the HOA fee cover, when was the last increase, and are there any pending special assessments or reserve-fund shortfalls?
- Why hasn't it sold? Are there any deal-killer items the seller is aware of (foundation, flood, title, zoning, code violations)?
- Is there a deadline driving the sale (1031 exchange, divorce, estate, relocation)? That informs how much negotiation room exists.
- Schools are F-rated, which usually means shorter tenancies and higher turnover. Who's the typical renter profile here, and what's been the actual vacancy rate?
- The area grade is low — what's the realistic commute time and amenity access for the typical tenant pool here? Any planned neighborhood developments (good or bad) we should know about?
- What's the average days-on-market for RENTAL listings here right now (not sales)? A rising rental-DOM trend means longer vacancies and softer asking-rent achievability than the comps imply.
- What's the recent tenant-quality profile in this submarket — average credit score on applications, eviction rate, late-payment / NSF rate, and stable-employment percentage? A property-management company in the area should have these aggregated.
- How much new apartment / multifamily construction is in the pipeline within 1–3 miles? Heavy new supply (>2% of stock underway) typically softens rents 12–24 months out; light construction supports rent growth.
Investment metrics
- 1% rule
- 0.99% ✗
- Cap rate
- 7.15%
- Cash-on-cash
- 3.07%
- DSCR
- 1.14
- GRM
- 8.4
CMA / ARV
No comps found within radius.
Projected returns pro-forma
-3.0% appreciation · 3.0% rent growth · sell at horizon
- IRR
- -11.4%
- Equity multiple
- 0.59×
- Total profit
- $-447,001
- Equity at exit
- $574,048
- IRR
- -2.2%
- Equity multiple
- 0.85×
- Total profit
- $-158,831
- Equity at exit
- $332,878
Cash invested: $1,078,000 (down + closing). Projections, not guarantees.
Landlord ↔ Tenant lean methodology
- Overall (STATE)
- 86 Strongly Landlord-Friendly
- State Utah
- 86 Strongly Landlord-Friendly · R+15
- County
- — inherits STATE
- City
- — inherits STATE
ZIP-level market 84044
- Active inventory
- 207
- Price-to-rent
- 169.0×
Monthly cashflow live
- Estimated rent
- $37,975 medium interval (Pro) →
- Mortgage (P&I)
- −$20,190
- Tax from tax record
- −$2,713 /mo · $32,561/yr
- Insurance
- −$1,604
- HOA
- −$2,731
- Vacancy / Maint / Mgmt
- −$7,975
- Net cashflow
- $2,762
Break-even live
20-unit breakdown (identical units grouped — click to expand)
| Units | Beds | Baths | Est. rent |
|---|---|---|---|
| 20× units | 24 | 20 | $37,980 |
| #1 | 24 | 20 | $1,899 |
| #2 | 24 | 20 | $1,899 |
| #3 | 24 | 20 | $1,899 |
| #4 | 24 | 20 | $1,899 |
| #5 | 24 | 20 | $1,899 |
| #6 | 24 | 20 | $1,899 |
| #7 | 24 | 20 | $1,899 |
| #8 | 24 | 20 | $1,899 |
| #9 | 24 | 20 | $1,899 |
| #10 | 24 | 20 | $1,899 |
| #11 | 24 | 20 | $1,899 |
| #12 | 24 | 20 | $1,899 |
| #13 | 24 | 20 | $1,899 |
| #14 | 24 | 20 | $1,899 |
| #15 | 24 | 20 | $1,899 |
| #16 | 24 | 20 | $1,899 |
| #17 | 24 | 20 | $1,899 |
| #18 | 24 | 20 | $1,899 |
| #19 | 24 | 20 | $1,899 |
| #20 | 24 | 20 | $1,899 |
| Total (20 units) | $37,975 | ||
UW: 25.0% down · 7.5% · 30yr · 1.5% tax · 5.0% vac · 8.0% maint · 8.0% mgmt
Financing live
Cash to close
- Down payment
- $962,500
- Closing costs
- $115,500
- Reserves months
- —
- Total cash needed
- —
Loan-product check · same deal, 3 products live
Conventional
25% down · 7.5% · 30yr
- Down + closing
- —
- Monthly P&I
- —
- Monthly cashflow
- —
- DSCR
- —
- Eligible?
- —
Personal DTI + credit; lowest rate.
DSCR
20% down · 8.5% · 30yr
- Down + closing
- —
- Monthly P&I
- —
- Monthly cashflow
- —
- DSCR
- —
- Eligible?
- —
No personal income docs; deal must DSCR.
Hard money
10% down · 12.0% · 12mo
- Down + closing
- —
- Monthly P&I
- —
- Monthly cashflow
- —
- DSCR
- —
- Eligible?
- —
Short-term bridge; refi at stabilization.
HOA detail
- Monthly dues
- $2,731 · $32,772/yr
Listing history 21 events
-
2026-06-07status $3,850,000 Under Contract 78 DOM
-
2026-06-03days on market $3,850,000 Active 78 DOM
-
2026-06-02days on market $3,850,000 Active 77 DOM
-
2026-06-01days on market $3,850,000 Active 76 DOM
-
2026-05-31days on market $3,850,000 Active 75 DOM
-
2026-03-17$3,850,000 Active
-
2025-05-08historical $1,425
-
2025-04-01$1,425
-
2025-02-24historical
-
2025-02-03price $4,050,000
-
2024-12-16historical $1,425
-
2024-10-20price $1,425
-
2024-10-04price $4,550,000
-
2024-08-29price $1,395
-
2024-08-27$4,850,000 Active
-
2024-07-24$1,425
-
2024-07-05historical $1,425
-
2024-06-19price $1,425
-
2024-05-04price $1,395
-
2024-04-17price $1,425
-
2024-04-10$1,395
ⓘ Source: listings_history table (triggers on properties + properties_extension) + one-shot
backfill from property_details.listing_events for pre-trigger history.
Tax reassessment forecast UT · Resets to sale price
- Current annual tax
- $32,561 · $2,713/mo
- Projected year-2 tax
- $32,561 · $2,713/mo
- Expected delta
- $0/yr ($0/mo · 0.0%)
ⓘ Screening estimate from a state-policy table — verify with the county assessor before closing.
Climate risk First Street
- Flood 1/10 Low FEMA zone X (unshaded) · 0% chance over 30 yrs
- Wildfire 5/10 Major
- Heat 5/10 Major 7 d/yr ≥95°F today · 19 d/yr by 30 yrs out
- Wind 1/10 Low
- Air quality 3/10 Moderate 3 unhealthy d/yr today · 4 by 30 yrs out
Nearby sold comps map
Loading sold comps map…
Walkable amenities ~0.75 mi
Loading nearby amenities…
Taxation est. · year 1
- Rental income
- $455,700
- − Mortgage interest
- −$215,660
- − Property taxes
- −$32,561
- − Insurance
- −$19,250
- − Repairs & maintenance
- −$36,456
- − Management
- −$36,456
- − HOA
- −$32,772
- − Depreciation
- −$112,000
- Taxable loss
- −$29,455
- Est. tax savings @ 24.0%
- +$7,069
- After-tax cash flow
- $40,211/yr
For passive investors: Depreciation is non-cash, so a rental often shows a tax loss while cash-flowing — sheltering income. Rental losses are passive: they offset passive income freely, and up to $25,000/yr can offset ordinary (W-2) income if you actively participate and your MAGI is under $100k (phasing out to $0 by $150k); unused losses carry forward. On sale, claimed depreciation is recaptured at up to 25%, and gains may owe capital-gains tax (a 1031 exchange can defer both). Figures are a year-1 estimate at your 24.0% rate — not tax advice; consult a CPA.
Condition & rehab AI · 12 photos
This 20-unit multi-family property built in 2020 is in excellent condition with modern amenities and a turn-key investment opportunity.
Value-add opportunities
- Both Landscaping improvements — Enhances curb appeal and adds value to the property.
- Both Painting exterior walls — Fresh paint can improve the property's appearance and value.
- Both Upgrading window treatments — Modern window treatments can enhance the property's curb appeal and value.
- Both Adding smart home features — Smart home features can increase the property's appeal and value to potential tenants and buyers.
- Both Upgrading kitchen appliances — Modern appliances can improve the property's appeal and value to potential tenants and buyers.
- Both Upgrading bathroom fixtures — Modern fixtures can improve the property's appeal and value to potential tenants and buyers.
Renovation cost estimate screening
Value-add ROI direction
- Both Landscaping improvements — Enhances curb appeal and adds value to the property. ↑
- Both Painting exterior walls — Fresh paint can improve the property's appearance and value. ↑
- Both Upgrading window treatments — Modern window treatments can enhance the property's curb appeal and value. ↑
- Both Adding smart home features — Smart home features can increase the property's appeal and value to potential tenants and buyers. ↑
- Both Upgrading kitchen appliances — Modern appliances can improve the property's appeal and value to potential tenants and buyers. ↑
- Both Upgrading bathroom fixtures — Modern fixtures can improve the property's appeal and value to potential tenants and buyers. ↑
ⓘ Cost ranges are severity-bucket heuristics (US national rule-of-thumb). Get contractor quotes + a written scope before underwriting a rehab budget.
Schools (NCES district)
- District
- Granite District
- NCES district ID
- 4900360
- Math proficiency
- 26% ▼ -8.00%
- Reading proficiency
- 32% ▼ -3.00%
- Median HH income
- $55,971
- Composite
- 25.93/100
- National rank
- #7336
- State rank
- #69 of 80 in UT
Livability — Magna
- Score
- 74/100
- State rank
- #65
- US rank
- #4367
Category grades
Schools grade is shown separately in the Schools card above.
Census & demographics
- Census place
- Magna, UT
- County
- Salt Lake County · 1,195,750 people
- City population
- 30,031
- Metro
- Salt Lake City, UT
- Population (ZIP)
- 30,031
- Household income
- $90,346
- Rent vs Own
- Severe rent burden
- 384.0
Population outlook (Salt Lake County) Hauer SSP2
- Today (2025)
- 1,305,860 people
- By 2030
- 1,402,611 · +7.4%
- By 2040
- 1,594,533 · +22.1%
- By 2050
- 1,787,244 · +36.9%
- By 2075
- 2,224,138 · +70.3%
- By 2100
- 2,551,390 · +95.4%
Race, ethnicity, and origin ACS 2023
- Neighborhood character
- Diverse neighborhood (Simpson 0.58)
- Race & ethnicity
- White 54% Hispanic / Latino 36% Two or more races 14% Asian 2% Pacific Islander 2% Black 2%
- Hispanic origin (detail)
- Mexican 28%
- Common ancestry
- Slovak 4% Iranian 2% Italian 2%
- Foreign-born
- 16% · Canada, Jamaica
- Languages at home
- 71% English-only · Spanish 24% Other Asian/Pacific 2% Other Indo-European 2%
Political lean MEDSL · Salt Lake
- 2024 margin
- D (+10.2) · D 53.7% · R 43.5% · Other 2.8%
- 2008→2024 swing
- +10.1pp toward D · 2008: 0.1pp · 2024: 10.2pp
- All cycles
- 2024: D+10.2 2020: D+11.0 2016: D+10.2 2012: R+19.3 2008: D+0.1
Not yet ingested
- Civics
- —
Market trends
- HPI YoY
- ▼ -191.88%
- Current HPI
- 355.0523
- Rent YoY
- —
- Metro
- Salt Lake City, UT
- State GDP YoY
- ▲ 3.54%
- F500 in state
- 2
Industry mix (Fortune 500 HQ in UT)
| Industry | F500 HQs | Revenue |
|---|---|---|
| Financial Services | 1 | $3B |
|
||
Price history
+275885.7% since first listed16 events — show timeline
- 2026-03-17 Listed $3,850,000 WFRMLS
- 2025-05-08 Rental Removed $1,425 APPFOLIO
- 2025-04-01 Listed for Rent $1,425 APPFOLIO
- 2025-02-24 Listing Removed — WFRMLS
- 2025-02-03 Price Changed $4,050,000 WFRMLS
- 2024-12-16 Rental Removed $1,425 APPFOLIO
- 2024-10-20 Price Changed $1,425 APPFOLIO
- 2024-10-04 Price Changed $4,550,000 WFRMLS
- 2024-08-29 Price Changed $1,395 APPFOLIO
- 2024-08-27 Listed $4,850,000 WFRMLS
- 2024-07-24 Listed for Rent $1,425 APPFOLIO
- 2024-07-05 Rental Removed $1,425 APPFOLIO
- 2024-06-19 Price Changed $1,425 APPFOLIO
- 2024-05-04 Price Changed $1,395 APPFOLIO
- 2024-04-17 Price Changed $1,425 APPFOLIO
- 2024-04-10 Listed for Rent $1,395 APPFOLIO
Property tax history
+92.5%/yrLatest (2025): $32,561 · +1.7% YoY. Source: county tax records.
Cash-flow waterfall
monthlySold comps — $/sqft
last 12 mo · ≤1 miLoading sold comps…