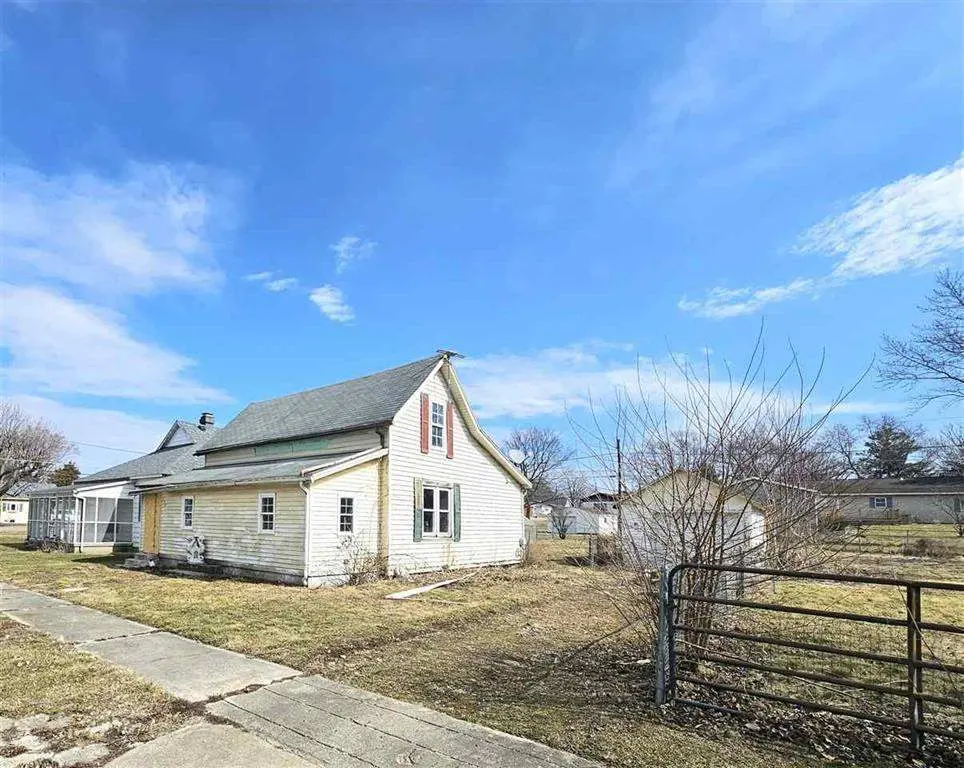
132 Pennsylvania St · Shirley, IN
Flood risk 1/10 · Minimal
- FEMA flood zone
- X (unshaded)
- Chance of flooding over 30 yrs
- 0.0%
- Est. flood insurance / yr
- $507 – $1,088
Fire risk 1/10 · Minimal
- Est. fire insurance / yr
- $717 – $1,331
Heat risk 3/10 · Minor
- Hot days now (above 101°F)
- 7 days/yr
- Hot days in 30 yrs
- 18 days/yr
Wind risk 2/10 · Minimal
- Chance of severe wind over 30 yrs
- 1.0%
Air-quality risk 2/10 · Minimal
- Unhealthy air days now
- 1 days/yr
- Unhealthy air days in 30 yrs
- 3 days/yr
Risk factors via First Street. Map © Google.
Why this score? — see what drove the B grade
The composite is a weighted blend of 9 inputs, each scored 0–100. Each bar is that input's sub-score; the figure is the points it added to the 100-point composite (weight × sub-score).
- Cash flow +27.7/30.0
- ARV discount +15.0/15.0
- DSCR +9.7/10.0
- 1% rule +7.0/10.0
- Schools +4.3/10.0
- Rent growth +3.6/5.0
- Livability +3.3/5.0
- Condition / age +2.5/5.0
- Appreciation +0.0/10.0
$88,999
🖨 Deal sheet (PDF) 📄 Offer letter ✓ Due diligence
Listing remarks
SELLER FINANCING AVAILABLE! Discover the potential of this unique property in Shirley, Indiana. Set on a spacious 0.39-acre lot, this home offers a large yard, perfect for outdoor activities or creating your own oasis. Built in 1926, this charming home is sold * * as-is * * and requires repairs, making it an excellent opportunity for investors or those seeking a renovation project. Featuring 2 bedrooms, 1 bathroom, and a detached garage for additional storage, this property provides a solid foundation to bring your vision to life. Located in a peaceful neighborhood with convenient access to amenities and major routes, this is your chance to turn possibility into reality. Contact Brian I
Key facts
- Convenient access
- Large yard
- Spacious lot
Tags
Property features AI
Exterior
- Parking: Detached gravel garage (1 car)
- Utilities: Public water; Public sewer
- Home design: Single-family residence; 1 story
- Construction: Vinyl siding
- Exterior features: Chain link fencing; Shingle roof
Interior
- Bathrooms: 1 full bathroom
- Heating & cooling: Natural gas heating
- Interior features: Electric water heater; 6 total rooms
Neighborhood map
What this means for you Summary
Snapshot
- This is a 2-bed/1.0-bath single-family listed at $89k.
Deal economics
- At list price, monthly cash flow is $268 ($3k/yr) — positive.
- The deal already cash-flows at list — no discount required.
- Meets the 1% rule at list price ($1k rent vs $89k).
- Recommended offer: $86k (3.0% below list) — sets the bar for market timing.
Location & tenants
- Location reads 66/100 on livability (#287 in IN) — a middle-class / working-renter tenant base. Strengths: crime A+, cost of living A+, housing A+; Watch: health & safety C-, amenities F, commute F.
- Eastern Hancock County Community School Corporation (rural): math 48% / reading 50% proficiency, ranked #49 of 301 in IN (top 16%) — families likely to look elsewhere, expect single-tenant / working-renter base with shorter leases.
- Zoned schools: Eastern Hancock Elementary School (math 57% / reading 47%, grade C-, #237 of 994 statewide, top 26%, 533 students, 32% FRL); Eastern Hancock Middle School (math 38% / reading 44%, grade F, #113 of 330 statewide, top 35%, 268 students, 35% FRL); Eastern Hancock High School (math 52% / reading 72%, grade B-, #41 of 369 statewide, top 12%, 378 students, 31% FRL).
- Market conditions: Rents rising fast (+4.6%/yr); 217 active listings in the ZIP; 1 comparable units currently listed for rent nearby; 1,091 units permitted in Hancock County in 2024 (0 in 5+ unit buildings).
Forward outlook
- Local home prices are declining (-3.0%/yr); year-one equity from $615 of loan paydown is wiped out by about $3k of value loss. Plan a longer hold.
- Hancock County population projected at +7% by 2050 — modest demand growth; plan on rents tracking national, not racing it.
- At projected returns (-3.0% appreciation + 4.6% rent growth), your $25k cash investment doubles in ~8 years — after that, you're playing with house money.
Negotiation context
- It's been on market 53 days — a 3% lower offer ($86k) is reasonable based on typical stale-listing flexibility.
- 4 sale attempts since 25y ago with the ask held roughly flat each time — persistent listings suggest the price (not the market) is what's stuck; bring a comps-based counter.
- Current owner paid $45k; list at $89k implies a 98% gain — meaningful room to come down on a strong offer.
Risks & watch-outs
- Watch-outs: built in 1926 — expect roof / HVAC / electrical / plumbing capex.
Questions for the listing agent
- It's been on market 53 days. Have you received any prior offers? Is the seller open to a 3% concession, seller financing, or rate buy-down credit?
- Built in 1926 — when were the roof, HVAC, electrical panel, plumbing, and water heater last replaced?
- Is there a deadline driving the sale (1031 exchange, divorce, estate, relocation)? That informs how much negotiation room exists.
- Schools are F-rated, which usually means shorter tenancies and higher turnover. Who's the typical renter profile here, and what's been the actual vacancy rate?
- What's the average days-on-market for RENTAL listings here right now (not sales)? A rising rental-DOM trend means longer vacancies and softer asking-rent achievability than the comps imply.
- What's the recent tenant-quality profile in this submarket — average credit score on applications, eviction rate, late-payment / NSF rate, and stable-employment percentage? A property-management company in the area should have these aggregated.
- How much new for-sale + rental construction is in the pipeline within 1–3 miles? Heavy new supply typically softens prices + rents 12–24 months out; constrained supply supports both.
Investment metrics
- 1% rule
- 1.20% ✓
- Cap rate
- 9.91%
- Cash-on-cash
- 12.90%
- DSCR
- 1.57
- GRM
- 6.9
CMA / ARV
- ARV (on-the-fly)
- $162,792
- Comps found
- 6
Show comp detail 6 sales within ~0.75 mi
| Address | Dist | Beds/Ba | Sqft | Sold | Price | $/sf | Match |
|---|---|---|---|---|---|---|---|
| 209 Pennsylvania St | 0.07mi | 3/1.0 (+1) | 1,062 (-0%) | 12mo | $163,000 | $153 | 81 |
| 206 Pennsylvania St | 0.05mi | 3/1.0 (+1) | 990 (-7%) | 3mo | $150,000 | $152 | 79 |
| 205 Pennsylvania St | 0.06mi | 2/2.0 | 962 (-10%) | 17mo | $155,000 | $161 | 63 |
| 102 South St | 0.37mi | 2/1.0 | 996 (-6%) | 14mo | $72,500 | $73 | 61 |
| 204 Varner St | 0.42mi | 3/2.0 (+1) | 1,000 (-6%) | 1mo | $195,000 | $195 | 61 |
| 609 Main St | 0.47mi | 2/1.0 | 988 (-7%) | 15mo | $90,000 | $91 | 54 |
Match score weights: distance 35% · size 25% · config 20% · recency 20%. Top-matched comps best support the ARV.
Projected returns pro-forma
-3.0% appreciation · 4.59% rent growth · sell at horizon
- IRR
- 4.5%
- Equity multiple
- 1.18×
- Total profit
- $4,370
- Equity at exit
- $13,270
- IRR
- 15.3%
- Equity multiple
- 2.33×
- Total profit
- $33,098
- Equity at exit
- $7,695
Cash invested: $24,920 (down + closing). Projections, not guarantees.
Landlord ↔ Tenant lean methodology
- Overall (STATE)
- 90 Strongly Landlord-Friendly
- State Indiana
- 90 Strongly Landlord-Friendly · R+11
- County
- — inherits STATE
- City
- — inherits STATE
ZIP-level market 47362
- Home prices YoY
- -16.0%
- Rents YoY
- 4.6%
- Active inventory
- 217
- Price-to-rent
- 6.9×
Monthly cashflow live
- Estimated rent
- $1,067 medium interval (Pro) →
- Mortgage (P&I)
- −$467
- Tax from tax record
- −$72 /mo · $858/yr
- Insurance
- −$37
- HOA
- −$0
- Vacancy / Maint / Mgmt
- −$224
- Net cashflow
- $268
Break-even live
Sensitivity live
| Price | -10% $318 | -5% $293 | +0% $268 | +5% $243 | +10% $218 |
|---|---|---|---|---|---|
| Rent | -10% $184 | -5% $226 | +0% $268 | +5% $310 | +10% $352 |
| Rate | -1.0pp $313 | -0.5pp $291 | base $268 | +0.5pp $245 | +1.0pp $221 |
UW: 25.0% down · 7.5% · 30yr · 1.5% tax · 5.0% vac · 8.0% maint · 8.0% mgmt
Financing live
Cash to close
- Down payment
- $22,250
- Closing costs
- $2,670
- Reserves months
- —
- Total cash needed
- —
Loan-product check · same deal, 3 products live
Conventional
25% down · 7.5% · 30yr
- Down + closing
- —
- Monthly P&I
- —
- Monthly cashflow
- —
- DSCR
- —
- Eligible?
- —
Personal DTI + credit; lowest rate.
DSCR
20% down · 8.5% · 30yr
- Down + closing
- —
- Monthly P&I
- —
- Monthly cashflow
- —
- DSCR
- —
- Eligible?
- —
No personal income docs; deal must DSCR.
Hard money
10% down · 12.0% · 12mo
- Down + closing
- —
- Monthly P&I
- —
- Monthly cashflow
- —
- DSCR
- —
- Eligible?
- —
Short-term bridge; refi at stabilization.
Rent comps 1 comps
| Address | Beds | Baths | Sqft | Rent | $/sqft | DOM | Units | Dist |
|---|---|---|---|---|---|---|---|---|
| 226 Walnut St Wilkinson, IN | 2.0 | 1.0 | 1010 | $1,450 | $1.44 | 4d | 1 | 1.39mi |
Listing history 23 events
-
2026-06-21days on market $88,999 Active 53 DOM
-
2026-06-18days on market $88,999 Active 50 DOM
-
2026-06-17days on market $88,999 Active 49 DOM
-
2026-06-16days on market $88,999 Active 48 DOM
-
2026-06-15days on market $88,999 Active 47 DOM
-
2026-06-13days on market $88,999 Active 45 DOM
-
2026-06-13days on market $88,999 Active 44 DOM
-
2026-06-09days on market $88,999 Active 41 DOM
-
2026-06-08days on market $88,999 Active 40 DOM
-
2026-06-07days on market $88,999 Active 39 DOM
-
2026-06-03days on market $88,999 Active 35 DOM
-
2026-06-02days on market $88,999 Active 34 DOM
-
2026-06-01days on market $88,999 Active 33 DOM
-
2026-05-31days on market $88,999 Active 32 DOM
-
2026-04-29$88,999 Active
-
2025-11-18price $88,999
-
2014-12-29soldstatus $44,900
-
2002-07-14historical
-
2002-03-29historical
-
2002-02-15$68,000
-
2001-09-08historical
-
2001-06-29$63,900
-
2001-03-09$64,900
ⓘ Source: listings_history table (triggers on properties + properties_extension) + one-shot
backfill from property_details.listing_events for pre-trigger history.
Tax reassessment forecast IN · Partial reset (capped growth)
- Current annual tax
- $858 · $72/mo
- Projected year-2 tax
- $858 · $72/mo
- Expected delta
- $0/yr ($0/mo · 0.0%)
ⓘ Screening estimate from a state-policy table — verify with the county assessor before closing.
Climate risk First Street
- Flood 1/10 Low FEMA zone X (unshaded) · 0% chance over 30 yrs
- Wildfire 1/10 Low
- Heat 3/10 Moderate 7 d/yr ≥101°F today · 18 d/yr by 30 yrs out
- Wind 2/10 Low 100% chance of damaging wind over 30 yrs
- Air quality 2/10 Low 1 unhealthy d/yr today · 3 by 30 yrs out
Nearby sold comps map
Loading sold comps map…
Walkable amenities ~0.75 mi
Loading nearby amenities…
Taxation est. · year 1
- Rental income
- $12,809
- − Mortgage interest
- −$4,985
- − Property taxes
- −$858
- − Insurance
- −$445
- − Repairs & maintenance
- −$1,025
- − Management
- −$1,025
- − Depreciation
- −$2,589
- Taxable income
- $1,882
- Est. tax owed @ 24.0%
- −$452
- After-tax cash flow
- $2,764/yr
For passive investors: Depreciation is non-cash, so a rental often shows a tax loss while cash-flowing — sheltering income. Rental losses are passive: they offset passive income freely, and up to $25,000/yr can offset ordinary (W-2) income if you actively participate and your MAGI is under $100k (phasing out to $0 by $150k); unused losses carry forward. On sale, claimed depreciation is recaptured at up to 25%, and gains may owe capital-gains tax (a 1031 exchange can defer both). Figures are a year-1 estimate at your 24.0% rate — not tax advice; consult a CPA.
Schools (NCES district)
- District
- Eastern Hancock County Community School Corporation
- NCES district ID
- 1803120
- Math proficiency
- 48% ▼ -15.00%
- Reading proficiency
- 50% ▼ -7.00%
- Median HH income
- $62,582
- Composite
- 43.16/100
- National rank
- #3071
- State rank
- #49 of 301 in IN
Livability — Shirley
- Score
- 66/100
- State rank
- #287
- US rank
- #11700
Category grades
Schools grade is shown separately in the Schools card above.
Census & demographics
- Census place
- Shirley, IN
- County
- Henry County · 29,337 people
- City population
- 29,337
- Metro
- New Castle, IN
- Population (ZIP)
- 29,337
- Household income
- $60,258
- Rent vs Own
- Severe rent burden
- 545.0
Population outlook (Hancock County) Hauer SSP2
- Today (2025)
- 77,820 people
- By 2030
- 79,914 · +2.7%
- By 2040
- 82,734 · +6.3%
- By 2050
- 83,348 · +7.1%
- By 2075
- 82,439 · +5.9%
- By 2100
- 74,181 · -4.7%
Race, ethnicity, and origin ACS 2023
- Neighborhood character
- Predominantly White (90%)
- Race & ethnicity
- White 90% Two or more races 3% Black 3% Hispanic / Latino 3%
- Common ancestry
- Italian 2% Slovak 1% Lithuanian 1%
- Foreign-born
- 2% · Canada
- Languages at home
- 97% English-only · Spanish 2%
Political lean MEDSL · Hancock
- 2024 margin
- Solid R (+33.7) · D 32.2% · R 65.9% · Other 1.9%
- 2008→2024 swing
- -4.1pp toward R · 2008: -29.6pp · 2024: -33.7pp
- All cycles
- 2024: R+33.7 2020: R+37.5 2016: R+44.8 2012: R+41.0 2008: R+29.6
Not yet ingested
- Civics
- —
Market trends
- HPI YoY
- ▼ -43.70%
- Current HPI
- 228.8885
- Rent YoY
- ▲ 4.59%
- Metro
- New Castle, IN
- State GDP YoY
- ▲ 2.90%
- F500 in state
- 18
Industry mix (Fortune 500 HQ in IN)
| Industry | F500 HQs | Revenue |
|---|---|---|
| Industrial Machinery | 2 | $37B |
|
||
| Healthcare | 1 | $177B |
|
||
| Pharmaceuticals | 1 | $45B |
|
||
| Metals / Steel | 1 | $18B |
|
||
| Agriculture | 1 | $17B |
|
||
| Packaging | 1 | $12B |
|
||
Price history
+37.1% since first listed9 events — show timeline
- 2026-04-29 Listed $88,999 RRELMS
- 2025-11-18 Price Changed $88,999 RRELMS
- 2014-12-29 Sold (Public Records) $44,900 Public Records
- 2002-07-14 Listing Removed — MIBOR as Distributed by MLS Grid
- 2002-03-29 Listing Removed — MIBOR as Distributed by MLS Grid
- 2002-02-15 Listed $68,000 MIBOR as Distributed by MLS Grid
- 2001-09-08 Listing Removed — MIBOR as Distributed by MLS Grid
- 2001-06-29 Listed $63,900 MIBOR as Distributed by MLS Grid
- 2001-03-09 Listed $64,900 MIBOR as Distributed by MLS Grid
Property tax history
-3.2%/yrLatest (2025): $858 · -5.6% YoY. Source: county tax records.
Cash-flow waterfall
monthlySold comps — $/sqft
last 12 mo · ≤1 miLoading sold comps…