 Duplex
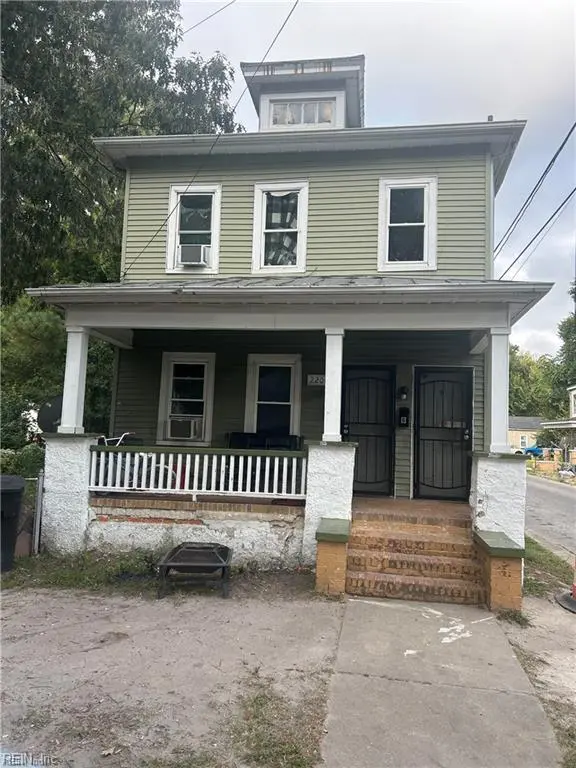
2200 Pearl St · Portsmouth, VA
Flood risk 5/10 · Moderate
- FEMA flood zone
- X (shaded)
- Chance of flooding over 30 yrs
- 0.52%
- Est. flood insurance / yr
- $507 – $1,088
Fire risk 1/10 · Minimal
- Est. fire insurance / yr
- $666 – $1,236
Heat risk 9/10 · Severe
- Hot days now (above 106°F)
- 7 days/yr
- Hot days in 30 yrs
- 16 days/yr
Wind risk 8/10 · Major
- Chance of severe wind over 30 yrs
- 80.0%
Air-quality risk 5/10 · Moderate
- Unhealthy air days now
- 6 days/yr
- Unhealthy air days in 30 yrs
- 7 days/yr
Risk factors via First Street. Map © Google.
Why this score? — see what drove the B+ grade
The composite is a weighted blend of 9 inputs, each scored 0–100. Each bar is that input's sub-score; the figure is the points it added to the 100-point composite (weight × sub-score).
- Cash flow +30.0/30.0
- ARV discount +15.0/15.0
- DSCR +10.0/10.0
- 1% rule +8.3/10.0
- Schools +3.9/10.0
- Livability +3.7/5.0
- Rent growth +3.3/5.0
- Condition / age +2.5/5.0
- Appreciation +0.0/10.0
$189,999
🖨 Deal sheet (PDF) 📄 Offer letter ✓ Due diligence
Multi-family units
County records classify this as Multi-Family (2-4 Unit). Listing-text estimate: 2 units. confirmed
Listing remarks MLS
GREAT MULTI-FAMILY INVESTMENT PROPERTY!! Fantastic duplex in Portsmouth priced to sell. Oversized lot with a spacious yard— good for future expansion or building an additional home! Property SOLD AS-IS/WHERE IS!! Call today for a private showing!!
Key facts
- Spacious yard
- Future expansion
- Oversized lot
Tags
Neighborhood map
What this means for you Summary
Snapshot
- This is a 2 × 2-bed/1.0-bath units multifamily listed at $190k.
Deal economics
- At list price, monthly cash flow is $738 ($9k/yr) — positive. Per door: $369/mo.
- The deal already cash-flows at list — no discount required.
- Meets the 1% rule at list price ($3k rent vs $190k).
- Recommended offer: $179k (6.0% below list) — sets the bar for market timing.
- Cap rate 11.0% vs local median 4.6% in Portsmouth — top-decile yield for the area; either an underpriced asset or a hidden risk that comps aren't pricing in. Stress-test before assuming the spread holds.
Location & tenants
- Location reads 73/100 on livability (#172 in VA) — a middle-class / working-renter tenant base. Strengths: amenities A+, cost of living A+, housing A+; Watch: employment C-, crime F, commute F.
- Portsmouth City Public School District (urban): math 34% / reading 58% proficiency, ranked #107 of 131 in VA (top 82%) — families likely to look elsewhere, expect single-tenant / working-renter base with shorter leases.
- Zoned schools: Brighton Elementary (math 12% / reading 32%, grade F, #1,069 of 1,108 statewide, top 97%, 411 students, 97% FRL); Cradock Middle (math 32% / reading 62%, grade D+, #257 of 342 statewide, top 77%, 533 students, 100% FRL); Manor High (math 48% / reading 75%, grade B-, #240 of 319 statewide, top 75%, 1,236 students, 99% FRL) — zoned schools average 99% FRL vs 60% district-wide (39 pts higher); higher-poverty schools than district average — tighter screening recommended.
- Market conditions: Rents rising (+3.3%/yr); 135 active listings in the ZIP; 30 comparable units currently listed for rent nearby; rentals at typical pace (median 26d on market — plan ~3-4 weeks tenant-placement turnaround); 300 units permitted in Portsmouth city in 2024 (112 in 5+ unit buildings).
- At $2,525/mo this rent would consume 61% of the median local household income ($50k/yr) (locally 1727% of renters already pay >50% of income on rent) — very limited rent-growth headroom before tenants either downsize or default.
Forward outlook
- Local home prices are declining (-3.0%/yr); year-one equity from $1k of loan paydown is wiped out by about $6k of value loss. Plan a longer hold.
- At projected returns (-3.0% appreciation + 3.3% rent growth), your $53k cash investment doubles in ~8 years — after that, you're playing with house money.
Negotiation context
- It's been on market 73 days — a 6% lower offer ($179k) is reasonable based on typical stale-listing flexibility.
- 9 sale attempts since 7y ago; this cycle's ask has dropped $10k (5%) from the opening price — seller is motivated, your offer sets the floor, not the list.
Risks & watch-outs
- Watch-outs: built in 1920 — expect roof / HVAC / electrical / plumbing capex.
- Climate carrying-cost: moderate flood risk; severe wind risk, 80% chance of damaging wind over 30y; extreme-heat days projected 7→16/yr by 2055 (HVAC capex compounding) — expect insurance premiums to compound above CPI over the hold.
Questions for the listing agent
- It's been on market 73 days. Have you received any prior offers? Is the seller open to a 6% concession, seller financing, or rate buy-down credit?
- Can we see the unit-by-unit rent roll, current vacancy, and any below-market leases? What's the average tenancy length?
- What capital expenditures (roof, boiler, parking lot, exteriors) have been made in the last 5 years, and what's planned in the next 2?
- Built in 1920 — when were the roof, HVAC, electrical panel, plumbing, and water heater last replaced?
- Why hasn't it sold? Are there any deal-killer items the seller is aware of (foundation, flood, title, zoning, code violations)?
- Is there a deadline driving the sale (1031 exchange, divorce, estate, relocation)? That informs how much negotiation room exists.
- Schools are B-rated — typically a magnet for longer-tenancy family renters. What's the average tenant stay here, and is there a school-zone premium baked into asking?
- Crime grade is F in this area — have there been break-ins, vandalism, or insurance claims at this property in the last 3 years? What carrier currently insures it and at what premium?
- What's the average days-on-market for RENTAL listings here right now (not sales)? A rising rental-DOM trend means longer vacancies and softer asking-rent achievability than the comps imply.
- What's the recent tenant-quality profile in this submarket — average credit score on applications, eviction rate, late-payment / NSF rate, and stable-employment percentage? A property-management company in the area should have these aggregated.
- How much new apartment / multifamily construction is in the pipeline within 1–3 miles? Heavy new supply (>2% of stock underway) typically softens rents 12–24 months out; light construction supports rent growth.
Investment metrics
- 1% rule
- 1.33% ✓
- Cap rate
- 10.95%
- Cash-on-cash
- 16.64%
- DSCR
- 1.74
- GRM
- 6.3
CMA / ARV
- ARV (median comp)
- $235,700
- List price
- $189,999
- Delta
- -19.39%
- Verdict
- UNDERPRICED
- Comps
- 2 within 1.0 mi
Show comp detail 2 sales within ~0.75 mi
| Address | Dist | Beds/Ba | Sqft | Sold | Price | $/sf | Match |
|---|---|---|---|---|---|---|---|
| 2117 Staunton Ave | 0.55mi | 3/2.0 (-1) | 1,450 (+2%) | 1mo | $238,000 | $164 | 65 |
| 1233 Centre Ave | 0.41mi | 4/3.0 | 1,340 (-6%) | 6mo | $233,400 | $174 | 63 |
Match score weights: distance 35% · size 25% · config 20% · recency 20%. Top-matched comps best support the ARV.
Projected returns pro-forma
-3.0% appreciation · 3.31% rent growth · sell at horizon
- IRR
- 8.1%
- Equity multiple
- 1.32×
- Total profit
- $16,983
- Equity at exit
- $28,329
- IRR
- 17.6%
- Equity multiple
- 2.48×
- Total profit
- $78,557
- Equity at exit
- $16,428
Cash invested: $53,200 (down + closing). Projections, not guarantees.
Landlord ↔ Tenant lean methodology
- Overall (STATE)
- 55 Moderately Landlord-Leaning
- State Virginia
- 55 Moderately Landlord-Leaning · D+2
- County
- — inherits STATE
- City
- — inherits STATE
ZIP-level market 23704
- Home prices YoY
- -4.6%
- Rents YoY
- 3.3%
- Active inventory
- 135
- Price-to-rent
- 12.5×
Monthly cashflow live
- Estimated rent
- $2,525 high interval (Pro) →
- Mortgage (P&I)
- −$996
- Tax from tax record
- −$182 /mo · $2,179/yr
- Insurance
- −$79
- HOA
- −$0
- Vacancy / Maint / Mgmt
- −$530
- Net cashflow
- $738
Break-even live
Sensitivity live
| Price | -10% $845 | -5% $791 | +0% $738 | +5% $684 | +10% $630 |
|---|---|---|---|---|---|
| Rent | -10% $538 | -5% $638 | +0% $738 | +5% $837 | +10% $937 |
| Rate | -1.0pp $833 | -0.5pp $786 | base $738 | +0.5pp $688 | +1.0pp $638 |
2-unit breakdown (identical units grouped — click to expand)
| Units | Beds | Baths | Est. rent |
|---|---|---|---|
| 2× units | 2 | 1 | $2,524 |
| #1 | 2 | 1 | $1,262 |
| #2 | 2 | 1 | $1,262 |
| Total (2 units) | $2,525 | ||
UW: 25.0% down · 7.5% · 30yr · 1.5% tax · 5.0% vac · 8.0% maint · 8.0% mgmt
Financing live
Cash to close
- Down payment
- $47,500
- Closing costs
- $5,700
- Reserves months
- —
- Total cash needed
- —
Loan-product check · same deal, 3 products live
Conventional
25% down · 7.5% · 30yr
- Down + closing
- —
- Monthly P&I
- —
- Monthly cashflow
- —
- DSCR
- —
- Eligible?
- —
Personal DTI + credit; lowest rate.
DSCR
20% down · 8.5% · 30yr
- Down + closing
- —
- Monthly P&I
- —
- Monthly cashflow
- —
- DSCR
- —
- Eligible?
- —
No personal income docs; deal must DSCR.
Hard money
10% down · 12.0% · 12mo
- Down + closing
- —
- Monthly P&I
- —
- Monthly cashflow
- —
- DSCR
- —
- Eligible?
- —
Short-term bridge; refi at stabilization.
Rent comps 30 comps
| Address | Beds | Baths | Sqft | Rent | $/sqft | DOM | Units | Dist |
|---|---|---|---|---|---|---|---|---|
| 2007 Elm Ave Portsmouth, VA | 3.0 | 1.0 | 903 | $1,300 | $1.44 | 22d | 1 | 0.11mi |
| 2215 Atlanta Ave Portsmouth, VA | 4.0 | 1.0 | 1628 | $2,150 | $1.32 | 9d | 1 | 0.16mi |
| 2111 Atlanta Ave Portsmouth, VA | 3.0 | 2.0 | 1418 | $2,395 | $1.69 | 46d | 1 | 0.17mi |
| 1314 Summit Ave Portsmouth, VA | 3.0 | 1.5 | 1152 | $1,750 | $1.52 | 46d | 1 | 0.35mi |
| 1915 Lansing Ave Portsmouth, VA | 3.0 | 1.0 | 1085 | $1,675 | $1.54 | 5d | 1 | 0.38mi |
| 1440 Lasalle Ave Portsmouth, VA | 4.0 | 2.0 | 1493 | $2,500 | $1.67 | 25d | 1 | 0.41mi |
| 1915 Des Moines Ave Portsmouth, VA | 3.0 | 1.0 | 1070 | $1,700 | $1.59 | 25d | 1 | 0.43mi |
| 1915 Des Moines Ave Portsmouth, VA | 3.0 | 1.0 | 1070 | $1,700 | $1.59 | 18d | 1 | 0.43mi |
| 1508 Richmond Ave Portsmouth, VA | 4.0 | 2.0 | 1600 | $2,000 | $1.25 | 5d | 1 | 0.45mi |
| 1409 Wilcox Ave Portsmouth, VA | 3.0 | 2.5 | 1800 | $2,500 | $1.39 | 46d | 1 | 0.46mi |
| 2810 Roanoke Ave Portsmouth, VA | 3.0 | 1.5 | 1100 | $2,100 | $1.91 | 46d | 1 | 0.64mi |
| 2304 Nashville Ave Portsmouth, VA | 3.0 | 1.5 | 1226 | $1,395 | $1.14 | 46d | 1 | 0.74mi |
| 1321 Columbia St Unit 1533640P Portsmouth, VA | 3.0 | 2.5 | 1582 | $5,609 | $3.55 | 9d | 1 | 0.75mi |
| 1447 Talley Cir Portsmouth, VA | 3.0 | 2.5 | 1440 | $2,000 | $1.39 | 25d | 1 | 0.79mi |
| 20149 County St Portsmouth, VA | 3.0 | 2.5 | 1738 | $2,400 | $1.38 | 46d | 1 | 0.80mi |
| 622 Effingham St Portsmouth, VA | 2.0–3.0 | 1.5–2.0 | 1027 | $1,797 | $1.75 | 25d | 2 | 0.87mi |
| 1100 High St Portsmouth, VA | 2.0–3.0 | 1.5–2.0 | 1003 | $1,545 | $1.54 | 5d | 5 | 0.92mi |
| 1914 King St Portsmouth, VA | 3.0 | 2.5 | 1332 | $2,200 | $1.65 | 46d | 1 | 1.08mi |
| 414 London St Unit 3 Portsmouth, VA | 3.0 | 2.0 | 1600 | $1,595 | $1.00 | 25d | 1 | 1.15mi |
| 213 Beacon Rd Portsmouth, VA | 3.0 | 2.0 | 1280 | $2,300 | $1.80 | 25d | 1 | 1.22mi |
| 3317 Downes St Portsmouth, VA | 3.0 | 2.0 | 1148 | $1,995 | $1.74 | 12d | 1 | 1.25mi |
| 3317 Downes St Portsmouth, VA | 3.0 | 2.0 | 1148 | $1,995 | $1.74 | 5d | 1 | 1.25mi |
| 528 Hampton Pl Unit 3 Portsmouth, VA | 3.0 | 2.0 | 1650 | $2,000 | $1.21 | 19d | 1 | 1.26mi |
| 303 Effingham St Unit S-2F Portsmouth, VA | 3.0 | 2.0 | 1122 | $1,950 | $1.74 | 25d | 1 | 1.32mi |
| 303 Effingham St Portsmouth, VA | 1.0–3.0 | 1.0–2.0 | 863 | $1,950 | $2.26 | 18d | 11 | 1.32mi |
| 2211 North St Portsmouth, VA | 4.0 | 1.5 | 1500 | $2,100 | $1.40 | 18d | 1 | 1.40mi |
| 10 Parkside Pl Portsmouth, VA | 3.0 | 2.0 | 1800 | $2,095 | $1.16 | 19d | 1 | 1.41mi |
| 129 Elm Ave Portsmouth, VA | 3.0 | 1.5 | 1160 | $2,600 | $2.24 | 46d | 1 | 1.41mi |
| 148 Owens St Portsmouth, VA | 3.0 | 2.0 | 1500 | $2,350 | $1.57 | 25d | 1 | 1.45mi |
| 1611 McDaniel St Unit A Portsmouth, VA | 3.0 | 2.0 | 1500 | $1,950 | $1.30 | 9d | 1 | 1.48mi |
Listing history 34 events
-
2026-06-21days on market $189,999 Active 73 DOM
-
2026-06-18days on market $189,999 Active 70 DOM
-
2026-06-17days on market $189,999 Active 69 DOM
-
2026-06-16days on market $189,999 Active 68 DOM
-
2026-06-15days on market $189,999 Active 67 DOM
-
2026-06-13days on market $189,999 Active 65 DOM
-
2026-06-09days on market $189,999 Active 61 DOM
-
2026-06-08days on market $189,999 Active 60 DOM
-
2026-06-07days on market $189,999 Active 59 DOM
-
2026-06-03days on market $189,999 Active 55 DOM
-
2026-06-02days on market $189,999 Active 54 DOM
-
2026-06-01days on market $189,999 Active 53 DOM
-
2026-05-31days on market $189,999 Active 52 DOM
-
2026-04-28price $189,999 255-char remark
Show marketing remark (255 chars)
GREAT MULTI-FAMILY INVESTMENT PROPERTY!! Fantastic duplex in Portsmouth priced to sell. Oversized lot with a spacious yard— good for future expansion or building an additional home! Property SOLD AS-IS/WHERE IS!! Call today for a private showing!!
-
2026-04-09$200,000 Active 255-char remark
Show marketing remark (255 chars)
GREAT MULTI-FAMILY INVESTMENT PROPERTY!! Fantastic duplex in Portsmouth priced to sell. Oversized lot with a spacious yard— good for future expansion or building an additional home! Property SOLD AS-IS/WHERE IS!! Call today for a private showing!!
-
2025-09-21historical
-
2025-03-22$250,000 Active
-
2025-03-06historical
-
2024-09-23status Active
-
2024-09-19historical
-
2024-09-13$250,000 Active
-
2020-12-11historical
-
2020-11-10$89,000 Active
-
2020-04-11status Under Contract
-
2020-03-18historical Active Under Contract
-
2020-02-23status Active
-
2019-11-20status Under Contract
-
2019-10-30status Active
-
2019-10-02status Under Contract
-
2019-09-03status Active
-
2019-09-03historical Active Under Contract
-
2019-08-25status Under Contract
-
2019-08-12historical Active Under Contract
-
2019-07-31$45,000 Active
ⓘ Source: listings_history table (triggers on properties + properties_extension) + one-shot
backfill from property_details.listing_events for pre-trigger history.
Tax reassessment forecast VA · Resets to sale price
- Current annual tax
- $2,179 · $182/mo
- Projected year-2 tax
- $2,179 · $182/mo
- Expected delta
- $0/yr ($0/mo · 0.0%)
ⓘ Screening estimate from a state-policy table — verify with the county assessor before closing.
Climate risk First Street
- Flood 5/10 Major FEMA zone X (shaded) · 52% chance over 30 yrs
- Wildfire 1/10 Low
- Heat 9/10 Extreme 7 d/yr ≥106°F today · 16 d/yr by 30 yrs out
- Wind 8/10 Severe 80% chance of damaging wind over 30 yrs
- Air quality 5/10 Major 6 unhealthy d/yr today · 7 by 30 yrs out
Nearby sold comps map
Loading sold comps map…
Walkable amenities ~0.75 mi
Loading nearby amenities…
Taxation est. · year 1
- Rental income
- $30,300
- − Mortgage interest
- −$10,643
- − Property taxes
- −$2,179
- − Insurance
- −$950
- − Repairs & maintenance
- −$2,424
- − Management
- −$2,424
- − Depreciation
- −$5,527
- Taxable income
- $6,152
- Est. tax owed @ 24.0%
- −$1,477
- After-tax cash flow
- $7,374/yr
For passive investors: Depreciation is non-cash, so a rental often shows a tax loss while cash-flowing — sheltering income. Rental losses are passive: they offset passive income freely, and up to $25,000/yr can offset ordinary (W-2) income if you actively participate and your MAGI is under $100k (phasing out to $0 by $150k); unused losses carry forward. On sale, claimed depreciation is recaptured at up to 25%, and gains may owe capital-gains tax (a 1031 exchange can defer both). Figures are a year-1 estimate at your 24.0% rate — not tax advice; consult a CPA.
Schools (NCES district)
- District
- Portsmouth City Public School District
- NCES district ID
- 5103000
- Math proficiency
- 34% ▼ -40.00%
- Reading proficiency
- 58% ▼ -12.00%
- Median HH income
- $46,152
- Composite
- 39.01/100
- National rank
- #4071
- State rank
- #107 of 131 in VA
Livability — Portsmouth
- Score
- 73/100
- State rank
- #172
- US rank
- #5381
Category grades
Schools grade is shown separately in the Schools card above.
Census & demographics
- Census place
- Portsmouth, VA
- County
- Portsmouth City · 96,366 people
- City population
- 96,366
- Metro
- Virginia Beach-Norfolk-Newport News, VA-NC
- Population (ZIP)
- 19,207
- Household income
- $49,583
- Rent vs Own
- Severe rent burden
- 1727.0
Population outlook (Portsmouth County) Hauer SSP2
- Today (2025)
- 96,730 people
- By 2030
- 96,760 · +0.0%
- By 2040
- 96,573 · -0.2%
- By 2050
- 95,606 · -1.2%
- By 2075
- 93,579 · -3.3%
- By 2100
- 83,756 · -13.4%
Race, ethnicity, and origin ACS 2023
- Neighborhood character
- Predominantly Black (66%)
- Race & ethnicity
- Black 66% White 24% Two or more races 6% Hispanic / Latino 4% Asian 2%
- Common ancestry
- Slovak 1% Romanian 1% Lithuanian 1%
- Foreign-born
- 2% · Canada
- Languages at home
- 96% English-only · Spanish 2%
Political lean MEDSL · Portsmouth
- 2024 margin
- Solid D (+38.6) · D 68.6% · R 30.0% · Other 1.4%
- 2008→2024 swing
- -0.7pp no change · 2008: 39.3pp · 2024: 38.6pp
- All cycles
- 2024: D+38.6 2020: D+40.8 2016: D+36.5 2012: D+39.6 2008: D+39.3
Not yet ingested
- Civics
- —
Market trends
- HPI YoY
- ▼ -15.69%
- Current HPI
- 322.7335
- Rent YoY
- ▲ 3.31%
- Metro
- Virginia Beach-Norfolk-Newport News, VA-NC
- State GDP YoY
- ▲ 2.40%
- F500 in state
- 50
Industry mix (Fortune 500 HQ in VA)
| Industry | F500 HQs | Revenue |
|---|---|---|
| Aerospace / Defense | 4 | $236B |
|
||
| Technology / Defense | 3 | $32B |
|
||
| Financial Services | 2 | $176B |
|
||
| Utilities | 2 | $27B |
|
||
| Insurance | 2 | $25B |
|
||
| Technology | 2 | $15B |
|
||
Price history
+322.2% since first listed21 events — show timeline
- 2026-04-28 Price Changed $189,999 REINMLS
- 2026-04-09 Listed $200,000 REINMLS
- 2025-09-21 Listing Removed — REINMLS
- 2025-03-22 Listed $250,000 REINMLS
- 2025-03-06 Listing Removed — REINMLS
- 2024-09-23 Relisted — REINMLS
- 2024-09-19 Listing Removed — REINMLS
- 2024-09-13 Listed $250,000 REINMLS
- 2020-12-11 Listing Removed — REINMLS
- 2020-11-10 Listed $89,000 REINMLS
- 2020-04-11 Pending — REINMLS
- 2020-03-18 Contingent — REINMLS
- 2020-02-23 Relisted — REINMLS
- 2019-11-20 Pending — REINMLS
- 2019-10-30 Relisted — REINMLS
- 2019-10-02 Pending — REINMLS
- 2019-09-03 Relisted — REINMLS
- 2019-09-03 Contingent — REINMLS
- 2019-08-25 Pending — REINMLS
- 2019-08-12 Contingent — REINMLS
- 2019-07-31 Listed $45,000 REINMLS
Property tax history
+3.8%/yrLatest (2025): $2,179 · +2.2% YoY. Source: county tax records.
Cash-flow waterfall
monthlySold comps — $/sqft
last 12 mo · ≤1 miLoading sold comps…