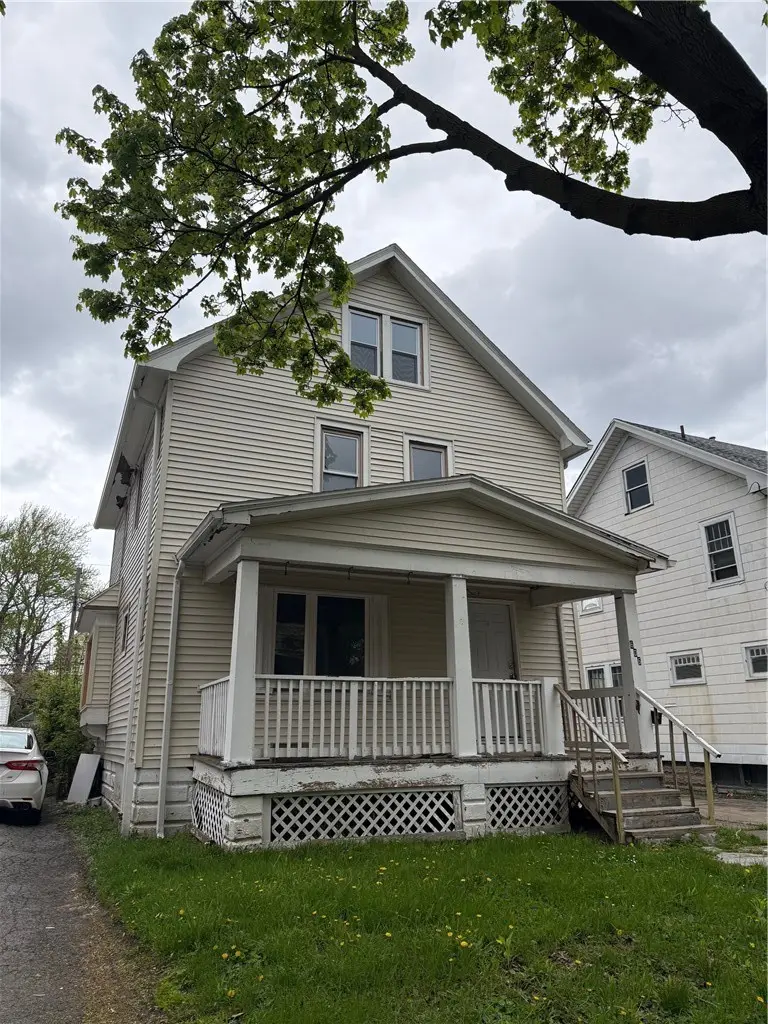
606 Wilkins St · Rochester, NY
Flood risk 1/10 · Minimal
- FEMA flood zone
- X (unshaded)
- Chance of flooding over 30 yrs
- 0.0%
- Est. flood insurance / yr
- $473 – $860
Fire risk 1/10 · Minimal
- Est. fire insurance / yr
- $691 – $1,283
Heat risk 2/10 · Minimal
- Hot days now (above 95°F)
- 7 days/yr
- Hot days in 30 yrs
- 15 days/yr
Wind risk 1/10 · Minimal
- Chance of severe wind over 30 yrs
- —
Air-quality risk 2/10 · Minimal
- Unhealthy air days now
- 1 days/yr
- Unhealthy air days in 30 yrs
- 2 days/yr
Risk factors via First Street. Map © Google.
Why this score? — see what drove the B+ grade
The composite is a weighted blend of 9 inputs, each scored 0–100. Each bar is that input's sub-score; the figure is the points it added to the 100-point composite (weight × sub-score).
- Cash flow +30.0/30.0
- ARV discount +15.0/15.0
- 1% rule +10.0/10.0
- DSCR +10.0/10.0
- Rent growth +4.7/5.0
- Livability +3.8/5.0
- Condition / age +2.5/5.0
- Schools +1.9/10.0
- Appreciation +0.0/10.0
$99,900
🖨 Deal sheet 📄 Offer letter ✓ Due diligence
Listing remarks
With over 1300 square feet, this handyman special with most of the major work done is brimming with potential! 3 bedrooms, 1 full bathroom, half bathroom already roughed in, and a new roof, siding, bathroom, and gutters. Easy access to major amenities. Most drywall work has been completed too. Finish out the rest and walk into instant equity! This would make a great investment or owner occupied property!
Key facts
- New siding
- New bathroom
- New gutters
Tags
Property features AI
Exterior
- Parking: Detached garage; 1 garage space
- Utilities: Public water connected; Sewer connected
- Home design: Two-story existing residence; Resale property
- Construction: Vinyl siding; Block foundation
- Exterior features: Blacktop driveway; Rectangular residential lot (approx. 39 x 83)
Interior
- Kitchen: Gas water heater (listed under appliances)
- Bedrooms: Total of 7 rooms including living areas (bedroom count not specified)
- Flooring: Hardwood flooring; Varies by room
- Bathrooms: 1 full bathroom; 1 half bathroom; One main-level bathroom
- Heating & cooling: Gas forced-air heating
- Interior features: Separate/formal living room; Additional interior features noted in remarks
- Laundry & utility: Basement available (full basement)
Neighborhood map
What this means for you Summary
Snapshot
- This is a 3-bed/1.0-bath single-family listed at $100k.
Deal economics
- At list price, monthly cash flow is $607 ($7k/yr) — positive.
- The deal already cash-flows at list — no discount required.
- Meets the 1% rule at list price ($2k rent vs $100k).
- Recommended offer: $97k (3.0% below list) — sets the bar for market timing.
- Cap rate 13.6% vs local median 9.3% in Rochester — top-decile yield for the area; either an underpriced asset or a hidden risk that comps aren't pricing in. Stress-test before assuming the spread holds.
Location & tenants
- Location reads 76/100 on livability (#222 in NY, #3,482 nationally) — a middle-class / working-renter tenant base. Strengths: commute A+, cost of living A+, housing A+; Watch: schools D+, crime F, employment F.
- Rochester City School District (urban): math 21% / reading 26% proficiency, ranked #589 of 590 in NY (top 100%) — low school quality limits family demand, transient renter base, plan for 1-2y turnover; 82% free/reduced lunch — lower-income household profile, screen leases tightly.
- Market conditions: Rents rising fast (+8.9%/yr); 114 active listings in the ZIP; 28 comparable units currently listed for rent nearby; rentals at typical pace (median 15d on market — plan ~3-4 weeks tenant-placement turnaround); lower-income renter base — watch delinquency; 1,169 units permitted in Monroe County in 2024 (591 in 5+ unit buildings).
- At $1,550/mo this rent would consume 53% of the median local household income ($35k/yr) (locally 2756% of renters already pay >50% of income on rent) — very limited rent-growth headroom before tenants either downsize or default.
Forward outlook
- Local home prices are declining (-3.0%/yr); year-one equity from $691 of loan paydown is wiped out by about $3k of value loss. Plan a longer hold.
- Monroe County population projected to shrink 6% by 2050 — rents likely to lag national; underwrite the cash flow, not the appreciation.
- At projected returns (-3.0% appreciation + 8.0% rent growth), your $28k cash investment doubles in ~4 years — after that, you're playing with house money.
Negotiation context
- It's been on market 47 days — a 3% lower offer ($97k) is reasonable based on typical stale-listing flexibility.
- 3 sale attempts since 15y ago with the ask held roughly flat each time — persistent listings suggest the price (not the market) is what's stuck; bring a comps-based counter.
- Current owner paid $22k; list at $100k implies a 354% gain — meaningful room to come down on a strong offer.
Risks & watch-outs
- Watch-outs: built in 1930 — expect roof / HVAC / electrical / plumbing capex.
Questions for the listing agent
- It's been on market 47 days. Have you received any prior offers? Is the seller open to a 3% concession, seller financing, or rate buy-down credit?
- Built in 1930 — when were the roof, HVAC, electrical panel, plumbing, and water heater last replaced?
- Is there a deadline driving the sale (1031 exchange, divorce, estate, relocation)? That informs how much negotiation room exists.
- Schools are D-rated, which usually means shorter tenancies and higher turnover. Who's the typical renter profile here, and what's been the actual vacancy rate?
- Crime grade is F in this area — have there been break-ins, vandalism, or insurance claims at this property in the last 3 years? What carrier currently insures it and at what premium?
- What's the average days-on-market for RENTAL listings here right now (not sales)? A rising rental-DOM trend means longer vacancies and softer asking-rent achievability than the comps imply.
- What's the recent tenant-quality profile in this submarket — average credit score on applications, eviction rate, late-payment / NSF rate, and stable-employment percentage? A property-management company in the area should have these aggregated.
- How much new for-sale + rental construction is in the pipeline within 1–3 miles? Heavy new supply typically softens prices + rents 12–24 months out; constrained supply supports both.
Investment metrics
- 1% rule
- 1.55% ✓
- Cap rate
- 13.59%
- Cash-on-cash
- 26.06%
- DSCR
- 2.16
- GRM
- 5.4
CMA / ARV
- ARV (median comp)
- $125,595
- List price
- $99,900
- Delta
- -20.46%
- Verdict
- UNDERPRICED
- Comps
- 20 within 1.0 mi
Show comp detail 12 sales within ~0.75 mi
| Address | Dist | Beds/Ba | Sqft | Sold | Price | $/sf | Match |
|---|---|---|---|---|---|---|---|
| 207 Herald St | 0.03mi | 3/2.0 | 1,288 (-2%) | 1mo | $60,000 | $47 | 90 |
| 1295 North Street St | 0.29mi | 3/1.5 | 1,347 (+2%) | 2mo | $70,000 | $52 | 79 |
| 1271 North St | 0.25mi | 4/1.5 (+1) | 1,276 (-3%) | 2mo | $128,900 | $101 | 75 |
| 235 Ernst St | 0.25mi | 3/1.5 | 1,164 (-12%) | 2mo | $170,000 | $146 | 65 |
| 623 Avenue D | 0.66mi | 3/1.0 | 1,254 (-5%) | 2mo | $70,000 | $56 | 59 |
| 116 Barberry | 0.38mi | 4/2.0 (+1) | 1,220 (-7%) | 2mo | $175,000 | $143 | 59 |
| 73 Kosciusko St | 0.45mi | 3/1.0 | 1,470 (+12%) | 2mo | $55,000 | $37 | 58 |
| 227 Newcomb St | 0.72mi | 3/2.0 | 1,372 (+4%) | 1mo | $225,000 | $164 | 55 |
| 56 Northlane Dr | 0.63mi | 2/1.5 (-1) | 1,232 (-6%) | 2mo | $90,142 | $73 | 51 |
| 82 Kosciusko St | 0.47mi | 4/1.0 (+1) | 1,137 (-14%) | 3mo | $174,000 | $153 | 48 |
| 749 Avenue D | 0.49mi | 4/1.5 (+1) | 1,508 (+14%) | 1mo | $80,000 | $53 | 46 |
| 34 Zygment St | 0.75mi | 3/1.0 | 1,137 (-14%) | 2mo | $182,000 | $160 | 41 |
Match score weights: distance 35% · size 25% · config 20% · recency 20%. Top-matched comps best support the ARV.
Projected returns pro-forma
-3.0% appreciation · 8.0% rent growth · sell at horizon
- IRR
- 25.0%
- Equity multiple
- 2.10×
- Total profit
- $30,669
- Equity at exit
- $14,895
- IRR
- 35.6%
- Equity multiple
- 5.07×
- Total profit
- $113,716
- Equity at exit
- $8,638
Cash invested: $27,972 (down + closing). Projections, not guarantees.
Landlord ↔ Tenant lean methodology
- Overall (STATE)
- 15 Strongly Tenant-Friendly
- State New York
- 15 Strongly Tenant-Friendly · D+10
- County
- — inherits STATE
- City
- — inherits STATE
ZIP-level market 14621
- Home prices YoY
- -4.0%
- Rents YoY
- 8.9%
- Active inventory
- 114
- Price-to-rent
- 5.4×
Monthly cashflow live
- Estimated rent
- $1,550 high interval (Pro) →
- Mortgage (P&I)
- −$524
- Tax from tax record
- −$52 /mo · $619/yr
- Insurance
- −$42
- HOA
- −$0
- Vacancy / Maint / Mgmt
- −$325
- Net cashflow
- $607
Break-even live
UW: 25.0% down · 7.5% · 30yr · 1.5% tax · 5.0% vac · 8.0% maint · 8.0% mgmt
Financing live
Cash to close
- Down payment
- $24,975
- Closing costs
- $2,997
- Reserves months
- —
- Total cash needed
- —
Loan-product check · same deal, 3 products live
Conventional
25% down · 7.5% · 30yr
- Down + closing
- —
- Monthly P&I
- —
- Monthly cashflow
- —
- DSCR
- —
- Eligible?
- —
Personal DTI + credit; lowest rate.
DSCR
20% down · 8.5% · 30yr
- Down + closing
- —
- Monthly P&I
- —
- Monthly cashflow
- —
- DSCR
- —
- Eligible?
- —
No personal income docs; deal must DSCR.
Hard money
10% down · 12.0% · 12mo
- Down + closing
- —
- Monthly P&I
- —
- Monthly cashflow
- —
- DSCR
- —
- Eligible?
- —
Short-term bridge; refi at stabilization.
Rent comps 28 comps
| Address | Beds | Baths | Sqft | Rent | $/sqft | DOM | Units | Dist |
|---|---|---|---|---|---|---|---|---|
| 127 Carter St #125 Rochester, NY | 2.0 | 1.0 | 1320 | $1,400 | $1.06 | 44d | 1 | 0.13mi |
| 176 Roycroft Dr Rochester, NY | 3.0 | 1.0 | 1169 | $950 | $0.81 | 10d | 1 | 0.19mi |
| 25 Trust St Rochester, NY | 3.0 | 1.5 | 1003 | $1,600 | $1.60 | 3d | 1 | 0.29mi |
| 811 Portland Ave Rochester, NY | 2.0 | 1.0 | 1616 | $1,300 | $0.80 | 14d | 1 | 0.34mi |
| 100 Fairbanks St Rochester, NY | 2.0 | 1.0 | 1456 | $1,100 | $0.76 | 44d | 1 | 0.40mi |
| 171 Mohawk St Rochester, NY | 3.0 | 2.0 | 1054 | $1,775 | $1.68 | 44d | 1 | 0.45mi |
| 239 Weyl St Rochester, NY | 3.0 | 1.0 | 1208 | $1,600 | $1.32 | 19d | 1 | 0.47mi |
| 207 Lux St Rochester, NY | 4.0 | 1.5 | 1728 | $2,150 | $1.24 | 10d | 1 | 0.47mi |
| 47 Priscilla St Rochester, NY | 4.0 | 1.5 | 1250 | $1,900 | $1.52 | 21d | 1 | 0.71mi |
| — Rochester, NY | 2.0 | 1.0 | 896 | $1,100 | $1.23 | 14d | 1 | 0.74mi |
| 117 Northaven Ter Rochester, NY | 4.0 | 2.0 | 1460 | $1,975 | $1.35 | 10d | 1 | 0.79mi |
| 147 5th St Rochester, NY | 4.0 | 1.0 | 1289 | $1,950 | $1.51 | 21d | 1 | 0.83mi |
| 52 Frances St Rochester, NY | 4.0 | 1.0 | 1256 | $1,595 | $1.27 | 44d | 1 | 0.86mi |
| 32 Portland Pkwy Rochester, NY | 2.0 | 1.0 | 652 | $1,485 | $2.28 | 3d | 8 | 1.02mi |
| 86-88 Baycliff Dr Unit 86 Rochester, NY | 2.0 | 1.0 | 900 | $1,030 | $1.14 | 21d | 1 | 1.04mi |
| 326 Northland Ave Rochester, NY | 3.0 | 1.0 | 1168 | $1,500 | $1.28 | 3d | 1 | 1.07mi |
| 95 Onondaga Rd Rochester, NY | 1.0–2.0 | 1.0 | 825 | $1,630 | $1.98 | 3d | 1 | 1.11mi |
| 222 Ellison St Rochester, NY | 2.0 | 1.0 | 971 | $1,000 | $1.03 | 14d | 1 | 1.14mi |
| 1890 Clifford Ave Rochester, NY | 3.0 | 1.0 | 936 | $1,800 | $1.92 | 23d | 1 | 1.17mi |
| 59 Clark Ave Rochester, NY | 4.0 | 1.0 | 1728 | $1,800 | $1.04 | 3d | 1 | 1.19mi |
| 493 Hollenbeck St Rochester, NY | 2.0 | 1.5 | 936 | $1,275 | $1.36 | 14d | 1 | 1.29mi |
| 126 Parsells Ave Rochester, NY | 3.0 | 1.0 | 1574 | $1,800 | $1.14 | 44d | 1 | 1.29mi |
| 126 Parsells Ave Rochester, NY | 3.0 | 1.0 | 1574 | $1,800 | $1.14 | 21d | 1 | 1.29mi |
| 152 Gibbs St Rochester, NY | 1.0–2.0 | 1.0 | 950 | $1,875 | $1.97 | 14d | 3 | 1.36mi |
| 195 Parsells Ave Rochester, NY | 4.0 | 1.0 | 1413 | $1,265 | $0.90 | 3d | 1 | 1.39mi |
| 128 Gibbs St Unit 136 Rochester, NY | 2.0 | 1.0 | 900 | $1,795 | $1.99 | 10d | 1 | 1.40mi |
| 128 Gibbs St Unit 130 Rochester, NY | 2.0 | 1.0 | 1000 | $1,875 | $1.88 | 10d | 1 | 1.40mi |
| 395 Alexander St Unit UN12 Rochester, NY | 2.0 | 1.5 | 1226 | $2,200 | $1.79 | 14d | 1 | 1.41mi |
Listing history 19 events
-
2026-06-18days on market $99,900 Active 47 DOM
-
2026-06-17days on market $99,900 Active 46 DOM
-
2026-06-16days on market $99,900 Active 45 DOM
-
2026-06-15days on market $99,900 Active 44 DOM
-
2026-06-13days on market $99,900 Active 42 DOM
-
2026-06-13days on market $99,900 Active 41 DOM
-
2026-06-10days on market $99,900 Active 39 DOM
-
2026-06-09days on market $99,900 Active 38 DOM
-
2026-06-09days on market $99,900 Active 37 DOM
-
2026-06-07days on market $99,900 Active 36 DOM
-
2026-06-05days on market $99,900 Active 33 DOM
-
2026-06-03days on market $99,900 Active 32 DOM
-
2026-06-03days on market $99,900 Active 31 DOM
-
2026-06-01days on market $99,900 Active 30 DOM
-
2026-05-31days on market $99,900 Active 29 DOM
-
2026-05-02$99,900 Active 407-char remark
-
2013-08-05$19,900
-
2011-07-19$24,900
-
1998-09-23soldstatus $22,000
ⓘ Source: listings_history table (triggers on properties + properties_extension) + one-shot
backfill from property_details.listing_events for pre-trigger history.
Tax reassessment forecast NY · Partial reset (capped growth)
- Current annual tax
- $619 · $52/mo
- Projected year-2 tax
- $1,154 · $96/mo
- Expected delta
- +$535/yr (+$45/mo · 86.4%)
ⓘ Screening estimate from a state-policy table — verify with the county assessor before closing.
Climate risk First Street
- Flood 1/10 Low FEMA zone X (unshaded) · 0% chance over 30 yrs
- Wildfire 1/10 Low
- Heat 2/10 Low 7 d/yr ≥95°F today · 15 d/yr by 30 yrs out
- Wind 1/10 Low
- Air quality 2/10 Low 1 unhealthy d/yr today · 2 by 30 yrs out
Nearby sold comps map
Loading sold comps map…
Walkable amenities ~0.75 mi
Loading nearby amenities…
Taxation est. · year 1
- Rental income
- $18,600
- − Mortgage interest
- −$5,596
- − Property taxes
- −$619
- − Insurance
- −$500
- − Repairs & maintenance
- −$1,488
- − Management
- −$1,488
- − Depreciation
- −$2,906
- Taxable income
- $6,004
- Est. tax owed @ 24.0%
- −$1,441
- After-tax cash flow
- $5,848/yr
For passive investors: Depreciation is non-cash, so a rental often shows a tax loss while cash-flowing — sheltering income. Rental losses are passive: they offset passive income freely, and up to $25,000/yr can offset ordinary (W-2) income if you actively participate and your MAGI is under $100k (phasing out to $0 by $150k); unused losses carry forward. On sale, claimed depreciation is recaptured at up to 25%, and gains may owe capital-gains tax (a 1031 exchange can defer both). Figures are a year-1 estimate at your 24.0% rate — not tax advice; consult a CPA.
Schools (NCES district)
- District
- Rochester City School District
- NCES district ID
- 3624750
- Math proficiency
- 21% ▬ 0.00%
- Reading proficiency
- 26% ▲ 4.00%
- Median HH income
- $30,923
- Composite
- 18.98/100
- National rank
- #8850
- State rank
- #589 of 590 in NY
Livability — Rochester
- Score
- 76/100
- State rank
- #222
- US rank
- #3482
Category grades
Schools grade is shown separately in the Schools card above.
Census & demographics
- Census place
- Rochester, NY
- County
- Monroe County · 674,131 people
- City population
- 432,803
- Metro
- Rochester, NY
- Population (ZIP)
- 32,381
- Household income
- $35,383
- Rent vs Own
- Severe rent burden
- 2756.0
Population outlook (Monroe County) Hauer SSP2
- Today (2025)
- 759,460 people
- By 2030
- 757,154 · -0.3%
- By 2040
- 740,644 · -2.5%
- By 2050
- 714,443 · -5.9%
- By 2075
- 645,883 · -15.0%
- By 2100
- 547,084 · -28.0%
Race, ethnicity, and origin ACS 2023
- Neighborhood character
- Diverse neighborhood (Simpson 0.66)
- Race & ethnicity
- Hispanic / Latino 40% Black 40% White 14% Two or more races 12% Asian 1%
- Hispanic origin (detail)
- Mexican 1% Puerto Rican 32% Dominican 3%
- Common ancestry
- Romanian 1% Lithuanian 1% Serbian 1%
- Foreign-born
- 8% · Canada, Jamaica
- Languages at home
- 65% English-only · Spanish 30% Other Asian/Pacific 2% French/Haitian/Cajun 1%
Political lean MEDSL · Monroe
- 2024 margin
- D (+19.1) · D 59.5% · R 40.5%
- 2008→2024 swing
- +1.4pp toward D · 2008: 17.7pp · 2024: 19.1pp
- All cycles
- 2024: D+19.1 2020: D+21.0 2016: D+14.1 2012: D+17.4 2008: D+17.7
Not yet ingested
- Civics
- —
Market trends
- HPI YoY
- ▼ -10.66%
- Current HPI
- 254.1805
- Rent YoY
- ▲ 8.88%
- Metro
- Rochester, NY
- State GDP YoY
- ▲ 2.60%
- F500 in state
- 92
Industry mix (Fortune 500 HQ in NY)
| Industry | F500 HQs | Revenue |
|---|---|---|
| Financial Services | 10 | $950B |
|
||
| Consumer Goods | 9 | $162B |
|
||
| Insurance | 4 | $225B |
|
||
| Telecommunications | 2 | $144B |
|
||
| Pharmaceuticals | 2 | $112B |
|
||
| Media / Entertainment | 2 | $69B |
|
||
Price history
+354.1% since first listed4 events — show timeline
- 2026-05-02 Listed $99,900 UNYREIS
- 2013-08-05 Listed $19,900 UNYREIS
- 2011-07-19 Listed $24,900 UNYREIS
- 1998-09-23 Sold (Public Records) $22,000 Public Records
Property tax history
-1.5%/yrLatest (2025): $619 · -50.6% YoY. Source: county tax records.
Cash-flow waterfall
monthlySold comps — $/sqft
last 12 mo · ≤1 miLoading sold comps…