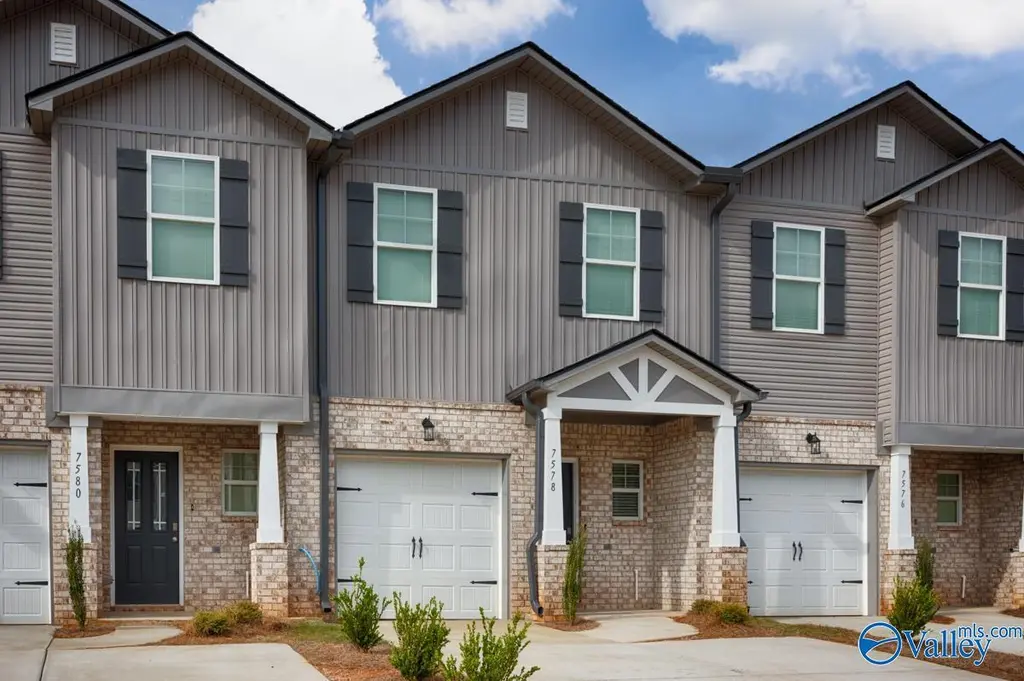
7578 Discovery Point Dr · Huntsville, AL
Flood risk No data
- FEMA flood zone
- —
- Chance of flooding over 30 yrs
- —
- Est. flood insurance / yr
- —
Fire risk No data
- Est. fire insurance / yr
- —
Heat risk No data
- Hot days now (above threshold)
- —
- Hot days in 30 yrs
- —
Wind risk No data
- Chance of severe wind over 30 yrs
- —
Air-quality risk No data
- Unhealthy air days now
- —
- Unhealthy air days in 30 yrs
- —
Risk factors via First Street. Map © Google.
Why this score? — see what drove the D grade
The composite is a weighted blend of 9 inputs, each scored 0–100. Each bar is that input's sub-score; the figure is the points it added to the 100-point composite (weight × sub-score).
- Appreciation +10.0/10.0
- ARV discount +9.0/15.0
- Cash flow +7.7/30.0
- Livability +4.1/5.0
- Rent growth +3.1/5.0
- Schools +2.9/10.0
- 1% rule +2.7/10.0
- Condition / age +2.5/5.0
- DSCR +1.8/10.0
$229,900
🖨 Deal sheet (PDF) 📄 Offer letter ✓ Due diligence
Listing remarks MLS
TRANSFERABLE 2-10 WARRANTY REMAINING! Modern 3BR/2.5BA townhome in the heart of Huntsville! This stylish home features an open-concept layout, gourmet kitchen with beautiful countertops, stainless steel appliances, and a spacious living area perfect for entertaining. The primary suite offers a walk-in closet and private bath. Home will also come with a new refrigerator and blinds. Enjoy low-maintenance living with a private patio and attached garage. Convenient to Redstone Arsenal, Research Park, and the Midtown development with dining and shopping. All information to be verified by purchaser.
Key facts
- Attached garage
- Gourmet kitchen
- Private patio
Tags
Neighborhood map
What this means for you Summary
Snapshot
- This is a 3-bed/2.5-bath townhouse listed at $230k.
Deal economics
- At list price, monthly cash flow is $-269 ($-3k/yr) — negative.
- To cash-flow at today's rent, offer at most $191k (16.9% below list).
- To meet the 1% rule (rent ≥ 1% of price), the offer needs to be $177k (23.2% below list).
- Recommended offer: $177k (23.2% below list) — sets the bar for 1% rule.
- Cap rate 4.9% vs local median 3.8% in Huntsville — meaningfully above typical; check what's discounted (condition, days-on-market, listing class) to confirm the premium yield is real.
Location & tenants
- Location reads 82/100 on livability (#3 in AL, #1,082 nationally) — a professional / high-income tenant draw. Strengths: commute A+, cost of living A+, housing A+; Watch: crime F.
- Huntsville City (urban): math 21% / reading 46% proficiency, ranked #48 of 129 in AL (top 37%) — families likely to look elsewhere, expect single-tenant / working-renter base with shorter leases.
- Market conditions: Rents rising (+2.6%/yr); 216 active listings in the ZIP; 14 comparable units currently listed for rent nearby; rentals at typical pace (median 26d on market — plan ~3-4 weeks tenant-placement turnaround); solid renter incomes; 4,709 units permitted in Madison County in 2024 (1,186 in 5+ unit buildings).
Forward outlook
- In year one you build about $25k of equity ($2k loan paydown + $23k appreciation (10.0% local appreciation)).
- Madison County population projected at +18% by 2050 — long-run rental-demand tailwind backs the buy-and-hold thesis.
- By year 2, paydown + projected appreciation supports a ~$40k cash-out refi (75% LTV) — recoverable capital for the next deal without selling this one.
Negotiation context
- It's been on market 79 days — a 6% lower offer ($216k) is reasonable based on typical stale-listing flexibility.
- 2 sale attempts with the ask held roughly flat each time — persistent listings suggest the price (not the market) is what's stuck; bring a comps-based counter.
Questions for the listing agent
- What do current leases actually rent for vs. the listed asking? Can we see a recent rent roll and the last 12 months of T-12 income?
- It's been on market 79 days. Have you received any prior offers? Is the seller open to a 23% concession, seller financing, or rate buy-down credit?
- What does the HOA fee cover, when was the last increase, and are there any pending special assessments or reserve-fund shortfalls?
- Why hasn't it sold? Are there any deal-killer items the seller is aware of (foundation, flood, title, zoning, code violations)?
- Is there a deadline driving the sale (1031 exchange, divorce, estate, relocation)? That informs how much negotiation room exists.
- Crime grade is F in this area — have there been break-ins, vandalism, or insurance claims at this property in the last 3 years? What carrier currently insures it and at what premium?
- The area grade is low — what's the realistic commute time and amenity access for the typical tenant pool here? Any planned neighborhood developments (good or bad) we should know about?
- What's the average days-on-market for RENTAL listings here right now (not sales)? A rising rental-DOM trend means longer vacancies and softer asking-rent achievability than the comps imply.
- What's the recent tenant-quality profile in this submarket — average credit score on applications, eviction rate, late-payment / NSF rate, and stable-employment percentage? A property-management company in the area should have these aggregated.
- How much new for-sale + rental construction is in the pipeline within 1–3 miles? Heavy new supply typically softens prices + rents 12–24 months out; constrained supply supports both.
Investment metrics
- 1% rule
- 0.77% ✗
- Cap rate
- 4.89%
- Cash-on-cash
- -5.01%
- DSCR
- 0.78
- GRM
- 10.9
CMA / ARV
- ARV (median comp)
- $237,738
- List price
- $229,900
- Delta
- -3.30%
- Verdict
- FAIR
- Comps
- 17 within 1.0 mi
Show comp detail 12 sales within ~0.75 mi
| Address | Dist | Beds/Ba | Sqft | Sold | Price | $/sf | Match |
|---|---|---|---|---|---|---|---|
| 7576 Discovery Point Dr | 0.00mi | 3/2.5 | 1,496 (+1%) | 2mo | $229,900 | $154 | 97 |
| 7583 Discovery Point Dr | 0.03mi | 3/2.5 | 1,554 (+5%) | 10mo | $224,850 | $145 | 82 |
| 7563 Discovery Point Dr | 0.05mi | 3/2.5 | 1,554 (+5%) | 10mo | $227,350 | $146 | 82 |
| 7561 Discovery Point Dr | 0.05mi | 3/2.5 | 1,554 (+5%) | 10mo | $224,850 | $145 | 82 |
| 7506 Discovery Point Dr | 0.17mi | 3/2.5 | 1,500 (+1%) | 14mo | $219,850 | $147 | 79 |
| 7508 Discovery Point Dr | 0.16mi | 3/2.5 | 1,554 (+5%) | 11mo | $224,850 | $145 | 76 |
| 7509 Discovery Point Dr | 0.16mi | 3/2.5 | 1,554 (+5%) | 13mo | $224,850 | $145 | 74 |
| 7507 Discovery Point Dr | 0.17mi | 3/2.5 | 1,554 (+5%) | 13mo | $224,850 | $145 | 74 |
| 7709 Helen Ln | 0.06mi | 3/3.0 | 1,376 (-7%) | 12mo | $233,447 | $170 | 73 |
| 7705 Helen Ln #119 | 0.05mi | 3/3.0 | 1,306 (-12%) | 7mo | $214,850 | $165 | 70 |
| 7703 Helen Ln | 0.05mi | 3/3.0 | 1,306 (-12%) | 8mo | $214,850 | $165 | 69 |
| 7707 Helen Ln | 0.06mi | 3/3.0 | 1,306 (-12%) | 9mo | $217,350 | $166 | 68 |
Match score weights: distance 35% · size 25% · config 20% · recency 20%. Top-matched comps best support the ARV.
Projected returns pro-forma
10.0% appreciation · 2.57% rent growth · sell at horizon
- IRR
- 20.6%
- Equity multiple
- 2.67×
- Total profit
- $107,398
- Equity at exit
- $207,112
- IRR
- 18.7%
- Equity multiple
- 6.10×
- Total profit
- $328,364
- Equity at exit
- $446,645
Cash invested: $64,372 (down + closing). Projections, not guarantees.
Landlord ↔ Tenant lean methodology
- Overall (STATE)
- 90 Strongly Landlord-Friendly
- State Alabama
- 90 Strongly Landlord-Friendly · R+15
- County
- — inherits STATE
- City
- — inherits STATE
ZIP-level market 35806
- Home prices YoY
- 20.0%
- Rents YoY
- 2.6%
- Active inventory
- 216
- Price-to-rent
- 10.9×
Monthly cashflow live
- Estimated rent
- $1,766 high interval (Pro) →
- Mortgage (P&I)
- −$1,206
- Tax est. 1.5%
- −$287 /mo · $3,448/yr
- Insurance
- −$96
- HOA
- −$75
- Vacancy / Maint / Mgmt
- −$371
- Net cashflow
- $-269
Break-even live
Sensitivity live
| Price | -10% $-110 | -5% $-189 | +0% $-269 | +5% $-348 | +10% $-428 |
|---|---|---|---|---|---|
| Rent | -10% $-408 | -5% $-339 | +0% $-269 | +5% $-199 | +10% $-129 |
| Rate | -1.0pp $-153 | -0.5pp $-210 | base $-269 | +0.5pp $-328 | +1.0pp $-389 |
UW: 25.0% down · 7.5% · 30yr · 1.5% tax · 5.0% vac · 8.0% maint · 8.0% mgmt
Financing live
Cash to close
- Down payment
- $57,475
- Closing costs
- $6,897
- Reserves months
- —
- Total cash needed
- —
Loan-product check · same deal, 3 products live
Conventional
25% down · 7.5% · 30yr
- Down + closing
- —
- Monthly P&I
- —
- Monthly cashflow
- —
- DSCR
- —
- Eligible?
- —
Personal DTI + credit; lowest rate.
DSCR
20% down · 8.5% · 30yr
- Down + closing
- —
- Monthly P&I
- —
- Monthly cashflow
- —
- DSCR
- —
- Eligible?
- —
No personal income docs; deal must DSCR.
Hard money
10% down · 12.0% · 12mo
- Down + closing
- —
- Monthly P&I
- —
- Monthly cashflow
- —
- DSCR
- —
- Eligible?
- —
Short-term bridge; refi at stabilization.
Rent comps 14 comps
| Address | Beds | Baths | Sqft | Rent | $/sqft | DOM | Units | Dist |
|---|---|---|---|---|---|---|---|---|
| 7582 Discovery Point Dr NW Huntsville, AL | 3.0 | 2.5 | 1500 | $1,720 | $1.15 | 25d | 1 | 0.01mi |
| 7589 Discovery Point Dr NW Huntsville, AL | 3.0 | 2.5 | 1500 | $1,720 | $1.15 | 25d | 1 | 0.02mi |
| 7597 Discovery Point Dr NW Huntsville, AL | 3.0 | 2.5 | 1550 | $1,800 | $1.16 | 25d | 1 | 0.04mi |
| 7599 Discovery Point Dr NW Huntsville, AL | 3.0 | 2.5 | 1500 | $1,720 | $1.15 | 25d | 1 | 0.04mi |
| 7601 Discovery Point Dr NW Huntsville, AL | 3.0 | 2.5 | 1720 | $1,720 | $1.00 | 45d | 1 | 0.05mi |
| 7559 Discovery Point Dr NW Huntsville, AL | 3.0 | 2.5 | 1555 | $2,450 | $1.58 | 16d | 1 | 0.05mi |
| 710 Nick Fitcheard Rd NW Huntsville, AL | 2.0 | 2.0 | 1200 | $1,359 | $1.13 | 16d | 7 | 0.09mi |
| 7502 Discovery Point Dr NW Huntsville, AL | 3.0 | 2.5 | 1626 | $1,825 | $1.12 | 45d | 1 | 0.18mi |
| 7500 Discovery Point Dr NW Huntsville, AL | 3.0 | 2.5 | 1527 | $1,822 | $1.19 | 16d | 7 | 0.19mi |
| 121 Foster Way Dr Huntsville, AL | 2.0 | 2.0 | 937 | $1,295 | $1.38 | 45d | 1 | 1.25mi |
| 125 Foster Way Dr Huntsville, AL | 2.0 | 2.0 | 937 | $1,350 | $1.44 | 45d | 1 | 1.27mi |
| 41 Addison Park Dr Huntsville, AL | 1.0–3.0 | 1.0–2.0 | 1155 | $1,635 | $1.42 | 16d | 45 | 1.28mi |
| 741 Plummer Rd Huntsville, AL | 1.0–3.0 | 1.0–2.0 | 1025 | $1,744 | $1.70 | 16d | 15 | 1.33mi |
| 1012 Scarlet Woods Huntsville, AL | 2.0 | 2.0 | 1626 | $1,699 | $1.04 | 23d | 1 | 1.44mi |
HOA detail
- Monthly dues
- $75 · $900/yr
Listing history 19 events
-
2026-06-22days on market $229,900 Active 79 DOM
-
2026-06-18days on market $229,900 Active 76 DOM
-
2026-06-17days on market $229,900 Active 75 DOM
-
2026-06-16days on market $229,900 Active 74 DOM
-
2026-06-15days on market $229,900 Active 73 DOM
-
2026-06-14days on market $229,900 Active 71 DOM
-
2026-06-10days on market $229,900 Active 68 DOM
-
2026-06-09days on market $229,900 Active 67 DOM
-
2026-06-08days on market $229,900 Active 66 DOM
-
2026-06-07days on market $229,900 Active 65 DOM
-
2026-06-03days on market $229,900 Active 61 DOM
-
2026-06-02days on market $229,900 Active 60 DOM
-
2026-06-01days on market $229,900 Active 59 DOM
-
2026-05-31days on market $229,900 Active 58 DOM
-
2026-05-30days on market $229,900 Active 57 DOM
-
2026-04-05historical $1,720
-
2026-04-03$229,900 Active 600-char remark
Show marketing remark (600 chars)
TRANSFERABLE 2-10 WARRANTY REMAINING! Modern 3BR/2.5BA townhome in the heart of Huntsville! This stylish home features an open-concept layout, gourmet kitchen with beautiful countertops, stainless steel appliances, and a spacious living area perfect for entertaining. The primary suite offers a walk-in closet and private bath. Home will also come with a new refrigerator and blinds. Enjoy low-maintenance living with a private patio and attached garage. Convenient to Redstone Arsenal, Research Park, and the Midtown development with dining and shopping. All information to be verified by purchaser.
-
2026-03-29price $1,720
-
2026-03-12$1,750
ⓘ Source: listings_history table (triggers on properties + properties_extension) + one-shot
backfill from property_details.listing_events for pre-trigger history.
Nearby sold comps map
Loading sold comps map…
Walkable amenities ~0.75 mi
Loading nearby amenities…
Taxation est. · year 1
- Rental income
- $21,189
- − Mortgage interest
- −$12,878
- − Property taxes
- −$3,448
- − Insurance
- −$1,150
- − Repairs & maintenance
- −$1,695
- − Management
- −$1,695
- − HOA
- −$900
- − Depreciation
- −$6,688
- Taxable loss
- −$7,265
- Est. tax savings @ 24.0%
- +$1,744
- After-tax cash flow
- $-1,483/yr
For passive investors: Depreciation is non-cash, so a rental often shows a tax loss while cash-flowing — sheltering income. Rental losses are passive: they offset passive income freely, and up to $25,000/yr can offset ordinary (W-2) income if you actively participate and your MAGI is under $100k (phasing out to $0 by $150k); unused losses carry forward. On sale, claimed depreciation is recaptured at up to 25%, and gains may owe capital-gains tax (a 1031 exchange can defer both). Figures are a year-1 estimate at your 24.0% rate — not tax advice; consult a CPA.
Schools (NCES district)
- District
- Huntsville City
- NCES district ID
- 0101800
- Math proficiency
- 21% ▼ -23.00%
- Reading proficiency
- 46% ▬ 0.00%
- Median HH income
- $48,264
- Composite
- 28.84/100
- National rank
- #6647
- State rank
- #48 of 129 in AL
Livability — Huntsville
- Score
- 82/100
- State rank
- #3
- US rank
- #1082
Category grades
Schools grade is shown separately in the Schools card above.
Census & demographics
- Census place
- Huntsville, AL
- County
- Madison County · 380,832 people
- City population
- 220,435
- Metro
- Huntsville, AL
- Population (ZIP)
- 29,161
- Household income
- $86,768
- Rent vs Own
- Severe rent burden
- 1249.0
Population outlook (Madison County) Hauer SSP2
- Today (2025)
- 392,086 people
- By 2030
- 409,788 · +4.5%
- By 2040
- 440,557 · +12.4%
- By 2050
- 460,990 · +17.6%
- By 2075
- 502,872 · +28.3%
- By 2100
- 513,623 · +31.0%
Race, ethnicity, and origin ACS 2023
- Neighborhood character
- Diverse neighborhood (Simpson 0.57)
- Race & ethnicity
- White 58% Black 30% Hispanic / Latino 5% Two or more races 5% Asian 4%
- Hispanic origin (detail)
- Mexican 2% Puerto Rican 2%
- Common ancestry
- Slovak 2% Italian 2% Serbian 2%
- Foreign-born
- 7% · Canada, Vietnam, China
- Languages at home
- 93% English-only · Spanish 2% Other Indo-European 1% Other Asian/Pacific 1%
Political lean MEDSL · Madison
- 2024 margin
- Lean R (+9.0) · D 44.7% · R 53.7% · Other 1.6%
- 2008→2024 swing
- +6.0pp toward D · 2008: -14.9pp · 2024: -9.0pp
- All cycles
- 2024: R+9.0 2020: R+8.0 2016: R+16.8 2012: R+18.7 2008: R+14.9
Not yet ingested
- Civics
- —
Market trends
- HPI YoY
- ▲ 71.67%
- Current HPI
- 430.5866
- Rent YoY
- ▲ 2.57%
- Metro
- Huntsville, AL
- State GDP YoY
- ▲ 2.94%
- F500 in state
- 4
Industry mix (Fortune 500 HQ in AL)
| Industry | F500 HQs | Revenue |
|---|---|---|
| Financial Services | 1 | $8B |
|
||
| Healthcare | 1 | $5B |
|
||
Price history
-1.7% since first listed4 events — show timeline
- 2026-04-05 Rental Removed $1,720 TENANTTURNER2
- 2026-04-03 Listed $229,900 VMLS
- 2026-03-29 Price Changed $1,720 TENANTTURNER2
- 2026-03-12 Listed for Rent $1,750 TENANTTURNER2
Cash-flow waterfall
monthlySold comps — $/sqft
last 12 mo · ≤1 miLoading sold comps…