611 W Jackson St · Piggott, AR
Flood risk 4/10 · Minor
- FEMA flood zone
- X (unshaded)
- Chance of flooding over 30 yrs
- 0.22%
- Est. flood insurance / yr
- $507 – $1,088
Fire risk 3/10 · Minor
- Est. fire insurance / yr
- $1,499 – $2,785
Heat risk 5/10 · Moderate
- Hot days now (above 109°F)
- 7 days/yr
- Hot days in 30 yrs
- 20 days/yr
Wind risk 3/10 · Minor
- Chance of severe wind over 30 yrs
- 6.0%
Air-quality risk 2/10 · Minimal
- Unhealthy air days now
- 0 days/yr
- Unhealthy air days in 30 yrs
- 1 days/yr
Risk factors via First Street. Map © Google.
Why this score? — see what drove the B+ grade
The composite is a weighted blend of 9 inputs, each scored 0–100. Each bar is that input's sub-score; the figure is the points it added to the 100-point composite (weight × sub-score).
- Cash flow +30.0/30.0
- 1% rule +10.0/10.0
- DSCR +10.0/10.0
- Appreciation +10.0/10.0
- ARV discount +7.5/15.0
- Livability +3.5/5.0
- Rent growth +2.5/5.0
- Schools +2.5/10.0
- Condition / age +2.5/5.0
$35,000
🖨 Deal sheet 📄 Offer letter ✓ Due diligence
Listing remarks MLS
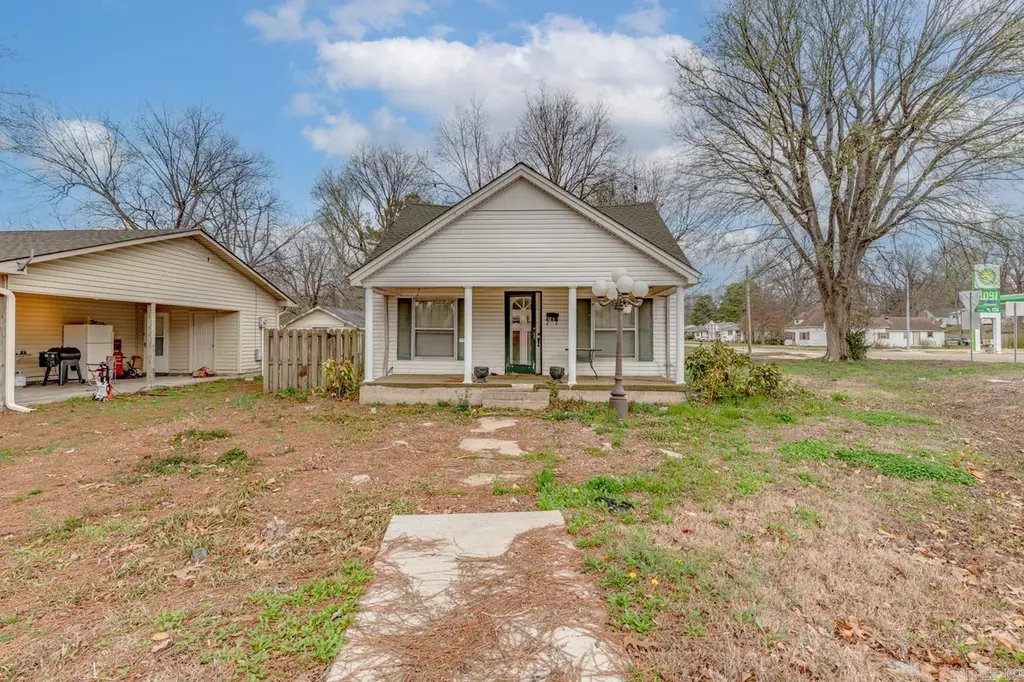
Welcome to the market 611 W Jackson St, a corner‑lot property located in the heart of Piggott, Arkansas. This parcel offers a valuable opportunity for buyers seeking an affordable, utility‑ready site with excellent potential for redevelopment. Approximately 0.20 acres, this property sits on a 125 ft 70 ft lotproviding ample room for a new build, investment structure, or future expansion. All major utilities are already on site, including water, electric, and gas, making this a convenient and cost‑efficient starting point for your next project. The existing structure on the property has been condemned by the city, and the true value lies in the land itself. Buyers can take advantage of a clean slate to design and construct a residence or investment property tailored to their needs. This location places you within minutes of Piggott's local amenities, schools, and community services. Whether you're a builder, investor, or future homeowner, 611 W Jackson St presents a rare chance to secure a utility‑ready lot in an established neighborhood. Call today! House has been condemned.
Key facts
- Utility-ready site
- Corner-lot property
- 125 ft x 70 ft lot
Tags
Neighborhood map
What this means for you Summary
Snapshot
- This is a 2-bed/1.0-bath single-family listed at $35k.
Deal economics
- At list price, monthly cash flow is $485 ($6k/yr) — positive.
- The deal already cash-flows at list — no discount required.
- Meets the 1% rule at list price ($941 rent vs $35k).
- Recommended offer: $32k (9.0% below list) — sets the bar for market timing.
- Cap rate 22.9% vs local median 4.4% in Piggott — top-decile yield for the area; either an underpriced asset or a hidden risk that comps aren't pricing in. Stress-test before assuming the spread holds.
Location & tenants
- Location reads 70/100 on livability (#50 in AR) — a middle-class / working-renter tenant base. Strengths: crime A+, cost of living A+, housing A+; Watch: schools F, amenities F, commute F.
- Piggott School District (town): math 32% / reading 28% proficiency, ranked #157 of 238 in AR (top 66%) — families likely to look elsewhere, expect single-tenant / working-renter base with shorter leases.
- Market conditions: 71 active listings in the ZIP; 4 units permitted in Clay County in 2024 (0 in 5+ unit buildings).
Forward outlook
- In year one you build about $4k of equity ($242 loan paydown + $4k appreciation (10.0% local appreciation)).
- Clay County population projected at -24% by 2050 — secular population decline; favor cash flow + early exit over multi-decade hold.
- At projected returns (10.0% appreciation + 3.0% rent growth), your $10k cash investment doubles in ~2 years — after that, you're playing with house money.
- By year 8, paydown + projected appreciation supports a ~$33k cash-out refi (75% LTV) — recoverable capital for the next deal without selling this one.
Negotiation context
- It's been on market 95 days — a 9% lower offer ($32k) is reasonable based on typical stale-listing flexibility.
- 2 sale attempts with the ask held roughly flat each time — persistent listings suggest the price (not the market) is what's stuck; bring a comps-based counter.
- Current owner paid $26k; 33% above their basis — modest negotiation headroom, anchor on the comps not their cost.
Risks & watch-outs
- Climate carrying-cost: extreme-heat days projected 7→20/yr by 2055 (HVAC capex compounding) — expect insurance premiums to compound above CPI over the hold.
Questions for the listing agent
- It's been on market 95 days. Have you received any prior offers? Is the seller open to a 9% concession, seller financing, or rate buy-down credit?
- Why hasn't it sold? Are there any deal-killer items the seller is aware of (foundation, flood, title, zoning, code violations)?
- Is there a deadline driving the sale (1031 exchange, divorce, estate, relocation)? That informs how much negotiation room exists.
- Schools are F-rated, which usually means shorter tenancies and higher turnover. Who's the typical renter profile here, and what's been the actual vacancy rate?
- What's the average days-on-market for RENTAL listings here right now (not sales)? A rising rental-DOM trend means longer vacancies and softer asking-rent achievability than the comps imply.
- What's the recent tenant-quality profile in this submarket — average credit score on applications, eviction rate, late-payment / NSF rate, and stable-employment percentage? A property-management company in the area should have these aggregated.
- How much new for-sale + rental construction is in the pipeline within 1–3 miles? Heavy new supply typically softens prices + rents 12–24 months out; constrained supply supports both.
Investment metrics
- 1% rule
- 2.69% ✓
- Cap rate
- 22.93%
- Cash-on-cash
- 59.42%
- DSCR
- 3.64
- GRM
- 3.1
CMA / ARV
- ARV (median comp)
- $135,752
- List price
- $35,000
- Delta
- -74.22%
- Verdict
- UNDERPRICED
- Comps
- 20 within 1.0 mi
Show comp detail 12 sales within ~0.75 mi
| Address | Dist | Beds/Ba | Sqft | Sold | Price | $/sf | Match |
|---|---|---|---|---|---|---|---|
| 162 S 10th Ave | 0.33mi | 3/2.0 (+1) | 1,507 (+3%) | 4mo | $52,700 | $35 | 67 |
| 1075 W Clay | 0.43mi | 3/2.0 (+1) | 1,536 (+5%) | 2mo | $69,900 | $46 | 61 |
| 420 N 12th Ave | 0.44mi | 3/2.0 (+1) | 1,344 (-8%) | 1mo | $166,500 | $124 | 56 |
| 677 Crestline Dr | 0.61mi | 2/1.0 | 1,308 (-11%) | 3mo | $69,500 | $53 | 51 |
| 1290 W North St | 0.61mi | 3/2.0 (+1) | 1,553 (+6%) | 2mo | $162,500 | $105 | 51 |
| 811 Sugar Creek Ln | 0.31mi | 3/2.0 (+1) | 1,272 (-13%) | 12mo | $225,000 | $177 | 44 |
| 980 Homecrest Dr | 0.45mi | 3/2.0 (+1) | 1,271 (-13%) | 5mo | $161,500 | $127 | 44 |
| 1120 Frisco Ln | 0.56mi | 3/2.0 (+1) | 1,286 (-12%) | 2mo | $152,000 | $118 | 43 |
| 710 E Jackson St | 0.69mi | 3/2.0 (+1) | 1,344 (-8%) | 9mo | $42,500 | $32 | 37 |
| 387 S Garfield Ave | 0.73mi | 1/1.0 (-1) | 1,256 (-14%) | 2mo | $6,000 | $5 | 35 |
| 560 S 14th Ave | 0.70mi | 3/2.0 (+1) | 1,311 (-10%) | 11mo | $261,500 | $199 | 32 |
| 560 S 14th Ave | 0.70mi | 3/2.0 (+1) | 1,311 (-10%) | 11mo | $261,500 | $199 | 32 |
Match score weights: distance 35% · size 25% · config 20% · recency 20%. Top-matched comps best support the ARV.
Projected returns pro-forma
10.0% appreciation · 3.0% rent growth · sell at horizon
- IRR
- 71.7%
- Equity multiple
- 6.10×
- Total profit
- $49,995
- Equity at exit
- $31,531
- IRR
- 65.5%
- Equity multiple
- 13.55×
- Total profit
- $122,969
- Equity at exit
- $67,997
Cash invested: $9,800 (down + closing). Projections, not guarantees.
Landlord ↔ Tenant lean methodology
- Overall (STATE)
- 92 Strongly Landlord-Friendly
- State Arkansas
- 92 Strongly Landlord-Friendly · R+14
- County
- — inherits STATE
- City
- — inherits STATE
ZIP-level market 72454
- Home prices YoY
- 3.4%
- Active inventory
- 71
- Price-to-rent
- 3.1×
Monthly cashflow live
- Estimated rent
- $941 medium interval (Pro) →
- Mortgage (P&I)
- −$184
- Tax from tax record
- −$60 /mo · $718/yr
- Insurance
- −$15
- HOA
- −$0
- Vacancy / Maint / Mgmt
- −$198
- Net cashflow
- $485
Break-even live
UW: 25.0% down · 7.5% · 30yr · 1.5% tax · 5.0% vac · 8.0% maint · 8.0% mgmt
Financing live
Cash to close
- Down payment
- $8,750
- Closing costs
- $1,050
- Reserves months
- —
- Total cash needed
- —
Loan-product check · same deal, 3 products live
Conventional
25% down · 7.5% · 30yr
- Down + closing
- —
- Monthly P&I
- —
- Monthly cashflow
- —
- DSCR
- —
- Eligible?
- —
Personal DTI + credit; lowest rate.
DSCR
20% down · 8.5% · 30yr
- Down + closing
- —
- Monthly P&I
- —
- Monthly cashflow
- —
- DSCR
- —
- Eligible?
- —
No personal income docs; deal must DSCR.
Hard money
10% down · 12.0% · 12mo
- Down + closing
- —
- Monthly P&I
- —
- Monthly cashflow
- —
- DSCR
- —
- Eligible?
- —
Short-term bridge; refi at stabilization.
Listing history 21 events
-
2026-06-19days on market $35,000 Active 95 DOM
-
2026-06-18days on market $35,000 Active 94 DOM
-
2026-06-17days on market $35,000 Active 93 DOM
-
2026-06-16days on market $35,000 Active 92 DOM
-
2026-06-15days on market $35,000 Active 91 DOM
-
2026-06-14days on market $35,000 Active 89 DOM
-
2026-06-12days on market $35,000 Active 88 DOM
-
2026-06-09days on market $35,000 Active 85 DOM
-
2026-06-08days on market $35,000 Active 84 DOM
-
2026-06-07days on market $35,000 Active 83 DOM
-
2026-06-05days on market $35,000 Active 81 DOM
-
2026-06-04days on market $35,000 Active 79 DOM
-
2026-06-02days on market $35,000 Active 78 DOM
-
2026-06-01days on market $35,000 Active 77 DOM
-
2026-05-31days on market $35,000 Active 76 DOM
-
2026-05-31days on market $35,000 Active 75 DOM
-
2026-03-17$35,000 Active 1092-char remark
Show marketing remark (1092 chars)
Welcome to the market 611 W Jackson St, a corner‑lot property located in the heart of Piggott, Arkansas. This parcel offers a valuable opportunity for buyers seeking an affordable, utility‑ready site with excellent potential for redevelopment. Approximately 0.20 acres, this property sits on a 125 ft 70 ft lotproviding ample room for a new build, investment structure, or future expansion. All major utilities are already on site, including water, electric, and gas, making this a convenient and cost‑efficient starting point for your next project. The existing structure on the property has been condemned by the city, and the true value lies in the land itself. Buyers can take advantage of a clean slate to design and construct a residence or investment property tailored to their needs. This location places you within minutes of Piggott's local amenities, schools, and community services. Whether you're a builder, investor, or future homeowner, 611 W Jackson St presents a rare chance to secure a utility‑ready lot in an established neighborhood. Call today! House has been condemned.
-
2026-03-16$35,000 New Listing 1086-char remark
Show marketing remark (1086 chars)
Welcome to the market 611 W Jackson St, a corner-lot property located in the heart of Piggott, Arkansas. This parcel offers a valuable opportunity for buyers seeking an affordable, utility-ready site with excellent potential for redevelopment. Approximately 0.20 acres, this property sits on a 125 ft × 70 ft lot—providing ample room for a new build, investment structure, or future expansion. All major utilities are already on site, including water, electric, and gas, making this a convenient and cost-efficient starting point for your next project. The existing structure on the property has been condemned by the city, and the true value lies in the land itself. Buyers can take advantage of a clean slate to design and construct a residence or investment property tailored to their needs. This location places you within minutes of Piggott’s local amenities, schools, and community services. Whether you're a builder, investor, or future homeowner, 611 W Jackson St presents a rare chance to secure a utility-ready lot in an established neighborhood. Call today!
-
2021-08-18soldstatus $26,250
-
2013-09-04soldstatus $50,000
-
1997-06-04soldstatus $34,000
ⓘ Source: listings_history table (triggers on properties + properties_extension) + one-shot
backfill from property_details.listing_events for pre-trigger history.
Tax reassessment forecast AR · Resets to sale price
- Current annual tax
- $718 · $60/mo
- Projected year-2 tax
- $718 · $60/mo
- Expected delta
- $0/yr ($0/mo · 0.0%)
ⓘ Screening estimate from a state-policy table — verify with the county assessor before closing.
Climate risk First Street
- Flood 4/10 Moderate FEMA zone X (unshaded) · 22% chance over 30 yrs
- Wildfire 3/10 Moderate
- Heat 5/10 Major 7 d/yr ≥109°F today · 20 d/yr by 30 yrs out
- Wind 3/10 Moderate 6% chance of damaging wind over 30 yrs
- Air quality 2/10 Low 0 unhealthy d/yr today · 1 by 30 yrs out
Nearby sold comps map
Loading sold comps map…
Walkable amenities ~0.75 mi
Loading nearby amenities…
Taxation est. · year 1
- Rental income
- $11,289
- − Mortgage interest
- −$1,961
- − Property taxes
- −$718
- − Insurance
- −$175
- − Repairs & maintenance
- −$903
- − Management
- −$903
- − Depreciation
- −$1,018
- Taxable income
- $5,612
- Est. tax owed @ 24.0%
- −$1,347
- After-tax cash flow
- $4,477/yr
For passive investors: Depreciation is non-cash, so a rental often shows a tax loss while cash-flowing — sheltering income. Rental losses are passive: they offset passive income freely, and up to $25,000/yr can offset ordinary (W-2) income if you actively participate and your MAGI is under $100k (phasing out to $0 by $150k); unused losses carry forward. On sale, claimed depreciation is recaptured at up to 25%, and gains may owe capital-gains tax (a 1031 exchange can defer both). Figures are a year-1 estimate at your 24.0% rate — not tax advice; consult a CPA.
Schools (NCES district)
- District
- Piggott School District
- NCES district ID
- 0511370
- Math proficiency
- 32% ▼ -15.00%
- Reading proficiency
- 28% ▼ -10.00%
- Median HH income
- $33,336
- Composite
- 24.63/100
- National rank
- #7628
- State rank
- #157 of 238 in AR
Livability — Piggott
- Score
- 70/100
- State rank
- #50
- US rank
- #7358
Category grades
Schools grade is shown separately in the Schools card above.
Census & demographics
- Census place
- Piggott, AR
- Population (ZIP)
- 4,699
Population outlook (Clay County) Hauer SSP2
- Today (2025)
- 13,564 people
- By 2030
- 12,834 · -5.4%
- By 2040
- 11,498 · -15.2%
- By 2050
- 10,325 · -23.9%
- By 2075
- 8,228 · -39.3%
- By 2100
- 6,675 · -50.8%
Race, ethnicity, and origin ACS 2023
- Neighborhood character
- Predominantly White (94%)
- Race & ethnicity
- White 94% Two or more races 5% Hispanic / Latino 2%
- Common ancestry
- Slovak 1% Serbian 1% Italian 1%
- Foreign-born
- 1%
- Languages at home
- 99% English-only · German/W. Germanic 1%
Political lean MEDSL · Clay
- 2024 margin
- Solid R (+61.6) · D 18.3% · R 79.9% · Other 1.9%
- 2008→2024 swing
- -47.3pp toward R · 2008: -14.3pp · 2024: -61.6pp
- All cycles
- 2024: R+61.6 2020: R+60.3 2016: R+29.8 2012: R+29.1 2008: R+14.3
Not yet ingested
- Civics
- —
Market trends
- HPI YoY
- ▲ 11.57%
- Current HPI
- 355.7877
- Rent YoY
- —
- Metro
- —
- State GDP YoY
- ▲ 3.80%
- F500 in state
- 10
Industry mix (Fortune 500 HQ in AR)
| Industry | F500 HQs | Revenue |
|---|---|---|
| Retail | 1 | $681B |
|
||
| Food / Agriculture | 1 | $53B |
|
||
| Retail / Energy | 1 | $22B |
|
||
| Transportation / Logistics | 1 | $12B |
|
||
| Energy | 1 | $4B |
|
||
Price history
+2.9% since first listed5 events — show timeline
- 2026-03-17 Listed $35,000 NEABOR MLS
- 2026-03-16 Listed $35,000 CARMLS
- 2021-08-18 Sold (Public Records) $26,250 Public Records
- 2013-09-04 Sold (Public Records) $50,000 Public Records
- 1997-06-04 Sold (Public Records) $34,000 Public Records
Property tax history
+3.7%/yrLatest (2025): $718 · +0.0% YoY. Source: county tax records.
Cash-flow waterfall
monthlySold comps — $/sqft
last 12 mo · ≤1 miLoading sold comps…